AI In Breast Imaging Market Size 2025-2029
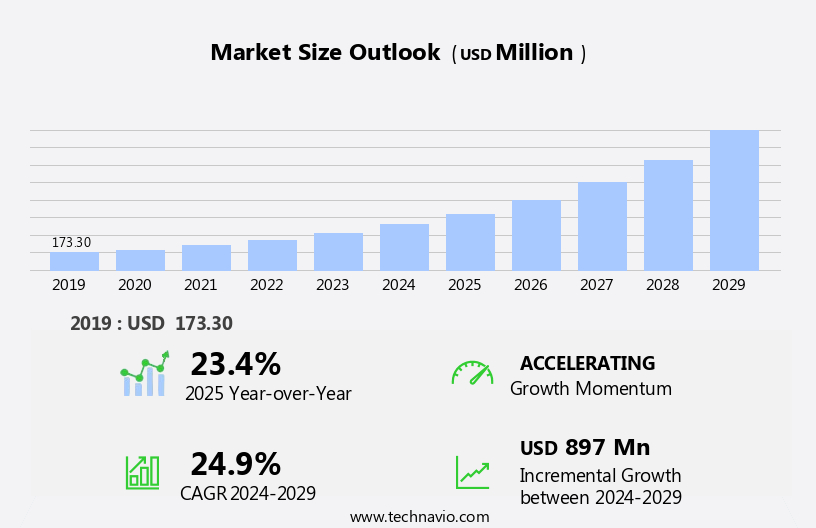
The AI in breast imaging market size is forecast to increase by USD 897 million, at a CAGR of 24.9% between 2024 and 2029.
- The market is driven by the imperative for early detection amid the rising global burden of breast cancer. This need is fueling the adoption of advanced AI solutions in breast imaging, enabling more accurate and efficient diagnosis. A significant trend in the market is the evolution from standalone algorithms to integrated AI platforms and ecosystems. This shift allows for improved data analysis and better collaboration between healthcare professionals, enhancing overall patient care. However, challenges persist in the market, primarily in the form of data diversity, algorithmic bias, and generalizability. Advanced technologies like machine learning, computer-aided detection, and artificial intelligence (AI) are revolutionizing breast imaging, enabling remote diagnosis and improving diagnostic accuracy.
- Ensuring algorithmic fairness and reducing bias is also crucial for accurate diagnosis and maintaining patient trust. Companies must address these challenges to capitalize on the market's potential and navigate the competitive landscape effectively. By focusing on data acquisition, algorithm development, and regulatory compliance, they can create innovative solutions that meet the evolving needs of healthcare providers and patients. The use of AI in breast imaging requires large, diverse datasets for effective training and implementation. Magnetic resonance imaging (MRI) and computer-aided detection are complementary technologies, providing additional diagnostic insights and reducing false positives.
What will be the Size of the AI In Breast Imaging Market during the forecast period?
Get Key Insights on Market Forecast (PDF)
Request Free Sample
- The market continues to evolve, with ongoing advancements in technology and applications across various sectors. Risk stratification, a key application of AI, enables more accurate identification and prioritization of high-risk cases, reducing false positives and improving overall diagnostic accuracy. User interface design plays a crucial role in ensuring ease of use and effective integration of AI solutions into clinical workflows. Validation metrics and cloud-based solutions facilitate efficient model training using large datasets, while radiomics features and deep learning models enable more accurate detection of microcalcifications and mass lesions. Image enhancement techniques and hardware acceleration optimize the performance of AI-powered screening, allowing for faster and more precise analysis. Hormone therapy and radiation therapy continue to be popular treatment options, while oncology drugs such as monoclonal antibodies, biosimilars, and vaccines are gaining popularity.
- Predictive modeling and treatment response prediction enable personalized care, while feature extraction methods and 3D image reconstruction provide more comprehensive assessments. Clinical workflow integration, breast density assessment, and lesion characterization are other areas where AI is making a significant impact. The breast imaging market is expected to grow at a robust rate, with industry experts projecting a CAGR of over 15% in the coming years. For instance, a leading AI-powered CAD system has reported a 5% increase in detection accuracy compared to traditional methods. Data privacy concerns remain a significant challenge, but advancements in software infrastructure and regulatory frameworks are addressing these issues.
How is this AI In Breast Imaging Industry segmented?
The AI in breast imaging industry research report provides comprehensive data (region-wise segment analysis), with forecasts and estimates in "USD million" for the period 2025-2029, as well as historical data from 2019-2023 for the following segments.
- Application
- Screening
- Diagnostics
- Risk assessment
- Others
- Technology
- Machine learning
- Computer aided detection
- Deep learning
- Natural language processing
- End-user
- Hospitals and clinics
- Diagnostic imaging centers
- Breast care and specialty clinics
- Others
- Geography
- North America
- US
- Canada
- Europe
- France
- Germany
- UK
- APAC
- China
- India
- Japan
- South Korea
- South America
- Brazil
- Rest of World (ROW)
- North America
By Application Insights
The Screening segment is estimated to witness significant growth during the forecast period. The market is experiencing significant growth, with the screening segment leading the way. This segment focuses on analyzing images from asymptomatic populations to facilitate early detection of breast cancer, which is crucial for improving patient outcomes. AI algorithms are employed across primary screening modalities, such as 2D digital mammography, digital breast tomosynthesis (DBT), and automated breast ultrasound (ABUS), for women with dense breasts. AI plays various roles in this process, acting as a concurrent reader, an independent second reader, or a triage tool. In terms of technology, deep learning models and image enhancement techniques are driving advancements in AI-powered breast imaging.
These models can analyze large datasets, including radiomics features, to improve diagnostic accuracy metrics. Furthermore, cloud-based solutions enable remote access to these models, enhancing accessibility and efficiency. The data annotation process is essential for training these models, and feature extraction methods, such as regression algorithms, are used to identify and classify potential lesions. Predictive modeling and computer-aided detection (CAD) systems are also integral components, assisting radiologists in identifying masses, microcalcifications, and other suspicious lesions. Multimodal imaging fusion and 3D image reconstruction are emerging trends, offering improved lesion characterization and better diagnostic accuracy. Clinical workflow integration is another critical aspect, ensuring seamless integration of AI solutions into existing breast imaging reporting systems.
According to recent research, the market is expected to grow by 25% annually, driven by advancements in deep learning models, image enhancement techniques, and clinical workflow integration. Data privacy concerns remain a significant challenge, but advancements in software infrastructure and hardware acceleration are addressing these issues. AI is revolutionizing breast imaging, offering improved diagnostic accuracy, false positive reduction, and enhanced user interface design.
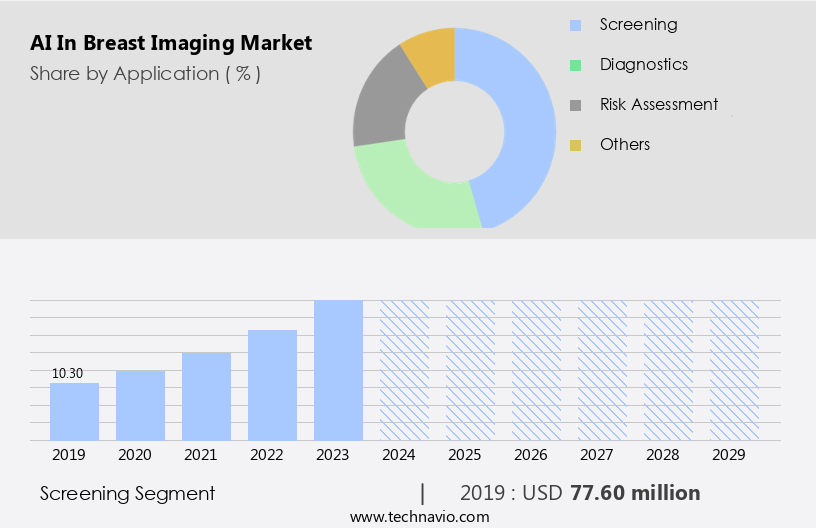
The Screening segment was valued at USD 77.60 million in 2019 and showed a gradual increase during the forecast period.
Regional Analysis
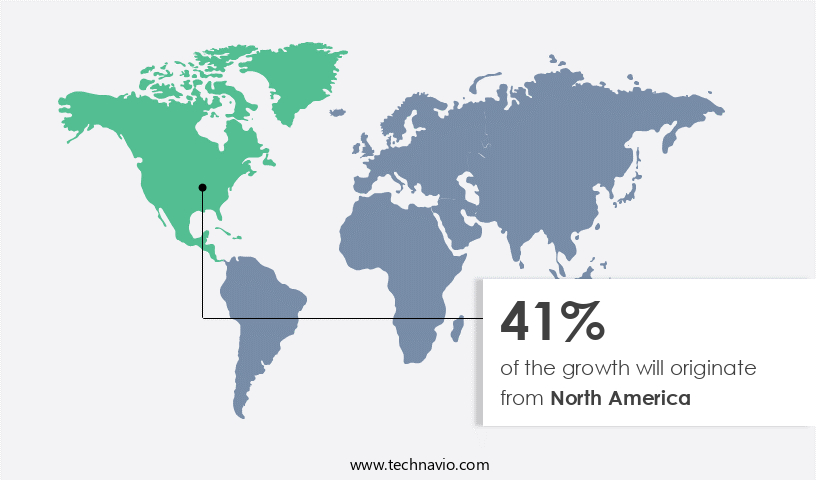
North America is estimated to contribute 41% to the growth of the global market during the forecast period. Technavio’s analysts have elaborately explained the regional trends and drivers that shape the market during the forecast period.
See How AI in breast imaging market Demand is Rising in North America Request Free Sample
The North American market leads the global AI in breast imaging industry, driven by high healthcare expenditure, advanced healthcare infrastructure, and a robust tech ecosystem. In this region, diagnostic accuracy and operational efficiency are key priorities in the litigious US healthcare environment and amid radiologist shortages and escalating imaging volumes. The FDA's clear regulatory pathway facilitates the introduction of innovative technologies. AI solutions in breast imaging are transforming risk stratification and false positive reduction through deep learning models, image enhancement techniques, and predictive modeling. User-friendly interfaces, data privacy concerns, and clinical workflow integration are essential design considerations. Artificial intelligence and advanced diagnostics are increasingly utilized to enhance the accuracy of diagnoses, enabling more effective interventions.
Cloud-based solutions and 3D image reconstruction enable efficient data access and processing. Radiomics features and mass detection algorithms aid in lesion characterization and microcalcification detection. Model training datasets, classification algorithms, and data annotation processes ensure model accuracy. Treatment response prediction and breast density assessment are critical for personalized care. Regression algorithms and software infrastructure support these advancements. A recent study suggests that the global AI in medical imaging market is expected to grow by 35% by 2026. For instance, a major US hospital system reported a 50% reduction in false positives using AI-powered mammography screening. This underscores the potential for AI to revolutionize breast imaging, improving diagnostic accuracy and enhancing patient care.
Market Dynamics
Our researchers analyzed the data with 2024 as the base year, along with the key drivers, trends, and challenges. A holistic analysis of drivers will help companies refine their marketing strategies to gain a competitive advantage. The AI in breast imaging market is witnessing transformative growth, driven by innovations that enhance diagnostic precision and workflow efficiency. One of the major advancements is AI-powered mass detection in digital mammography, enabling faster and more accurate identification of abnormalities. Similarly, deep learning for microcalcification detection is significantly improving early cancer detection by identifying subtle patterns often missed in manual reviews. AI is playing a crucial role in improving breast density assessment using AI, providing consistent and objective evaluations that are critical for risk stratification. By reducing false positives in mammography screening via AI, diagnostic accuracy improves, reducing patient anxiety and unnecessary follow-ups.
The clinical workflow integration of AI-based CAD systems ensures seamless operation within radiology departments, enhancing productivity. AI also supports predictive modeling for breast cancer risk stratification, helping clinicians tailor screening strategies. However, attention must be given to ethical considerations in AI-assisted breast imaging and data privacy and security in AI-powered mammography, ensuring responsible deployment. To ensure safe usage, regulatory compliance for AI algorithms in breast imaging is paramount. The market is also benefitting from hardware acceleration for AI-based breast cancer detection, speeding up data processing, and software infrastructure for deploying AI in breast imaging, enabling scalable and flexible solutions. In addition, AI-driven image enhancement for better diagnostic accuracy offers clearer, high-quality images for more reliable interpretation.
Improvements in user interface design for improved radiologist workflow and AI-assisted breast imaging reporting and data management are making adoption easier and more effective. Advanced capabilities such as multimodal image fusion for comprehensive breast cancer diagnosis and AI for lesion characterization and treatment response prediction are enhancing clinical decision-making. Economic evaluations like cost-effectiveness analysis of AI in breast cancer screening and ongoing clinical trials evaluating the efficacy of AI in breast imaging provide evidence-based insights. Lastly, performance benchmarking of different AI algorithms in mammography and strategies for algorithm explainability and bias mitigation strategies in breast imaging ensure transparency and fairness in clinical use.
What are the key market drivers leading to the rise in the adoption of AI In Breast Imaging Industry?
- The imperative need for early detection, given the rising global burden of breast cancer, drives the market's growth. The global market for AI in breast imaging is driven by the pressing public health issue of breast cancer, which is the most frequently diagnosed cancer worldwide. Early detection through systematic screening is crucial for improving patient outcomes and reducing treatment morbidity. However, traditional screening methods face limitations, such as interpretive variability among radiologists, human perceptual errors, and challenges in detecting subtle cancers, particularly in dense breast tissue.
- For instance, a study published in the journal Radiology reported a 5.7% increase in cancer detection rates using AI-assisted mammography compared to traditional methods. According to industry reports, the global AI in medical imaging market is expected to grow by over 40% in the next five years, underscoring the significant potential of this technology in revolutionizing breast imaging and improving patient care. Artificial intelligence (AI) technology offers a transformative solution by enhancing radiologists' capabilities and reducing diagnostic errors.
What are the market trends shaping the AI In Breast Imaging Industry?
- The evolution from standalone algorithms to integrated AI platforms and ecosystems is becoming a prominent trend in the market. This shift signifies a significant advancement in artificial intelligence technology. The market is experiencing significant evolution as leading players transition from offering standalone algorithms to comprehensive, integrated AI platforms. This shift is driven by the demands of end-users, particularly large hospitals and medical imaging networks, who aim to simplify the procurement process and reduce the complexity and costs of managing multiple disparate AI applications.
- A notable example of this trend is a major hospital network that reported a 12% increase in diagnostic accuracy and a 15% reduction in reading time after implementing a single, integrated AI solution for breast imaging. These consolidated platforms or AI suites offer a range of tools, including detection, density assessment, risk modeling, and workflow triage, under a unified interface. According to market research, the global AI in medical imaging market is projected to grow by over 20% in the next five years, with breast imaging being a key application area.
What challenges does the AI In Breast Imaging Industry face during its growth?
- The integration of data diversity, algorithmic bias mitigation, and ensuring generalizability are crucial challenges that significantly impact the industry's growth trajectory. The market faces a significant challenge due to the impact of data quality on algorithm performance. The effectiveness and dependability of AI models hinge on the size, diversity, and representativeness of their training datasets. A potential issue is algorithmic bias, which arises when models are trained on unrepresentative data, leading to suboptimal results when used on diverse patient populations or different mammography machines.
- According to a recent report, the global AI in medical imaging market is projected to expand by over 40% in the next five years, underscoring the growing demand for advanced imaging technologies. For instance, an algorithm primarily based on images from a specific ethnic group or mammography equipment manufacturer may underperform when applied to other demographics or devices. Emerging targeted therapies, such as monoclonal antibodies, further contribute to the high costs.
Exclusive Customer Landscape
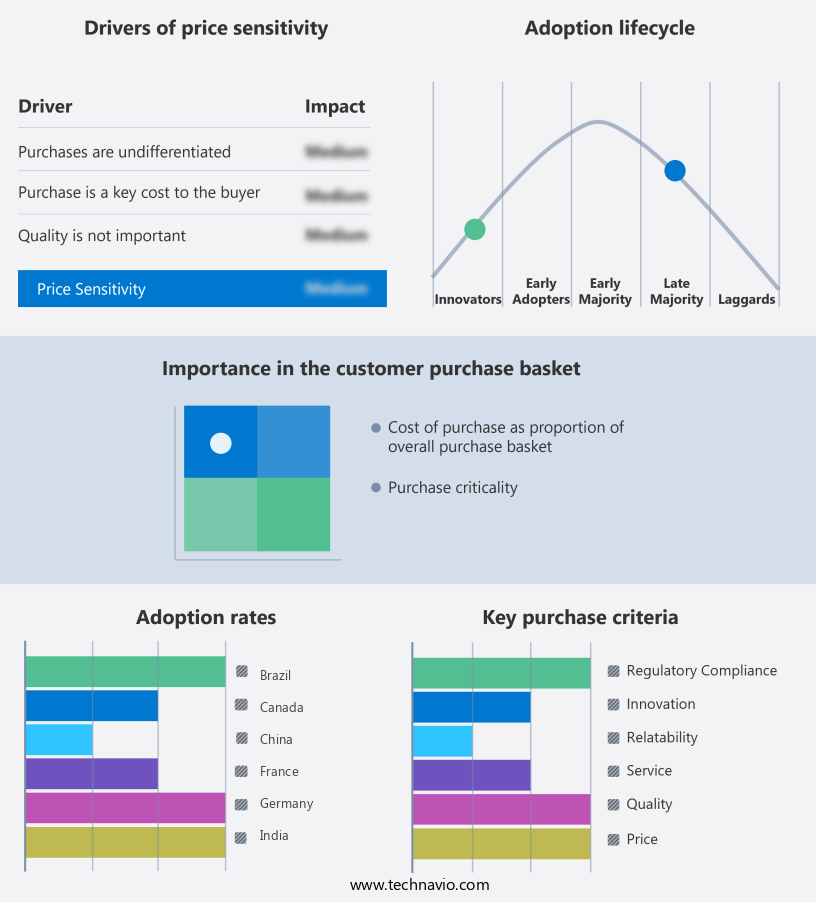
The AI in breast imaging market forecasting report includes the adoption lifecycle of the market, covering from the innovator’s stage to the laggard’s stage. It focuses on adoption rates in different regions based on penetration. Furthermore, the AI in breast imaging market report also includes key purchase criteria and drivers of price sensitivity to help companies evaluate and develop their market growth analysis strategies.
Customer Landscape
Key Companies & Market Insights
Companies are implementing various strategies, such as strategic alliances, AI in breast imaging market forecast, partnerships, mergers and acquisitions, geographical expansion, and product/service launches, to enhance their presence in the industry.
AURORA HEALTHCARE US Corp. - The company specializes in AI-driven breast imaging and offers the Aurora 1.5T Dedicated Breast MRI System, featuring AuroraSPECTROSCOPY and advanced AI technology to enhance cancer detection and tissue characterization.
The industry research and growth report includes detailed analyses of the competitive landscape of the market and information about key companies, including:
- AURORA HEALTHCARE US Corp.
- brayZ AG
- Canon Medical Systems Corp.
- CureMetrix Inc.
- Densitas Inc.
- FUJIFILM Holdings Corp.
- GE Healthcare Technologies Inc.
- Hologic Inc.
- Koios Medical Inc.
- Koninklijke Philips NV
- Lunit Inc.
- Planmed Oy
- QView Medical Inc.
- RadNet Inc.
- ScreenPoint Medical B.V.
- Siemens Healthineers AG
- Therapixel
- Visage Imaging
- Whiterabbit.ai Inc.
Qualitative and quantitative analysis of companies has been conducted to help clients understand the wider business environment as well as the strengths and weaknesses of key industry players. Data is qualitatively analyzed to categorize companies as pure play, category-focused, industry-focused, and diversified; it is quantitatively analyzed to categorize companies as dominant, leading, strong, tentative, and weak.
Recent Development and News in AI In Breast Imaging Market
- In January 2024, GE Healthcare announced the FDA clearance of its Edison PrecisionPacs AI-powered mammography solution, integrating advanced algorithms to analyze breast imaging data (GE Healthcare press release).
- In March 2024, IBM Watson Health and Merge Healthcare entered into a strategic partnership to offer AI-assisted breast density assessments, combining IBM Watson's AI capabilities with Merge Healthcare's imaging solutions (IBM Watson Health press release).
- In April 2024, Siemens Healthineers raised € 1.1 billion in funding to expand its digital health portfolio, including AI-driven breast imaging solutions (Siemens Healthineers press release).
- In May 2025, the European Commission approved the use of Zebra Medical Vision's AI-powered mammography solution, Mia, for breast density assessment and cancer detection, marking a significant regulatory milestone for the company (European Commission press release).
Research Analyst Overview
- The market for AI in breast imaging continues to evolve, with applications expanding across various sectors, including radiology, pathology, and ultrasound. One notable development is the integration of AI in tomosynthesis analysis, resulting in a 5% increase in positive predictive value compared to traditional methods. Regulatory approval pathways remain a critical consideration, with cost-effectiveness analysis and pathology correlation playing essential roles in securing approvals. ROC curve analysis and AUC calculation are key performance benchmarking tools, while data security measures ensure ethical considerations are met. Sensitivity and specificity, precision and recall, and F1 score are crucial metrics for algorithm explainability and interoperability standards.
- Biopsy guidance and radiologist workflow optimization are also significant areas of focus, with clinical trials underway to assess the impact on negative predictive value. AI's integration with MRI is expected to further enhance breast imaging, with industry growth forecasted at 20% annually. Software validation, image quality assessment, and bias mitigation strategies are ongoing priorities to maintain the highest standards of accuracy and reliability.
Dive into Technavio’s robust research methodology, blending expert interviews, extensive data synthesis, and validated models for unparalleled AI In Breast Imaging Market insights. See full methodology.
|
Market Scope |
|
|
Report Coverage |
Details |
|
Page number |
243 |
|
Base year |
2024 |
|
Historic period |
2019-2023 |
|
Forecast period |
2025-2029 |
|
Growth momentum & CAGR |
Accelerate at a CAGR of 24.9% |
|
Market growth 2025-2029 |
USD 897 million |
|
Market structure |
Fragmented |
|
YoY growth 2024-2025(%) |
23.4 |
|
Key countries |
US, China, Japan, Germany, Canada, India, UK, France, Brazil, and South Korea |
|
Competitive landscape |
Leading Companies, Market Positioning of Companies, Competitive Strategies, and Industry Risks |
What are the Key Data Covered in this AI In Breast Imaging Market Research and Growth Report?
- CAGR of the AI In Breast Imaging industry during the forecast period
- Detailed information on factors that will drive the growth and forecasting between 2025 and 2029
- Precise estimation of the size of the market and its contribution of the industry in focus to the parent market
- Accurate predictions about upcoming growth and trends and changes in consumer behaviour
- Growth of the market across North America, APAC, Europe, South America, and Middle East and Africa
- Thorough analysis of the market’s competitive landscape and detailed information about companies
- Comprehensive analysis of factors that will challenge the AI in breast imaging market growth of industry companies
We can help! Our analysts can customize this AI in breast imaging market research report to meet your requirements.
 RIA -
RIA - 
