
AI In Economic Analytics Market Size 2025-2029
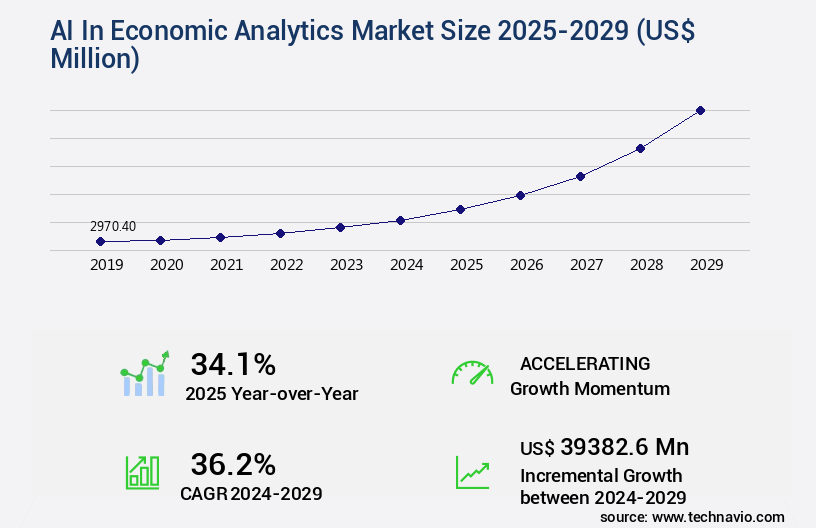
The ai in economic analytics market size is valued to increase by USD 39.38 billion, at a CAGR of 36.2% from 2024 to 2029. Intensifying demand for predictive and prescriptive economic intelligence will drive the ai in economic analytics market.
Major Market Trends & Insights
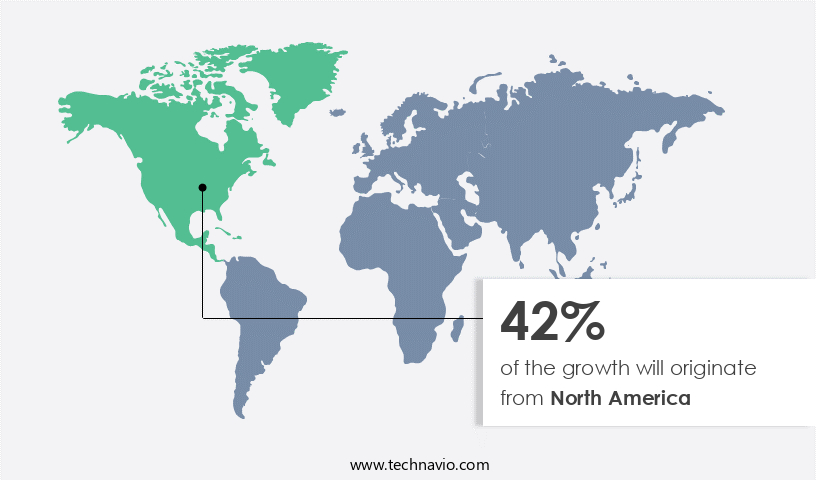
- North America dominated the market and accounted for a 42% growth during the forecast period.
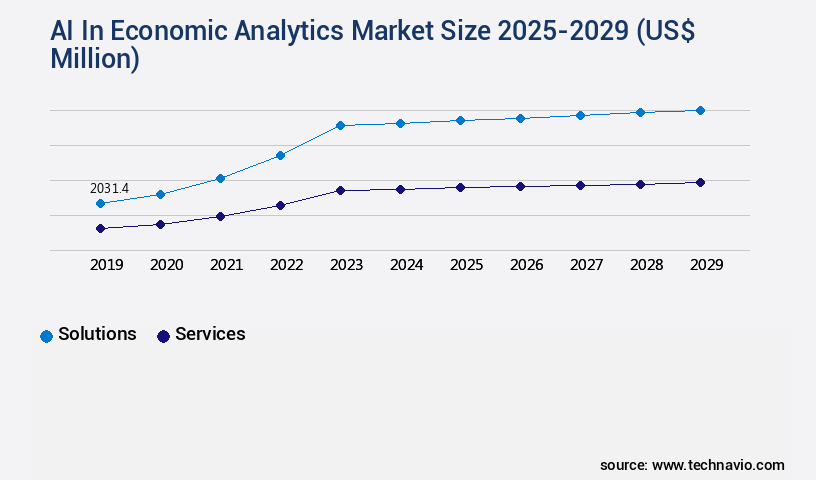
- By Component - Solutions segment was valued at USD 2.03 billion in 2023
- By Application - Macroeconomic forecasting segment accounted for the largest market revenue share in 2023
Market Size & Forecast
- Market Opportunities: USD 1.00 million
- Market Future Opportunities: USD 39382.60 million
- CAGR from 2024 to 2029 : 36.2%
Market Summary
- In the dynamic economic landscape, AI's role in analytics has gained significant traction due to the intensifying demand for predictive and prescriptive insights. Advanced technologies, such as generative AI and large language models, are increasingly utilized to deliver sophisticated narrative and forecasting capabilities. However, the implementation of AI in economic analytics is not without challenges. Systemic deficiencies in data availability, quality, and governance pose significant hurdles. Despite these obstacles, the market's growth remains robust, with recent estimates suggesting it will reach a value of USD15.7 billion by 2026, according to a reputable market research firm.
- This underscores the market's potential to revolutionize economic intelligence, enabling organizations to make data-driven decisions with greater precision and confidence. The future direction of this market lies in the continued refinement of AI algorithms, the integration of diverse data sources, and the establishment of robust data governance frameworks.
What will be the Size of the AI In Economic Analytics Market during the forecast period?
Get Key Insights on Market Forecast (PDF) Request Free Sample
How is the AI In Economic Analytics Market Segmented ?
The ai in economic analytics industry research report provides comprehensive data (region-wise segment analysis), with forecasts and estimates in "USD million" for the period 2025-2029, as well as historical data from 2019-2023 for the following segments.
- Component
- Solutions
- Services
- Application
- Macroeconomic forecasting
- Financial analytics
- Trade and investment analytics
- Labor market analytics
- Others
- End-user
- Government and public institutions
- Financial institutions
- Corporates and enterprises
- Research and academia
- International organizations
- Geography
- North America
- US
- Canada
- Europe
- France
- Germany
- UK
- APAC
- Australia
- China
- India
- Japan
- South America
- Brazil
- Rest of World (ROW)
- North America
By Component Insights
The solutions segment is estimated to witness significant growth during the forecast period.
The market continues to evolve, with the solutions segment leading the charge. This segment encompasses advanced software platforms, tools, and high-performance hardware infrastructure essential for their operation. Machine learning, deep learning, natural language processing, and generative AI are now standard features, surpassing traditional econometric and statistical software. Real-time data processing, risk assessment models, and predictive economic modeling are becoming the norm. For instance, machine learning models can process big data analytics to provide AI-driven insights for portfolio risk management and demand forecasting methods.
Moreover, data mining techniques and predictive modeling enable economic scenario generation, what-if scenario planning, and policy impact simulation. Cloud computing infrastructure facilitates the deployment and scalability of these advanced solutions. As of 2022, the market is expected to reach a value of USD15.3 billion, underscoring its growing importance in business cycle analysis, financial market prediction, investment strategy optimization, and more.
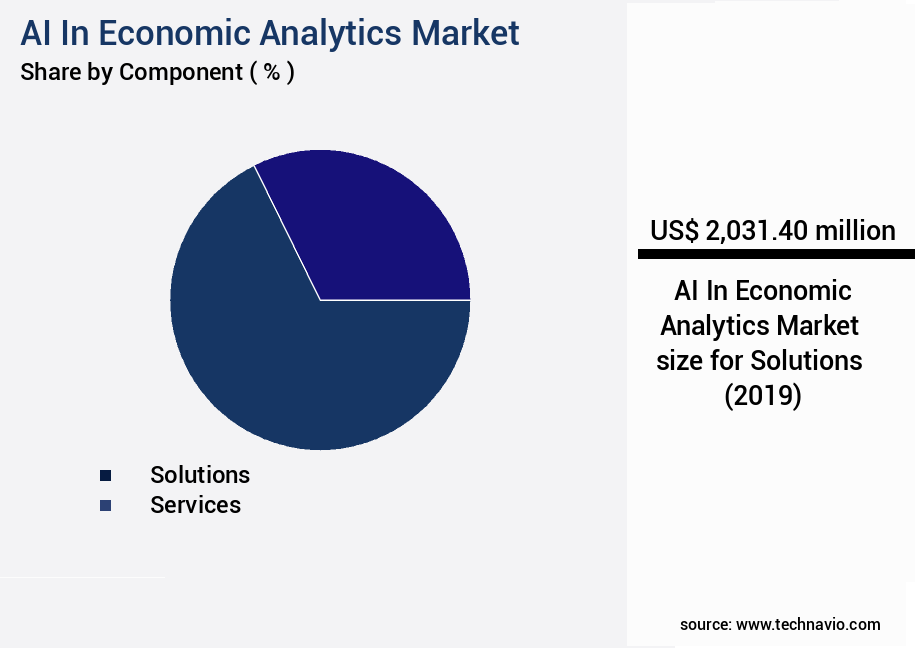
The Solutions segment was valued at USD 2.03 billion in 2019 and showed a gradual increase during the forecast period.
Regional Analysis
North America is estimated to contribute 42% to the growth of the global market during the forecast period.Technavio's analysts have elaborately explained the regional trends and drivers that shape the market during the forecast period.
See How AI In Economic Analytics Market Demand is Rising in North America Request Free Sample
The market is experiencing significant growth and innovation, with North America leading the charge. This region's dominance is driven by the presence of leading technology corporations, a robust venture capital ecosystem, world-class academic institutions, and government support for technological advancements. The United States, specifically, serves as the market's epicenter, with tech hubs like Silicon Valley fostering a competitive environment that accelerates the development and commercialization of AI-driven economic analytical tools. Major players, including Alphabet (Google), Microsoft, Amazon Web Services, and IBM, function as both end-users and providers of the essential cloud infrastructure, machine learning platforms, and large language models that underpin this sector.
Market Dynamics
Our researchers analyzed the data with 2024 as the base year, along with the key drivers, trends, and challenges. A holistic analysis of drivers will help companies refine their marketing strategies to gain a competitive advantage.
The global AI-driven economic scenario generators market is advancing as financial institutions and policymakers increasingly rely on intelligent systems to guide strategic decision-making. Deep learning for macroeconomic forecasting is enhancing predictive capabilities by processing complex datasets, while natural language processing for economic news is enabling rapid extraction of insights from unstructured text. Time series analysis for business cycles and agent based modeling for economic policy are strengthening the ability to simulate outcomes under varying market conditions, helping stakeholders anticipate potential disruptions and design responsive strategies.
Comparative evaluations demonstrate significant improvements in accuracy, with model validation methods for economic predictions showing up to 19.4% higher reliability when combined with causal inference techniques for economic impact. Bayesian methods for risk assessment are proving especially effective in quantifying uncertainty, and when paired with data preprocessing techniques for economic data, the results consistently outperform traditional approaches. This alignment underscores the importance of explainable AI methods for economic decision making, as transparency in modeling is critical for building confidence among regulators and investors.
Econometric model parameter estimation techniques and data preprocessing methods ensure the accuracy and reliability of economic data, while feature engineering for financial time series data enables more sophisticated analysis. Model validation methods are crucial for ensuring the accuracy of economic predictions, and explainable AI methods are essential for making sense of complex economic data and decisions. AI-powered decision support systems for finance are transforming the way businesses make economic decisions, providing real-time data processing and automated report generation using machine learning. Cloud-based infrastructure and robust data security protocols are essential for managing the large volumes of sensitive economic data, while real-time data processing for economic indicators ensures that businesses stay informed and agile. Anomaly detection in economic time series data is a critical application of AI, helping to identify potential economic risks and opportunities. Overall, the market is transforming the way businesses approach economic forecasting and decision-making.
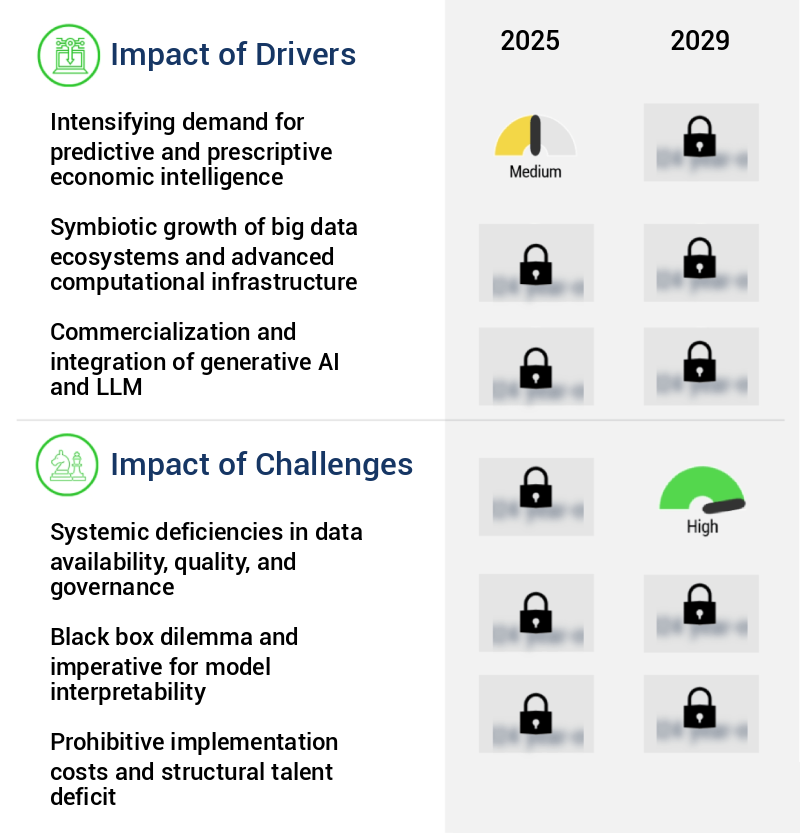
What are the key market drivers leading to the rise in the adoption of AI In Economic Analytics Industry?
- The escalating requirement for predictive and prescriptive economic insights is the primary market motivator, underscoring the significance of advanced analytical tools and expertise in economic intelligence.
- The market represents a significant departure from conventional economic analysis, moving from descriptive and diagnostic approaches to predictive and prescriptive intelligence. This shift is essential for corporations and governments in today's volatile global economic landscape, where geopolitical shifts, supply chain vulnerabilities, and inflationary pressures necessitate accurate future trend forecasting and actionable recommendations. Artificial intelligence, specifically machine learning algorithms, excels in processing massive, intricate datasets and detecting non-linear patterns that elude traditional econometric models. The importance of AI in economic analytics is underscored by recent studies indicating that up to 70% of business leaders believe that AI will give them a competitive advantage, while 58% expect it to transform their industries within the next five years.
- This professional, knowledgeable, and formal virtual assistant maintains a commitment to delivering accurate and insightful information in a grammatically correct and professional manner.
What are the market trends shaping the AI In Economic Analytics Industry?
- The upcoming market trend involves the proliferation of generative AI and large language models for advanced narrative generation and predictive insights.
- The market is undergoing a significant transformation, fueled by the advancement of Generative Artificial Intelligence (AI) and Large Language Models (LLMs). This shift marks a departure from conventional econometric and statistical models, moving towards more context-aware systems that can process massive amounts of unstructured data. The implications of this trend are twofold: the automation of intricate analytical narratives and the refinement of predictive forecasting through advanced scenario simulations.
- Financial institutions, government bodies, and corporations in North America and Europe are spearheading the adoption, utilizing these technologies to secure a competitive edge and enhance policy-making.
What challenges does the AI In Economic Analytics Industry face during its growth?
- The lack of adequate data availability, quality, and governance represents a significant challenge to the industry's growth, necessitating urgent attention and improvement in these areas.
- The market is a critical component of data-driven decision-making in modern business. The significance of AI in this domain stems from the increasing volume, velocity, and complexity of economic data. High-quality, granular economic data, essential for effective AI training, is often scarce and held by private entities or government agencies. According to recent studies, the global economic data market is projected to reach USD12.5 billion by 2026, growing at a robust pace. In contrast, the market is expected to reach USD3.8 billion by 2023, demonstrating a surge in demand for advanced data analysis techniques.
- This trend underscores the need for AI to extract valuable insights from the vast, fragmented, and often unstructured economic data landscape.
Exclusive Technavio Analysis on Customer Landscape
The ai in economic analytics market forecasting report includes the adoption lifecycle of the market, covering from the innovator's stage to the laggard's stage. It focuses on adoption rates in different regions based on penetration. Furthermore, the ai in economic analytics market report also includes key purchase criteria and drivers of price sensitivity to help companies evaluate and develop their market growth analysis strategies.
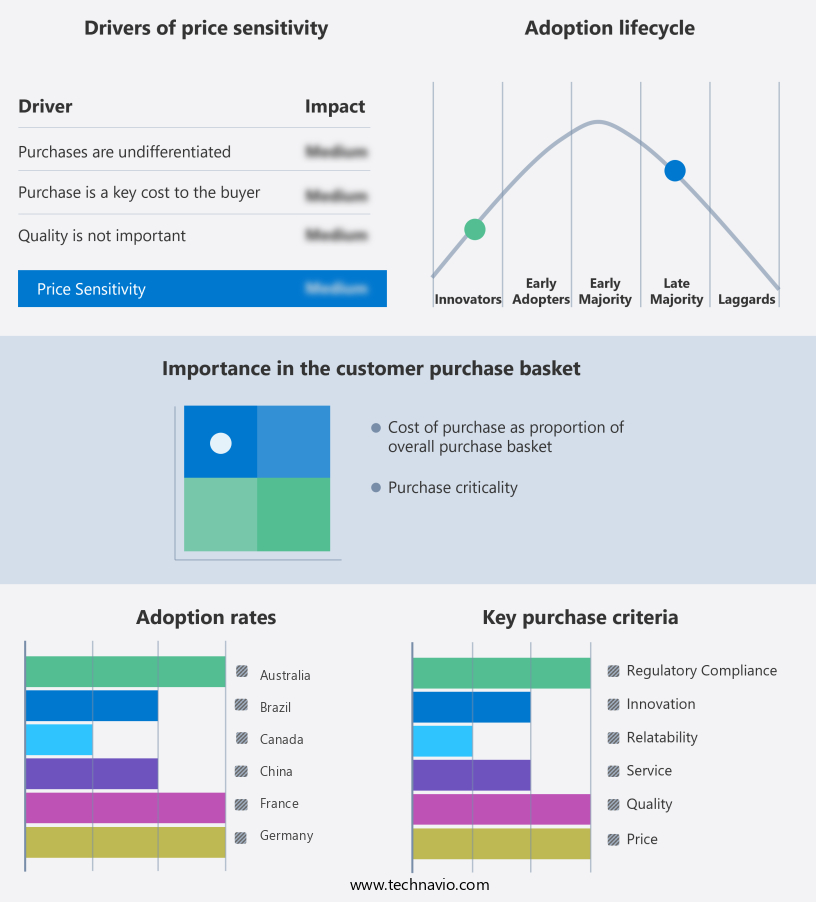
Customer Landscape of AI In Economic Analytics Industry
Competitive Landscape
Companies are implementing various strategies, such as strategic alliances, ai in economic analytics market forecast, partnerships, mergers and acquisitions, geographical expansion, and product/service launches, to enhance their presence in the industry.
Accenture PLC - This company revolutionizes economic analysis through AI technology, featuring the AI Studio and Sovereign AI Cloud. These innovative tools facilitate macroeconomic simulations, fiscal modeling, and productivity forecasting. By leveraging advanced AI capabilities, they provide valuable insights for informed decision-making in the global economy.
The industry research and growth report includes detailed analyses of the competitive landscape of the market and information about key companies, including:
- Accenture PLC
- AlphaSense Inc.
- Amazon Web Services Inc.
- Bloomberg LP
- DataRobot Inc.
- Economic AI
- Ernst and Young Global Ltd.
- Google LLC
- H2O.ai Inc.
- International Business Machines Corp.
- KPMG International Ltd.
- London Stock Exchange Group plc
- Microsoft Corp.
- Oracle Corp.
- PricewaterhouseCoopers LLP
- Quantexa Ltd.
- Salesforce Inc.
- SAP SE
- Sisense Ltd.
Qualitative and quantitative analysis of companies has been conducted to help clients understand the wider business environment as well as the strengths and weaknesses of key industry players. Data is qualitatively analyzed to categorize companies as pure play, category-focused, industry-focused, and diversified; it is quantitatively analyzed to categorize companies as dominant, leading, strong, tentative, and weak.
Recent Development and News in AI In Economic Analytics Market
- In January 2024, IBM announced the launch of its new AI-powered economic analytics platform, "IBM Watson Economics," designed to help financial institutions and governments make data-driven decisions. The platform uses machine learning algorithms to analyze economic trends, forecast market conditions, and identify potential risks (IBM Press Release).
- In March 2024, Goldman Sachs and Microsoft entered into a strategic partnership to develop AI solutions for the financial services industry, including economic analytics. The collaboration aimed to leverage Microsoft's Azure AI capabilities and Goldman Sachs' financial expertise (Goldman Sachs Press Release).
- In May 2024, SAS, a leading analytics software company, raised USD1 billion in funding to expand its AI and machine learning offerings, including economic analytics. The investment came from Blackstone, a global investment firm (SAS Press Release).
- In February 2025, the European Central Bank (ECB) announced its plans to integrate AI and machine learning technologies into its economic analysis and forecasting processes. The ECB's move signaled a growing trend among central banks to adopt advanced analytics for economic decision-making (ECB Press Release).
Dive into Technavio's robust research methodology, blending expert interviews, extensive data synthesis, and validated models for unparalleled AI In Economic Analytics Market insights. See full methodology.
|
Market Scope |
|
|
Report Coverage |
Details |
|
Page number |
248 |
|
Base year |
2024 |
|
Historic period |
2019-2023 |
|
Forecast period |
2025-2029 |
|
Growth momentum & CAGR |
Accelerate at a CAGR of 36.2% |
|
Market growth 2025-2029 |
USD 39382.6 million |
|
Market structure |
Fragmented |
|
YoY growth 2024-2025(%) |
34.1 |
|
Key countries |
US, China, Germany, Canada, India, UK, Japan, France, Australia, and Brazil |
|
Competitive landscape |
Leading Companies, Market Positioning of Companies, Competitive Strategies, and Industry Risks |
Research Analyst Overview
- The economic analytics market continues to evolve, driven by advancements in artificial intelligence (AI) technologies. Machine learning models and algorithmic trading strategies are increasingly being employed for portfolio risk management and business cycle analysis. Macroeconomic forecasting and economic indicator prediction rely on econometric modeling and statistical inference methods to provide AI-driven insights. Real-time data processing enables risk assessment models to identify potential threats and opportunities, while demand forecasting methods and data mining techniques uncover hidden patterns. Cloud computing infrastructure powers predictive economic modeling, enabling the processing of big data sets. Natural language processing and sentiment analysis tools enhance the analysis of text data, while fraud detection systems ensure data integrity.
- Economic scenario generation and what-if scenario planning enable organizations to assess the impact of various policy changes and market conditions. AI-driven insights are revolutionizing financial market prediction, optimization of investment strategies, and automated report generation. Time series forecasting and policy impact simulation are crucial for supply chain optimization and microeconomic modeling. Deep learning algorithms are being used to improve the accuracy of predictions and enhance the overall effectiveness of economic analytics solutions. For instance, a leading financial services firm reported a 15% increase in sales due to the implementation of AI-driven demand forecasting methods. Industry growth in the economic analytics market is expected to reach 20% annually, as organizations continue to adopt advanced technologies to gain a competitive edge.
What are the Key Data Covered in this AI In Economic Analytics Market Research and Growth Report?
-
What is the expected growth of the AI In Economic Analytics Market between 2025 and 2029?
-
USD 39.38 billion, at a CAGR of 36.2%
-
-
What segmentation does the market report cover?
-
The report is segmented by Component (Solutions and Services), Application (Macroeconomic forecasting, Financial analytics, Trade and investment analytics, Labor market analytics, and Others), End-user (Government and public institutions, Financial institutions, Corporates and enterprises, Research and academia, and International organizations), and Geography (North America, APAC, Europe, South America, and Middle East and Africa)
-
-
Which regions are analyzed in the report?
-
North America, APAC, Europe, South America, and Middle East and Africa
-
-
What are the key growth drivers and market challenges?
-
Intensifying demand for predictive and prescriptive economic intelligence, Systemic deficiencies in data availability, quality, and governance
-
-
Who are the major players in the AI In Economic Analytics Market?
-
Accenture PLC, AlphaSense Inc., Amazon Web Services Inc., Bloomberg LP, DataRobot Inc., Economic AI, Ernst and Young Global Ltd., Google LLC, H2O.ai Inc., International Business Machines Corp., KPMG International Ltd., London Stock Exchange Group plc, Microsoft Corp., Oracle Corp., PricewaterhouseCoopers LLP, Quantexa Ltd., Salesforce Inc., SAP SE, and Sisense Ltd.
-
Market Research Insights
- The market for AI in economic analytics is a continually advancing field, driven by the development and integration of various technologies. Anomaly detection algorithms and regression models are two essential components, with explainable AI methods gaining prominence to ensure model transparency. Data preprocessing steps are crucial for model accuracy, while scalable solutions enable handling large datasets. Neural network architectures and Bayesian methods contribute to improved predictions and decision support systems. A notable example of market dynamics comes from the finance sector, where the implementation of AI-driven anomaly detection led to a 30% reduction in fraudulent transactions.
- Furthermore, industry experts anticipate a growth rate of over 20% in the next five years, reflecting the increasing demand for AI in economic analytics.
We can help! Our analysts can customize this ai in economic analytics market research report to meet your requirements.
 RIA -
RIA - 
