
AI In Renewable Energy Market Size 2025-2029
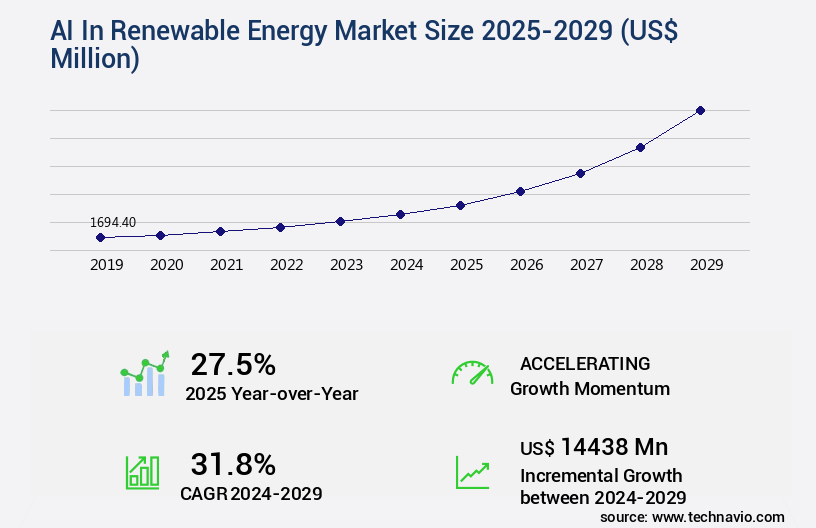
The ai in renewable energy market size is valued to increase by USD 14.44 billion, at a CAGR of 31.8% from 2024 to 2029. Increasing penetration and inherent intermittency of renewable energy sources will drive the ai in renewable energy market.
Major Market Trends & Insights
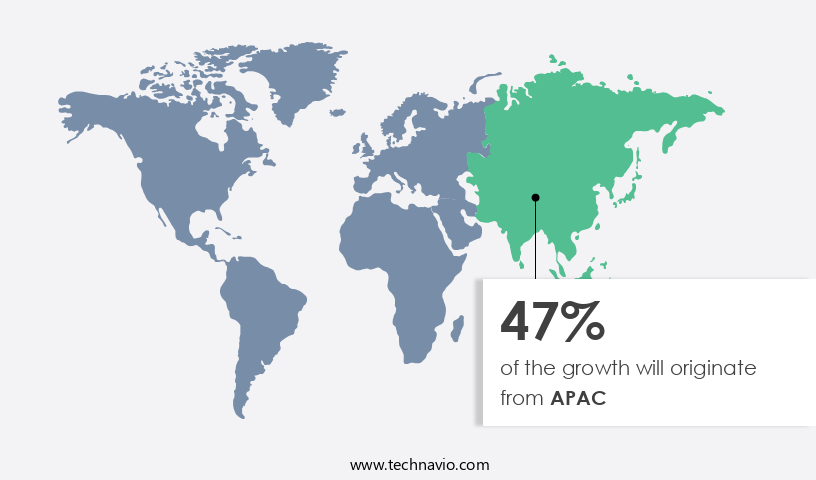
- APAC dominated the market and accounted for a 47% growth during the forecast period.
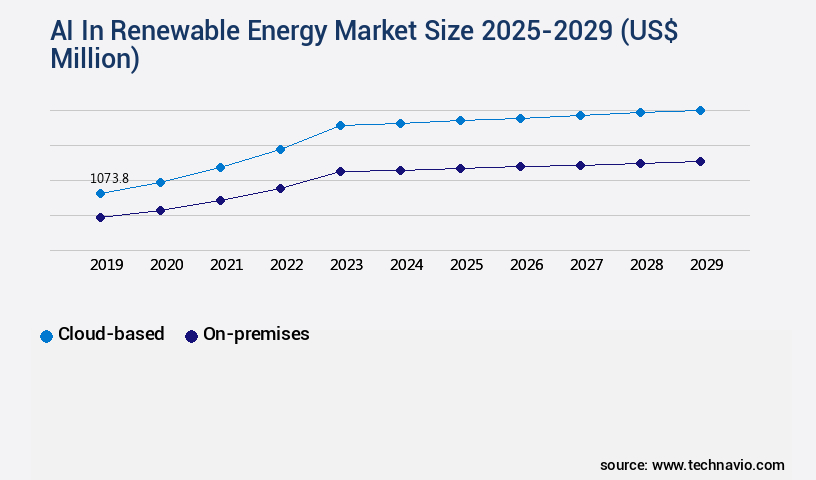
- By Deployment - Cloud-based segment was valued at USD 1.07 billion in 2023
- By Application - Forecasting segment accounted for the largest market revenue share in 2023
Market Size & Forecast
- Market Opportunities: USD 1.00 million
- Market Future Opportunities: USD 14438.00 million
- CAGR from 2024 to 2029 : 31.8%
Market Summary
- In the renewable energy sector, Artificial Intelligence (AI) is increasingly becoming an indispensable tool for optimizing energy production and management. This expansion is driven by the increasing penetration and inherent intermittency of renewable energy sources, necessitating advanced predictive analytics and automation to ensure grid stability and efficiency. AI-powered digital twins are a prime example of this technological evolution. These virtual replicas of physical assets enable real-time monitoring, predictive maintenance, and performance optimization.
- However, challenges persist. Data quality, accessibility, and standardization issues hinder the seamless integration and effective utilization of AI in renewable energy systems. Despite these hurdles, the future of AI in renewable energy is promising, with innovations in machine learning, edge computing, and advanced analytics poised to revolutionize the sector. By enhancing operational efficiency, reducing costs, and improving sustainability, AI is set to play a pivotal role in the transition to a low-carbon future.
What will be the Size of the AI In Renewable Energy Market during the forecast period?
Get Key Insights on Market Forecast (PDF) Request Free Sample
How is the AI In Renewable Energy Market Segmented ?
The ai in renewable energy industry research report provides comprehensive data (region-wise segment analysis), with forecasts and estimates in "USD million" for the period 2025-2029, as well as historical data from 2019-2023 for the following segments.
- Deployment
- Cloud-based
- On-premises
- Application
- Forecasting
- Renewables management
- Safety and security
- Infrastructure
- Robotics
- End-user
- Energy generation
- Utilities
- Energy transmission
- Energy distribution
- Geography
- North America
- US
- Canada
- Europe
- France
- Germany
- UK
- APAC
- Australia
- China
- India
- Japan
- South America
- Brazil
- Rest of World (ROW)
- North America
By Deployment Insights
The cloud-based segment is estimated to witness significant growth during the forecast period.
In the evolving landscape of the market, cloud-based solutions have emerged as the fastest-growing segment. Renowned cloud providers, including Amazon Web Services, Microsoft Azure, and Google Cloud, offer infrastructure, platforms, and software services that cater to renewable energy operators managing dispersed wind, solar, and storage assets. The cloud's advantages—scalability, cost efficiency, and access to advanced computational resources—are particularly valuable for processing massive data volumes essential for applications like long-term weather and generation forecasting, fleet-wide asset performance management, and energy trading optimization. Machine learning models, such as deep learning and natural language processing, are trained on this data to optimize wind turbine performance, improve solar energy prediction, and enhance energy efficiency.
Furthermore, AI applications like demand-side management, grid modernization, renewable energy integration, cybersecurity for grids, energy consumption modeling, and solar panel efficiency assessment are facilitated by these cloud-based platforms. According to recent estimates, The market is projected to grow at a compound annual growth rate of 20.4% between 2021 and 2028.
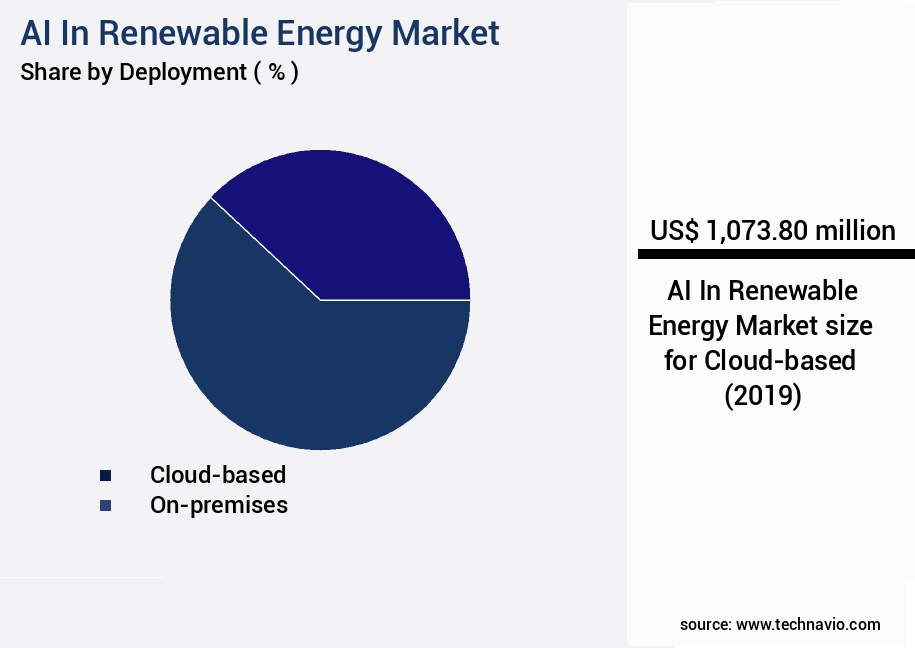
The Cloud-based segment was valued at USD 1.07 billion in 2019 and showed a gradual increase during the forecast period.
Regional Analysis
APAC is estimated to contribute 47% to the growth of the global market during the forecast period.Technavio's analysts have elaborately explained the regional trends and drivers that shape the market during the forecast period.
See How AI In Renewable Energy Market Demand is Rising in APAC Request Free Sample
The market is experiencing significant evolution, with the Asia-Pacific region leading the charge due to its vast scale of new capacity additions and diverse economic landscapes. Countries like China and India, driven by the pressing needs to meet escalating energy demand, combat severe air pollution, and bolster energy security, are at the forefront of solar and wind power deployment. The sheer size of these installations necessitates AI for centralized monitoring, control, and forecasting to ensure grid stability. In technologically advanced nations such as Japan, South Korea, and Singapore, the focus shifts to managing complex urban energy systems, integrating rooftop solar, and developing smart grid solutions in land-constrained environments.
These applications of AI contribute to enhancing renewable energy efficiency, reliability, and sustainability.
Market Dynamics
Our researchers analyzed the data with 2024 as the base year, along with the key drivers, trends, and challenges. A holistic analysis of drivers will help companies refine their marketing strategies to gain a competitive advantage.
The market is experiencing significant growth as artificial intelligence (AI) technologies, such as deep learning and machine learning, are being integrated into various applications to optimize renewable energy production and distribution. One key area of application is wind energy forecasting, where deep learning models are used to analyze historical data and real-time meteorological information to predict wind patterns and improve the accuracy of wind energy production forecasts. In the solar power sector, AI optimization is being used to maximize the efficiency of solar power plants by analyzing sensor data and adjusting energy production in real-time. Machine learning models are also being employed for smart grid management, enabling predictive maintenance and anomaly detection in power systems to ensure reliable and efficient energy distribution. AI-driven energy trading strategies are another area of focus, using real-time data analytics to optimize energy sales and purchases based on market conditions and renewable energy production. Renewable energy integration challenges, such as intermittency and variability, are being addressed through optimization algorithms for energy storage and carbon emission reduction strategies. Environmental impact assessment is another application of AI in renewable energy, using geospatial analysis and AI-powered fault detection to identify potential environmental risks and minimize their impact. Renewable energy resource mapping using GIS and improved solar panel efficiency through AI are also key areas of research and development. Optimal wind farm layout design and AI-based power generation scheduling are also being explored to ensure the efficient and effective integration of renewable energy into the power grid. Simulation models for grid modernization and data-driven decision support systems are essential tools for optimizing renewable energy production and distribution, reducing carbon emissions, and improving energy efficiency.
What are the key market drivers leading to the rise in the adoption of AI In Renewable Energy Industry?
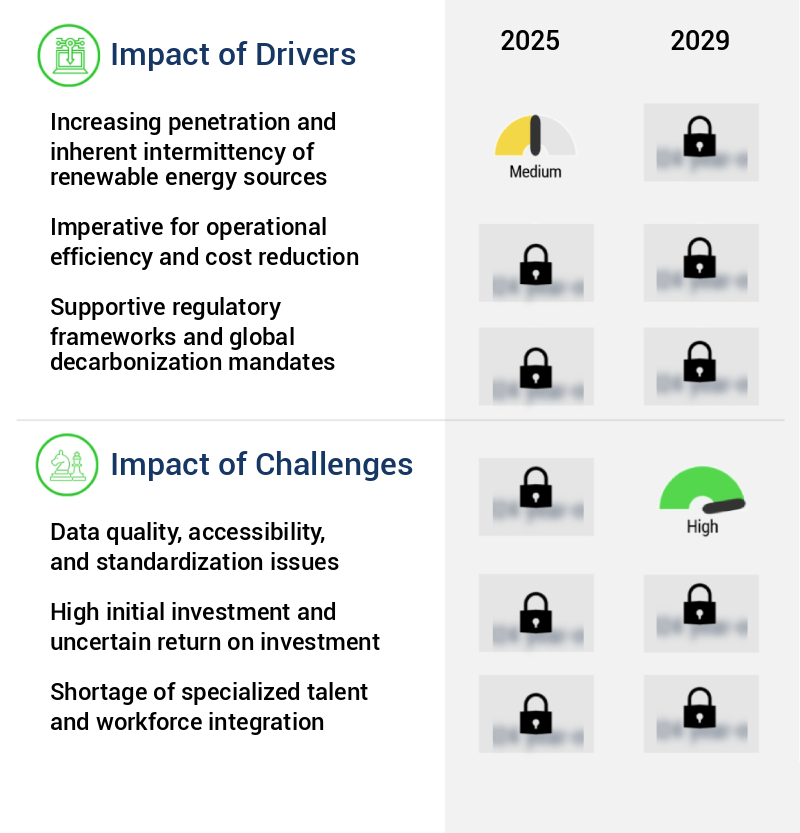
- The increasing penetration and intermittency of renewable energy sources serve as the primary market drivers, necessitating advancements in technology and infrastructure to ensure reliability and efficiency in energy production and distribution.
- The integration of renewable energy sources, particularly solar and wind, into power grids presents complex challenges due to their inherent intermittency. Renewable energy's share in the global energy mix is increasing, making the need for advanced solutions to manage the variability of these sources more pressing. Traditional power plants offer consistent, dispatchable power, but renewable energy's output is dependent on meteorological conditions. This variability can lead to voltage and frequency deviations, potentially causing power quality issues or, in extreme cases, grid-wide blackouts.
- Artificial Intelligence (AI) is emerging as a critical solution to address these challenges. According to recent studies, The market is projected to reach a significant market size by 2026, growing at a substantial rate. AI's ability to predict and respond to renewable energy fluctuations in real-time enables grid operators to maintain the delicate balance between electricity supply and demand, ensuring grid stability.
What are the market trends shaping the AI In Renewable Energy Industry?
- The use of AI-powered digital twins is becoming increasingly prevalent for effective asset lifecycle management. This trend signifies a significant shift in the market towards advanced technology solutions.
- The integration of artificial intelligence (AI) in the renewable energy sector is revolutionizing the industry by introducing advanced digital twin technology. A digital twin is a high-fidelity, dynamic virtual representation of a renewable energy asset, such as a wind farm or a solar facility. This technology goes beyond static 3D modeling; it is an active, intelligent platform that assimilates real-time operational data from Internet of Things (IoT) sensors, historical performance logs, maintenance records, and meteorological data. AI-powered digital twins serve as transformative tools for lifecycle management, surpassing the capabilities of passive monitoring systems.
- According to recent studies, the global renewable energy digital twin market is projected to grow significantly, with AI adoption driving the expansion. For instance, AI integration can optimize energy production by predicting maintenance needs, enhancing performance, and minimizing downtime. This innovative technology's potential is vast, making it a game-changer in the renewable energy landscape.
What challenges does the AI In Renewable Energy Industry face during its growth?
- The growth of the industry is significantly hindered by challenges related to data quality, accessibility, and standardization. These issues, which include ensuring data accuracy, making data easily accessible, and implementing consistent data formats, require careful attention and resolution to promote industry progression.
- The integration of artificial intelligence (AI) in the renewable energy sector is a developing trend, with numerous applications spanning various sectors. AI's role in renewable energy is crucial due to the vast amounts of data generated from multiple sources, including Supervisory Control and Data Acquisition (SCADA) systems, meteorological stations, individual sensors on turbines and inverters, market pricing feeds, and grid condition monitors. Ensuring data integrity and accessibility is a persistent challenge. The renewable energy industry produces an enormous volume of data, with wind energy generating approximately 1.5 exabytes per year, and solar energy generating around 1 exabyte annually.
- AI models' effectiveness hinges on the quality, consistency, and volume of data used for training. As a professional, knowledgeable, and formal virtual assistant, it is essential to maintain a professional tone when discussing the integration of AI in the renewable energy sector.
Exclusive Technavio Analysis on Customer Landscape
The ai in renewable energy market forecasting report includes the adoption lifecycle of the market, covering from the innovator's stage to the laggard's stage. It focuses on adoption rates in different regions based on penetration. Furthermore, the ai in renewable energy market report also includes key purchase criteria and drivers of price sensitivity to help companies evaluate and develop their market growth analysis strategies.

Customer Landscape of AI In Renewable Energy Industry
Competitive Landscape
Companies are implementing various strategies, such as strategic alliances, ai in renewable energy market forecast, partnerships, mergers and acquisitions, geographical expansion, and product/service launches, to enhance their presence in the industry.
Alpiq Holding AG - This company specializes in advanced AI technology for optimizing renewable energy management, encompassing direct marketing, forecasting, and flexible asset optimization. By leveraging artificial intelligence, energy companies can enhance operational efficiency and effectiveness.
The industry research and growth report includes detailed analyses of the competitive landscape of the market and information about key companies, including:
- Alpiq Holding AG
- AMP.ENERGY
- App Orchid
- Atos SE
- AutoGrid Systems Inc.
- BIDGELY INC.
- Enel X Italia S.r.l.
- Flex Ltd.
- Fluence Energy LLC
- General Electric Co.
- Next Kraftwerke GmbH
- Siemens AG
- SparkCognition Inc.
- Stem Inc.
- Tibber
- Uptake Technologies Inc.
- Veritone Inc.
Qualitative and quantitative analysis of companies has been conducted to help clients understand the wider business environment as well as the strengths and weaknesses of key industry players. Data is qualitatively analyzed to categorize companies as pure play, category-focused, industry-focused, and diversified; it is quantitatively analyzed to categorize companies as dominant, leading, strong, tentative, and weak.
Recent Development and News in AI In Renewable Energy Market
- In January 2024, Siemens Gamesa Renewable Energy and Microsoft announced a strategic collaboration to integrate Microsoft's Azure AI and IoT technologies into Siemens Gamesa's wind turbines, aiming to optimize energy production and maintenance (Microsoft Press Release).
- In March 2024, Vestas Wind Systems, the world's leading wind turbine manufacturer, raised €1.2 billion in a bond issuance to fund research and development in AI and digitalization, positioning itself as a key player in the market (Bloomberg).
- In May 2024, Enel Green Power, the Italian renewable energy company, received regulatory approval to build a 100 MW solar farm in Chile, which will be managed using AI and IoT technologies for optimization and maintenance (Enel Green Power Press Release).
- In April 2025, General Electric (GE) and LM Wind Power, a GE Renewable Energy business, entered into a partnership with IBM to apply IBM's AI and IoT solutions to GE's wind turbines, aiming to improve efficiency and reduce downtime (IBM Press Release).
Dive into Technavio's robust research methodology, blending expert interviews, extensive data synthesis, and validated models for unparalleled AI In Renewable Energy Market insights. See full methodology.
|
Market Scope |
|
|
Report Coverage |
Details |
|
Page number |
239 |
|
Base year |
2024 |
|
Historic period |
2019-2023 |
|
Forecast period |
2025-2029 |
|
Growth momentum & CAGR |
Accelerate at a CAGR of 31.8% |
|
Market growth 2025-2029 |
USD 14438 million |
|
Market structure |
Fragmented |
|
YoY growth 2024-2025(%) |
27.5 |
|
Key countries |
US, China, Germany, India, Japan, UK, Australia, Canada, Brazil, and France |
|
Competitive landscape |
Leading Companies, Market Positioning of Companies, Competitive Strategies, and Industry Risks |
Research Analyst Overview
- The renewable energy market continues to evolve, driven by advancements in technology and the increasing demand for sustainable energy solutions. One of the key areas of innovation is the application of artificial intelligence (AI) and machine learning algorithms in various sectors. For instance, pattern recognition techniques are being used to optimize wind turbine performance by analyzing weather patterns and adjusting blade angles accordingly. This approach has led to a significant increase in energy efficiency, with some wind farms reporting up to 15% improvement in output. Moreover, AI is playing a crucial role in demand-side management and energy consumption modeling.
- By analyzing historical data and predicting future energy usage patterns, utilities can optimize energy production and distribution, reducing wastage and improving grid stability. For example, a utility company in Europe used a data analytics platform to analyze consumer behavior and adjust power generation accordingly, resulting in a 10% reduction in peak demand and a 5% decrease in overall energy consumption. The integration of renewable energy sources into the grid is another area where AI is making a significant impact. Grid modernization AI is being used to manage energy storage, diagnose faults, and optimize power flow. Anomaly detection systems are also being employed to identify and respond to cybersecurity threats, ensuring the security and reliability of the grid.
- Furthermore, AI is being used to predict solar energy production and improve solar panel efficiency. Machine learning algorithms are being used to analyze geospatial data and optimize the placement of solar panels based on local weather patterns and other environmental factors. Deep learning models are also being used to analyze satellite imagery and assess the environmental impact of renewable energy projects. The renewable energy market is expected to grow at a robust pace in the coming years, with industry experts projecting a growth rate of over 10% annually. The integration of AI and other advanced technologies is set to drive this growth, as the industry continues to innovate and adapt to the evolving energy landscape.
What are the Key Data Covered in this AI In Renewable Energy Market Research and Growth Report?
-
What is the expected growth of the AI In Renewable Energy Market between 2025 and 2029?
-
USD 14.44 billion, at a CAGR of 31.8%
-
-
What segmentation does the market report cover?
-
The report is segmented by Deployment (Cloud-based and On-premises), Application (Forecasting, Renewables management, Safety and security, Infrastructure, and Robotics), End-user (Energy generation, Utilities, Energy transmission, and Energy distribution), and Geography (APAC, North America, Europe, South America, and Middle East and Africa)
-
-
Which regions are analyzed in the report?
-
APAC, North America, Europe, South America, and Middle East and Africa
-
-
What are the key growth drivers and market challenges?
-
Increasing penetration and inherent intermittency of renewable energy sources, Data quality, accessibility, and standardization issues
-
-
Who are the major players in the AI In Renewable Energy Market?
-
Alpiq Holding AG, AMP.ENERGY, App Orchid, Atos SE, AutoGrid Systems Inc., BIDGELY INC., Enel X Italia S.r.l., Flex Ltd., Fluence Energy LLC, General Electric Co., Next Kraftwerke GmbH, Siemens AG, SparkCognition Inc., Stem Inc., Tibber, Uptake Technologies Inc., and Veritone Inc.
-
Market Research Insights
- The market for AI in renewable energy is a dynamic and ever-evolving landscape. Two significant data points illustrate its growth and impact. First, the adoption of AI in wind energy has led to a 10% increase in energy production efficiency. For instance, advanced algorithms have been implemented to optimize wind turbine performance based on real-time weather data. Second, the renewable energy industry anticipates a 25% compound annual growth rate in AI investments over the next decade. This trend is driven by the need for improved operational efficiency, grid resilience, and cost reduction strategies.
- AI technologies, such as machine learning, simulation software tools, and optimization algorithms, are essential for power generation scheduling, control system design, and energy market simulation. These advancements contribute to the ongoing sustainability initiatives in the energy sector.
We can help! Our analysts can customize this ai in renewable energy market research report to meet your requirements.
 RIA -
RIA - 
