AI In Semiconductor Automated Test Equipment Analysis Market Size 2025-2029
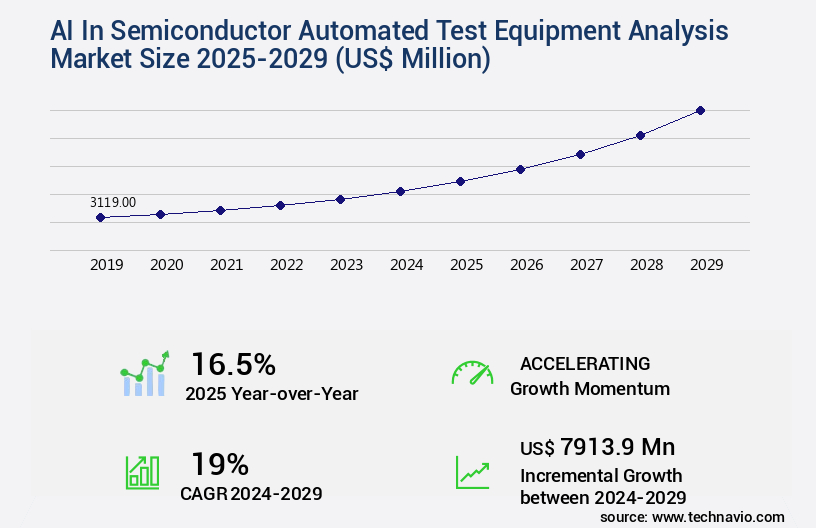
The ai in semiconductor automated test equipment analysis market size is valued to increase by USD 7.91 billion, at a CAGR of 19% from 2024 to 2029. Escalating semiconductor complexity and proliferation of advanced packaging will drive the ai in semiconductor automated test equipment analysis market.
Major Market Trends & Insights
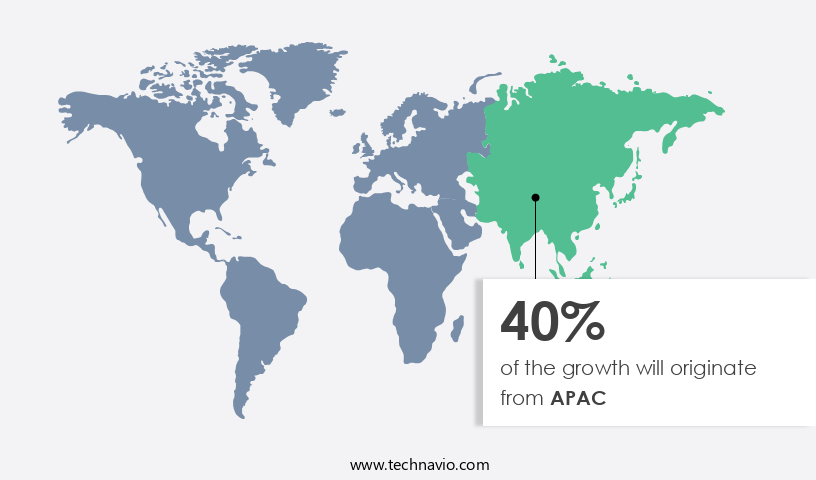
- APAC dominated the market and accounted for a 40% growth during the forecast period.
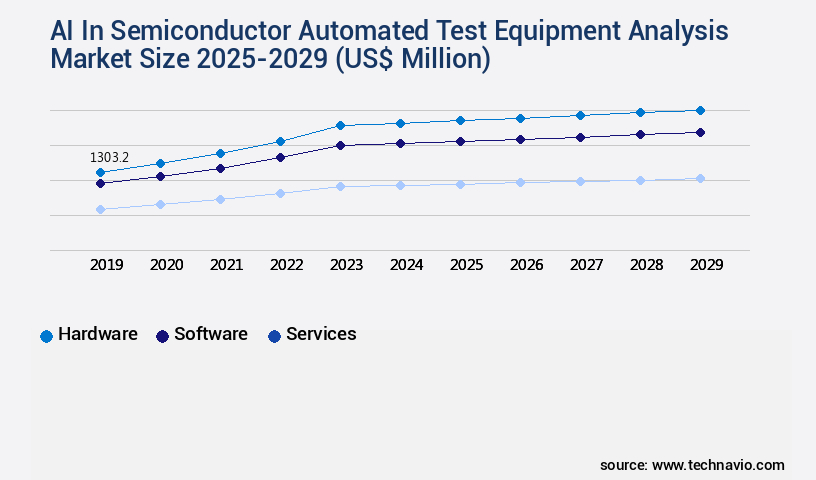
- By Component - Hardware segment was valued at USD 1.3 billion in 2023
- By Type - Non-memory ATE segment accounted for the largest market revenue share in 2023
Market Size & Forecast
- Market Opportunities: USD 336.34 million
- Market Future Opportunities: USD 7913.90 million
- CAGR from 2024 to 2029 : 19%
Market Summary
- In the dynamic semiconductor industry, AI-driven analysis in automated test equipment (ATE) has emerged as a critical catalyst for enhancing efficiency, accuracy, and adaptability. The integration of AI algorithms into ATE systems enables real-time test inference and adaptive control, addressing the escalating complexity and proliferation of advanced semiconductor technologies. This trend is further fueled by the increasing adoption of edge AI, which enables on-site analysis and rapid response to evolving manufacturing conditions. However, the implementation of AI in ATE systems also presents challenges. Data infrastructure, security, and quality integrity are paramount concerns, requiring robust solutions that can handle vast amounts of data while ensuring data privacy and security.
- Despite these challenges, the market for AI in semiconductor ATE analysis is expected to grow significantly, with a recent report estimating a value of over USD1.5 billion by 2026. This growth is driven by the increasing demand for advanced semiconductor solutions and the need for automated, data-driven testing processes. As the industry continues to evolve, AI-driven ATE analysis will play a pivotal role in ensuring the quality, reliability, and competitiveness of semiconductor manufacturing processes.
What will be the Size of the AI In Semiconductor Automated Test Equipment Analysis Market during the forecast period?
Get Key Insights on Market Forecast (PDF) Request Free Sample
How is the AI In Semiconductor Automated Test Equipment Analysis Market Segmented ?
The ai in semiconductor automated test equipment analysis industry research report provides comprehensive data (region-wise segment analysis), with forecasts and estimates in "USD million" for the period 2025-2029, as well as historical data from 2019-2023 for the following segments.
- Component
- Hardware
- Software
- Services
- Type
- Non-memory ATE
- Memory ATE
- Discrete ATE
- Technology
- Machine learning
- Deep learning
- Predictive analytics
- NLP
- End-user
- Consumer electronics
- Automotive
- Telecommunications
- High-performance computing
- Others
- Geography
- North America
- US
- Canada
- Europe
- France
- Germany
- UK
- APAC
- Australia
- China
- India
- Japan
- South Korea
- Rest of World (ROW)
- North America
By Component Insights
The hardware segment is estimated to witness significant growth during the forecast period.
The market is experiencing continuous evolution, with a significant focus on integrating advanced technologies to enhance semiconductor testing capabilities. The market encompasses various applications, including mixed-signal test, in-circuit test, wafer sort testing, final test, and functional test, among others. Traditional automated test equipment (ATE) has been augmented with AI-driven capabilities, such as test program generation, data acquisition systems, and defect detection algorithms. These AI-driven ATE systems employ machine learning and deep learning techniques for test pattern generation, test time reduction, and yield enhancement. Moreover, the adoption of edge computing ATE and cloud-based ATE solutions facilitates real-time data processing and analysis.
In the hardware segment, the integration of dedicated computational hardware within test cells is a growing trend, enabling real-time processing of data-intensive AI and machine learning workloads. According to a recent study, AI-driven ATE systems are expected to account for over 30% of the total semiconductor testing market by 2025. This underscores the increasing importance of AI and machine learning in semiconductor testing, driving innovation and improving overall manufacturing efficiency.
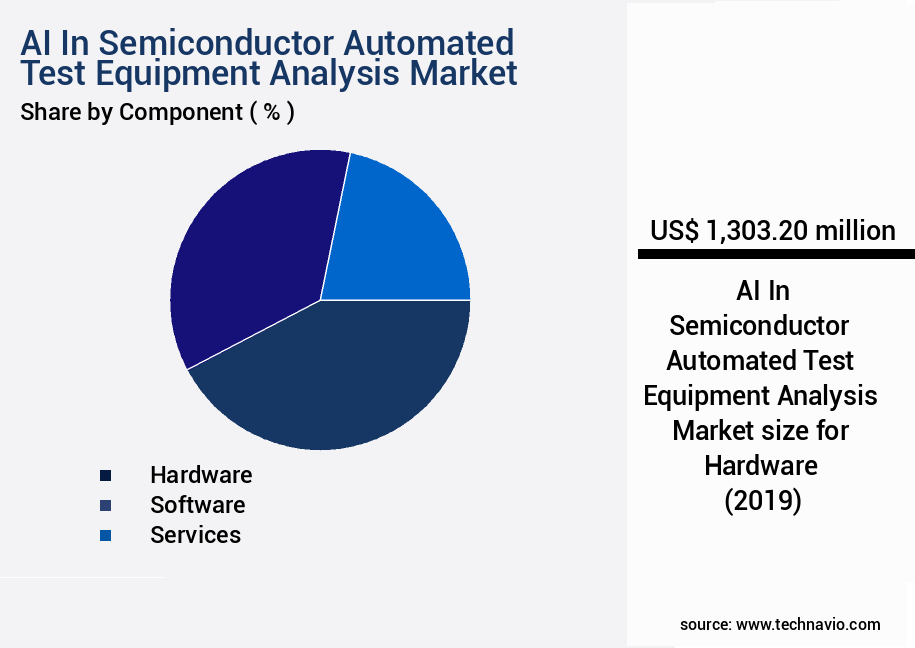
The Hardware segment was valued at USD 1.3 billion in 2019 and showed a gradual increase during the forecast period.
Regional Analysis
APAC is estimated to contribute 40% to the growth of the global market during the forecast period.Technavio's analysts have elaborately explained the regional trends and drivers that shape the market during the forecast period.
See How AI In Semiconductor Automated Test Equipment Analysis Market Demand is Rising in APAC Request Free Sample
The Asia-Pacific region leads the global semiconductor automated test equipment analysis market, driven by the dominance of Taiwan, South Korea, and China in the semiconductor manufacturing industry. Taiwan, as the world leader in advanced logic foundry services with TSMC at the helm, South Korea's powerhouse status in the global memory market led by Samsung and SK Hynix, and China's aggressive national strategy for semiconductor self-sufficiency create an unparalleled economic incentive for yield optimization. Even minor improvements in yield translate into substantial revenue gains due to the sheer scale of production in this region. The market is expected to witness significant growth, fueled by the increasing adoption of artificial intelligence and machine learning technologies in semiconductor manufacturing processes.
Market Dynamics
Our researchers analyzed the data with 2024 as the base year, along with the key drivers, trends, and challenges. A holistic analysis of drivers will help companies refine their marketing strategies to gain a competitive advantage.
The global AI in semiconductor automated test equipment (ATE) analysis market is experiencing significant growth as companies seek to enhance their semiconductor testing capabilities. AI algorithms for semiconductor defect classification are at the forefront of this trend, enabling more accurate and efficient identification of defects during the manufacturing process. Automated test equipment maintenance procedures are being augmented with AI technologies, allowing for predictive maintenance and reducing downtime. Semiconductor testing yield improvement strategies are also benefiting from AI, with high-speed digital test methodologies and advanced test program generation techniques being implemented to increase throughput and reduce errors. Machine learning is increasingly being used to improve ATE system integration, enabling seamless data flow between different testing tools and systems.
Data analytics for semiconductor testing is another area where AI is making a significant impact, providing valuable insights into test data and enabling statistical process control in semiconductor manufacturing. Reducing test time in high-volume semiconductor production is a key challenge, and AI is helping to address this by improving test coverage and reducing false positives. Big data applications in semiconductor testing are also gaining traction, with cloud-based ATE deployment strategies enabling more flexible and scalable testing solutions. Advanced failure analysis techniques in the semiconductor industry are being enhanced with AI, enabling more accurate and efficient root cause analysis. Edge computing applications for semiconductor testing are also emerging, providing real-time analysis and enabling faster response times. Despite these advances, there are still challenges to implementing AI in ATE, including data security and privacy concerns, as well as the need for specialized skills and expertise. However, the benefits of AI in semiconductor testing are clear, and the market is expected to continue growing as more companies adopt these technologies to improve their testing capabilities and stay competitive.
What are the key market drivers leading to the rise in the adoption of AI In Semiconductor Automated Test Equipment Analysis Industry?
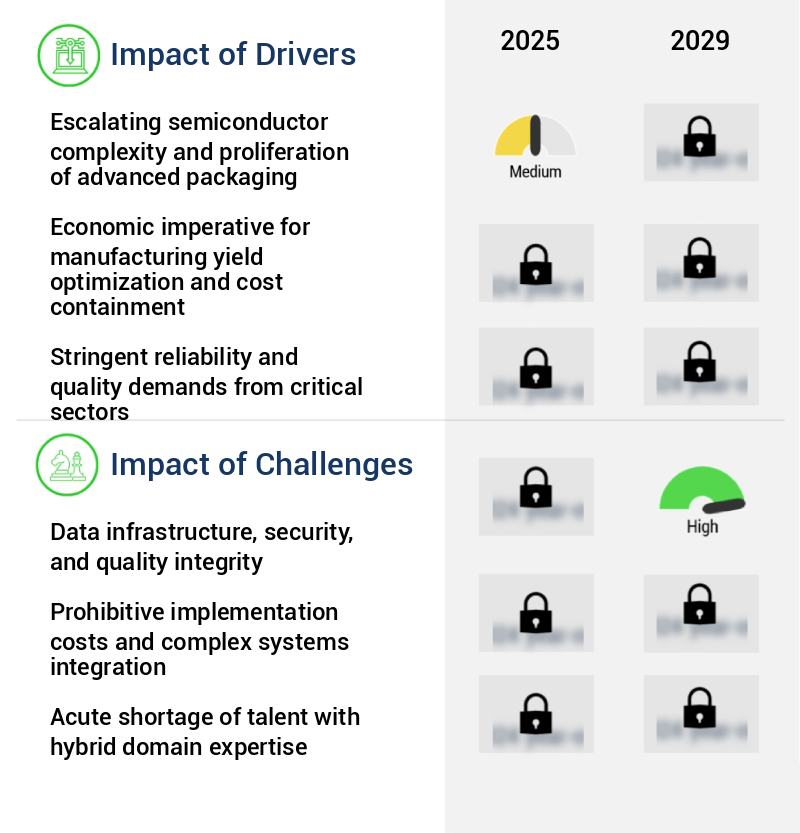
- The relentless increase in semiconductor complexity and the widespread adoption of advanced packaging technologies are the primary factors fueling market growth.
- The integration of AI in semiconductor automated test equipment analysis is a response to the escalating complexity of semiconductor devices. This shift is not a trivial evolution but a transformative trend fueled by two primary factors: the pursuit of smaller nanometer process nodes and the industry's embrace of advanced packaging technologies, such as heterogeneous integration. At smaller nodes, quantum effects and atomic-level process variability introduce intricate and probabilistic defect mechanisms that are challenging to model and detect using conventional, rule-based testing.
- Meanwhile, the transition from monolithic system-on-chip designs to multi-chiplet systems assembled in a single package significantly amplifies testing intricacy. AI's ability to learn and adapt to these complexities offers a promising solution, enabling more accurate and efficient defect detection and analysis.
What are the market trends shaping the AI In Semiconductor Automated Test Equipment Analysis Industry?
- The trend in the market involves the increasing use of edge AI for real-time test inference and adaptive control. Proliferation of this technology is imminent.
- The market is undergoing a transformative evolution, moving from centralized, post-process data analysis to decentralized, real-time inference at the network edge. Known as Edge AI, this paradigm deploys trained machine learning models directly onto or near the automated test equipment, facilitating instantaneous decision-making during the test execution. Traditionally, AI implementation in semiconductor testing involved a batch-oriented process: ATE systems accumulated vast amounts of raw test data, which were subsequently transferred to a central data center or cloud platform for offline processing and analysis.
- This shift towards Edge AI signifies a significant improvement in test efficiency and accuracy, as decisions can be made in real-time rather than waiting for post-test analysis. Furthermore, it reduces the reliance on extensive data transfer and processing, thereby minimizing latency and bandwidth requirements.
What challenges does the AI In Semiconductor Automated Test Equipment Analysis Industry face during its growth?
- Maintaining data infrastructure, security, and ensuring quality integrity are crucial challenges that significantly impact industry growth. These aspects require meticulous attention to ensure the sustained success and expansion of businesses within the industry.
- The integration of AI in semiconductor automated test equipment analysis faces a significant hurdle due to the need for a robust, secure, and unified data infrastructure. The effectiveness of AI models in high-stakes manufacturing environments relies on the data's quality, accessibility, and integrity. Semiconductor manufacturing generates vast amounts of data from numerous disparate sources, such as front-end process control monitors, inline wafer inspection systems, and back-end automated test equipment (ATE) platforms. This data is frequently fragmented, with varying formats, resolutions, and nomenclatures, making data aggregation and harmonization a complex engineering endeavor.
- According to recent research, up to 80% of enterprise data is unstructured, and 73% of businesses identify data silos as their biggest challenge in implementing AI and analytics initiatives. It is crucial to address these challenges to unlock the full potential of AI in semiconductor manufacturing and drive improvements in efficiency, quality, and yield.
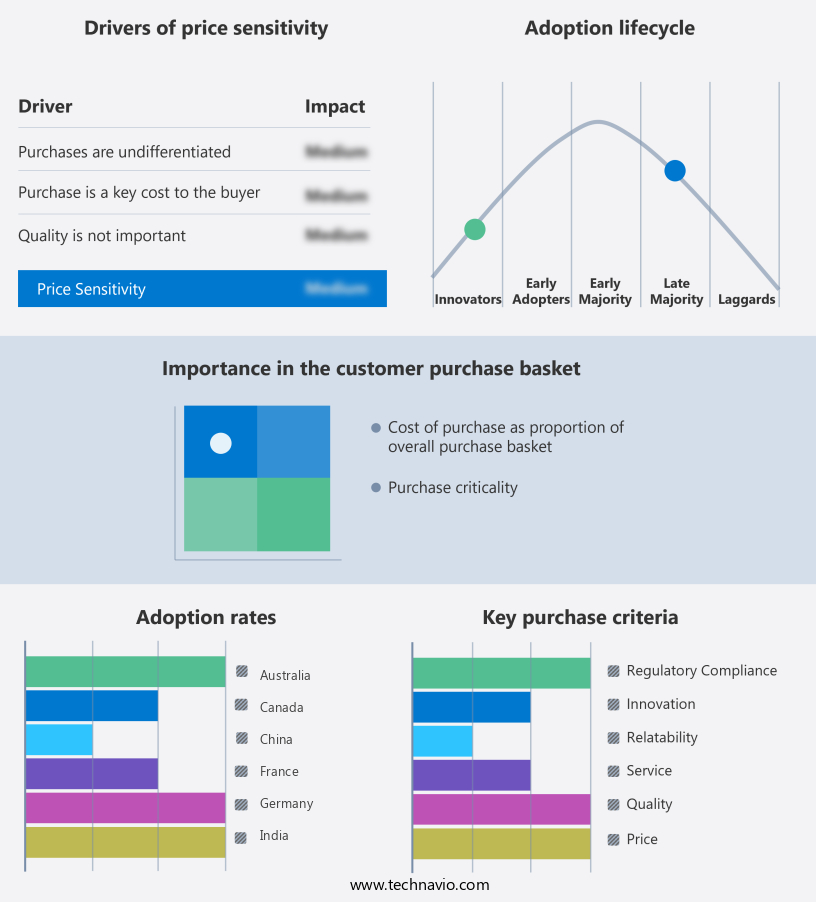
Exclusive Technavio Analysis on Customer Landscape
The ai in semiconductor automated test equipment analysis market forecasting report includes the adoption lifecycle of the market, covering from the innovator's stage to the laggard's stage. It focuses on adoption rates in different regions based on penetration. Furthermore, the ai in semiconductor automated test equipment analysis market report also includes key purchase criteria and drivers of price sensitivity to help companies evaluate and develop their market growth analysis strategies.
Customer Landscape of AI In Semiconductor Automated Test Equipment Analysis Industry
Competitive Landscape
Companies are implementing various strategies, such as strategic alliances, ai in semiconductor automated test equipment analysis market forecast, partnerships, mergers and acquisitions, geographical expansion, and product/service launches, to enhance their presence in the industry.
Advantest Corp. - This company revolutionizes semiconductor testing with AI-driven analysis through its real-time edge ecosystem. Leveraging ACS Real-Time Data Infrastructure, adaptive testing and yield optimization are achieved, enhancing industry efficiency.
The industry research and growth report includes detailed analyses of the competitive landscape of the market and information about key companies, including:
- Advantest Corp.
- Aemulus Holdings Bhd
- Astronics Corp.
- Chroma ATE Inc.
- Cohu Inc.
- FormFactor Inc.
- Keysight Technologies Inc.
- MAC Panel
- Marvin Test Solutions Inc.
- Micronics Japan Co. Ltd.
- National Instruments Corp.
- SPEA Spa
- STAR TECHNOLOGIES
- Synopsys Inc.
- Teradyne Inc.
- TESEC Inc.
- Tokyo Electron Ltd.
- Virginia Panel Corp.
- ViTrox Corp. Berhad
Qualitative and quantitative analysis of companies has been conducted to help clients understand the wider business environment as well as the strengths and weaknesses of key industry players. Data is qualitatively analyzed to categorize companies as pure play, category-focused, industry-focused, and diversified; it is quantitatively analyzed to categorize companies as dominant, leading, strong, tentative, and weak.
Recent Development and News in AI In Semiconductor Automated Test Equipment Analysis Market
- In January 2024, Teradyne, a leading provider of automated test equipment solutions, introduced its new AI-powered semiconductor test solution, "Intronix AXI," designed to improve test productivity and accuracy (Teradyne Press Release, 2024). In March 2024, Advantest Corporation and Microsoft announced a strategic partnership to integrate Microsoft Azure AI and machine learning capabilities into Advantest's automated test equipment, enhancing test data analysis and predictive maintenance (Advantest Press Release, 2024).
- In April 2024, National Instruments raised USD1.2 billion through a public offering to expand its AI and machine learning offerings in the semiconductor test equipment market (National Instruments Securities Filing, 2024). In May 2025, STMicroelectronics and Tesonet, a Lithuanian AI company, collaborated to develop AI algorithms for automated semiconductor test equipment, aiming to reduce test time and improve defect detection (STMicroelectronics Press Release, 2025).
Dive into Technavio's robust research methodology, blending expert interviews, extensive data synthesis, and validated models for unparalleled AI In Semiconductor Automated Test Equipment Analysis Market insights. See full methodology.
|
Market Scope |
|
|
Report Coverage |
Details |
|
Page number |
262 |
|
Base year |
2024 |
|
Historic period |
2019-2023 |
|
Forecast period |
2025-2029 |
|
Growth momentum & CAGR |
Accelerate at a CAGR of 19% |
|
Market growth 2025-2029 |
USD 7913.9 million |
|
Market structure |
Fragmented |
|
YoY growth 2024-2025(%) |
16.5 |
|
Key countries |
US, China, South Korea, Germany, Japan, UK, France, India, Canada, and Australia |
|
Competitive landscape |
Leading Companies, Market Positioning of Companies, Competitive Strategies, and Industry Risks |
Research Analyst Overview
- The semiconductor automated test equipment (ATE) market continues to evolve, driven by the increasing complexity of mixed-signal test applications and the integration of advanced technologies such as defect detection algorithms, test program generation, data acquisition systems, memory test, failure analysis, and test pattern generation. Edge computing ATE, with its ability to process data closer to the source, is gaining traction in the industry. For instance, a leading semiconductor manufacturer reported a 20% increase in yield enhancement by implementing AI-driven ATE for in-circuit test and final test. The global semiconductor testing market is expected to grow by over 10% annually, fueled by the demand for higher test coverage optimization, process monitoring, and test time reduction.
- Machine learning ATE and deep learning ATE are revolutionizing parametric test, wafer sort testing, functional test, low-power testing, high-speed testing, and RF test. These advanced techniques enable more accurate defect detection and analysis, leading to improved quality control and statistical process control. Cloud-based ATE and test data analytics are also transforming the landscape, enabling real-time data access and analysis, and facilitating test coverage optimization across various sectors. Signal processing techniques and test pattern generation continue to play a crucial role in ensuring the reliability and performance of semiconductor devices.
What are the Key Data Covered in this AI In Semiconductor Automated Test Equipment Analysis Market Research and Growth Report?
-
What is the expected growth of the AI In Semiconductor Automated Test Equipment Analysis Market between 2025 and 2029?
-
USD 7.91 billion, at a CAGR of 19%
-
-
What segmentation does the market report cover?
-
The report is segmented by Component (Hardware, Software, and Services), Type (Non-memory ATE, Memory ATE, and Discrete ATE), Technology (Machine learning, Deep learning, Predictive analytics, and NLP), End-user (Consumer electronics, Automotive, Telecommunications, High-performance computing, and Others), and Geography (APAC, North America, Europe, South America, and Middle East and Africa)
-
-
Which regions are analyzed in the report?
-
APAC, North America, Europe, South America, and Middle East and Africa
-
-
What are the key growth drivers and market challenges?
-
Escalating semiconductor complexity and proliferation of advanced packaging, Data infrastructure, security, and quality integrity
-
-
Who are the major players in the AI In Semiconductor Automated Test Equipment Analysis Market?
-
Advantest Corp., Aemulus Holdings Bhd, Astronics Corp., Chroma ATE Inc., Cohu Inc., FormFactor Inc., Keysight Technologies Inc., MAC Panel, Marvin Test Solutions Inc., Micronics Japan Co. Ltd., National Instruments Corp., SPEA Spa, STAR TECHNOLOGIES, Synopsys Inc., Teradyne Inc., TESEC Inc., Tokyo Electron Ltd., Virginia Panel Corp., and ViTrox Corp. Berhad
-
Market Research Insights
- The market for AI in semiconductor automated test equipment analysis is continuously evolving, with a growing emphasis on enhancing test efficiency and data integrity. Two notable trends include the integration of AI for hardware upgrades and probe card analysis. For instance, AI algorithms can significantly reduce defect density in high-volume production by up to 30%, enabling faster test execution and lower test cost.
- Furthermore, industry growth in this sector is anticipated to reach over 15% annually, reflecting the increasing demand for test automation and system architecture optimization. AI's role in semiconductor testing extends to various applications, such as ATE calibration, test development, and software upgrades, ultimately contributing to improved performance optimization and test time reduction.
We can help! Our analysts can customize this ai in semiconductor automated test equipment analysis market research report to meet your requirements.
 RIA -
RIA - 
