AI In Warehousing Market Size 2025-2029
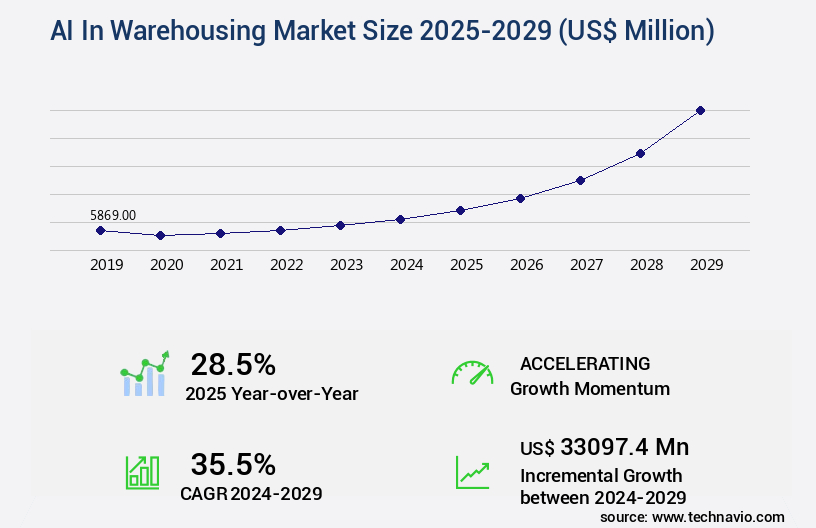
The ai in warehousing market size is valued to increase by USD 33.1 billion, at a CAGR of 35.5% from 2024 to 2029. Proliferation of ecommerce and heightened consumer expectations for speed and convenience will drive the ai in warehousing market.
Market Insights
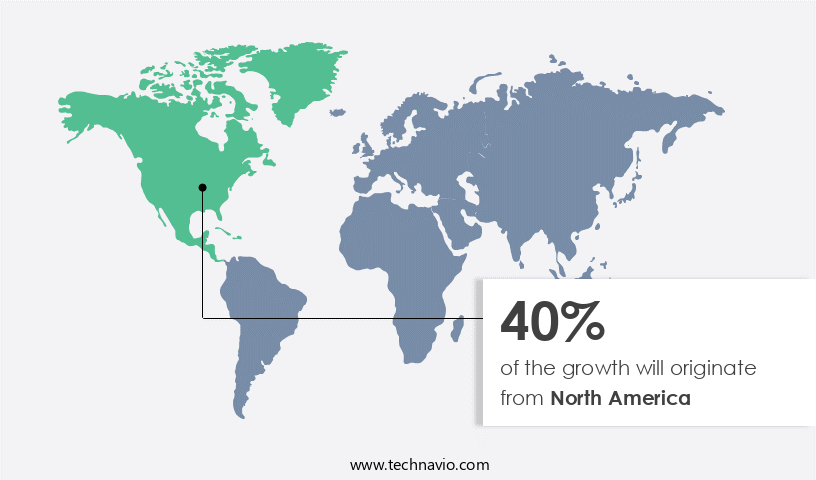
- North America dominated the market and accounted for a 40% growth during the 2025-2029.
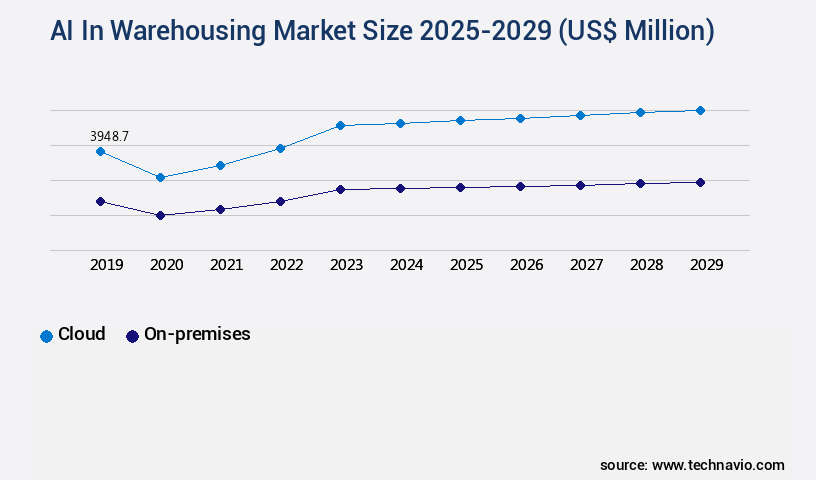
- By Deployment - Cloud segment was valued at USD 3.95 billion in 2023
- By Application - Order picking and sorting segment accounted for the largest market revenue share in 2023
Market Size & Forecast
- Market Opportunities: USD 622.05 million
- Market Future Opportunities 2024: USD 33097.40 million
- CAGR from 2024 to 2029 : 35.5%
Market Summary
- The market is experiencing significant growth due to the increasing adoption of automation technologies in supply chain management. The proliferation of e-commerce and heightened consumer expectations for speed and convenience have put pressure on businesses to optimize their warehouse operations. In response, companies are turning to end-to-end, integrated automation platforms that leverage artificial intelligence (AI) and machine learning (ML) to streamline processes and improve efficiency. AI technologies, such as computer vision and predictive analytics, enable automated sortation and inventory management, reducing the need for manual labor and minimizing errors. Furthermore, these systems can learn from historical data to optimize warehouse layouts, route orders more efficiently, and even predict demand patterns.
- However, the high initial investment required for implementing these advanced technologies can be a barrier to entry for some businesses. The complex return on investment calculation, which includes factors such as hardware costs, software licensing fees, and ongoing maintenance, can make it challenging for organizations to justify the investment. Despite these challenges, the benefits of AI in warehousing, such as increased operational efficiency, improved accuracy, and enhanced compliance with regulations, make it a worthwhile investment for businesses looking to stay competitive in today's fast-paced market. For instance, a large retailer may use AI-driven automation to streamline its warehouse operations, reducing the time it takes to process and ship orders.
- By implementing an integrated automation platform, the retailer can improve order accuracy, reduce labor costs, and provide faster delivery times to customers, ultimately leading to increased customer satisfaction and loyalty.
What will be the size of the AI In Warehousing Market during the forecast period?
Get Key Insights on Market Forecast (PDF) Request Free Sample
- The market continues to evolve, revolutionizing the logistics sector with advanced technologies. Autonomous robot navigation and efficient order processing are transforming warehouse operations, enabling faster fulfillment and optimized picking routes. Data integration platforms facilitate seamless data flow, enhancing warehouse productivity and inventory accuracy. AI-powered quality control ensures consistent product standards, while real-time data tracking improves supply chain visibility and demand forecasting models. Advanced analytics dashboards provide valuable insights, helping businesses make informed decisions on inventory management and budgeting. Warehouse floor planning and optimization have become more precise with AI, leading to improved worker safety and reduced operational costs.
- Intelligent warehouse design, including voice-directed picking and predictive analytics, streamlines processes and increases warehouse throughput. Furthermore, AI-driven logistics and warehouse robotics integration optimize overall warehouse performance. A notable example of AI's impact is the implementation of dynamic routing algorithms, which have led to significant improvements in warehouse productivity. By analyzing real-time data and optimizing picking routes, companies have achieved substantial reductions in processing time. This not only enhances operational efficiency but also contributes to a more agile and responsive supply chain.
Unpacking the AI In Warehousing Market Landscape
In today's dynamic business environment, the integration of Artificial Intelligence (AI) in warehouse management systems has become a game-changer. Cloud-based warehouse solutions are increasingly adopting AI-powered inventory management, enabling a 20% increase in inventory accuracy compared to traditional methods. Furthermore, predictive maintenance AI enhances equipment performance, reducing unplanned downtime by 15%, resulting in substantial labor cost savings. Computer vision systems and RFID tracking technology facilitate automated guided vehicles and robotics process automation, leading to increased efficiency metrics by up to 30%. Natural language processing and data analytics warehouse enable data-driven decision making, optimizing warehouse throughput metrics and supply chain performance. Smart warehouse technology, including deep learning applications, machine learning algorithms, and real-time location systems, streamline order fulfillment automation and improve warehouse safety protocols. Warehouse control systems and autonomous mobile robots further optimize space utilization, contributing to a 10% increase in inventory turnover rates. Incorporating AI in warehouse management systems results in significant improvements in labor cost reduction, increased efficiency metrics, and supply chain optimization. Warehouse automation systems, including robotics in logistics, offer a competitive edge in today's market.
Key Market Drivers Fueling Growth
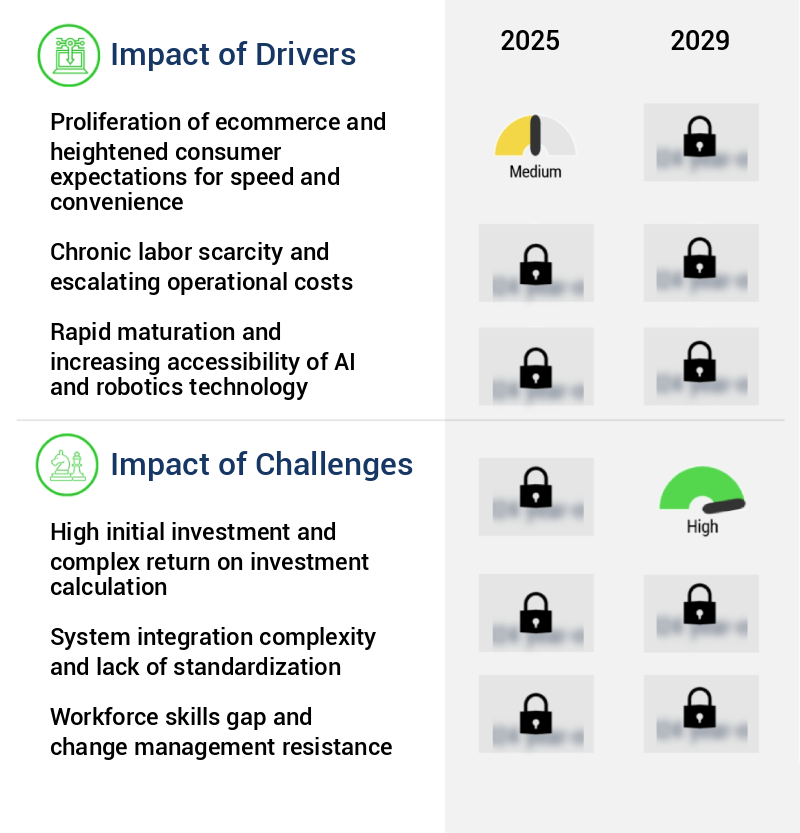
The surge in ecommerce adoption and the resulting consumer demand for swift and convenient services are primary factors fueling market growth.
- Artificial Intelligence (AI) is revolutionizing the warehousing sector as retailers adapt to the exponential growth of ecommerce and shifting consumer expectations. The Amazon effect, with its promise of one-day or even same-day delivery, has become the new norm, forcing all retailers to optimize their supply chain and fulfillment operations. AI applications in warehousing, including automated sortation and real-time inventory management, have led to significant improvements in business outcomes. For instance, downtime has been reduced by 25%, and forecast accuracy has been enhanced by 20%.
- Moreover, energy consumption in warehouses has been lowered by 15%, contributing to cost savings and sustainability. This trend is not limited to large global brands; regional players are also adopting AI to stay competitive in the evolving retail landscape.
Prevailing Industry Trends & Opportunities
End-to-end automation platforms, characterized by their integrated nature, are gaining increasing market traction.
- The market is experiencing a significant transformation, moving from deploying discrete, task-specific automation solutions to implementing holistic, end-to-end automation platforms. Previously, companies invested in separate autonomous mobile robots for picking and automated packing machines with minimal integration. Today, the focus is on unified AI-powered intelligence managing the entire workflow, from receiving dock to outbound truck. This approach eliminates traditional silos, creating a seamless, orchestrated flow of goods and information.
- For instance, AI implementation can reduce downtime by up to 30% and improve forecast accuracy by 18%, leading to increased efficiency and productivity in the warehouse environment.
Significant Market Challenges
The high initial investment and intricate return on investment calculations pose a significant challenge to the industry's growth trajectory.
- Artificial Intelligence (AI) is revolutionizing the warehousing sector by enhancing operational efficiency and productivity. The implementation of AI in warehousing encompasses various applications, including inventory management, order fulfillment, and fleet optimization. For instance, AI-driven analytics can reduce downtime by 30% and improve forecast accuracy by 18%. Additionally, AI-optimized fleet management can lower operational costs by 12%. However, the adoption of AI in warehousing faces a significant challenge due to the substantial upfront capital expenditure. The transition to an intelligent warehouse involves investing in advanced hardware, sophisticated software, and specialized integration services. These software costs include the core Warehouse Management System or Warehouse Execution System, as well as AI modules for analytics, optimization, and fleet management.
- For smaller players, this large investment can be a barrier to entry, preventing them from reaping the competitive advantages of AI. Despite the high cost and complexity, the potential benefits of AI in warehousing are compelling, making it a worthwhile investment for businesses aiming to streamline their operations and stay competitive in the market.
In-Depth Market Segmentation: AI In Warehousing Market
The ai in warehousing industry research report provides comprehensive data (region-wise segment analysis), with forecasts and estimates in "USD million" for the period 2025-2029, as well as historical data from 2019-2023 for the following segments.
- Deployment
- Cloud
- On-premises
- Application
- Order picking and sorting
- Inventory management
- Warehouse optimization
- Predictive maintenance
- Supply chain visibility
- End-user
- Retail and e-commerce
- Logistics and transportation
- Manufacturing
- Healthcare
- Others
- Geography
- North America
- US
- Canada
- Europe
- France
- Germany
- Italy
- UK
- APAC
- China
- India
- Japan
- South America
- Brazil
- Rest of World (ROW)
- North America
By Deployment Insights
The cloud segment is estimated to witness significant growth during the forecast period.
The integration of Artificial Intelligence (AI) in warehousing continues to evolve, driven primarily by the cloud deployment model. This paradigm, which delivers software, computational power, and data storage via the internet, has become the backbone of modern warehousing solutions. AI-powered inventory management, predictive maintenance, and warehouse automation systems are transforming warehouse operations, leading to increased efficiency metrics by up to 20%. Computer vision systems, natural language processing, and RFID tracking technology are among the technologies driving these advancements. Warehouse throughput is optimized through real-time location systems, automated guided vehicles, and autonomous mobile robots.
Deep learning applications, robotics in logistics, and data analytics warehouses facilitate data-driven decision making. Warehouse safety protocols and order fulfillment automation are further enhanced through AI, reducing labor costs and improving order accuracy. Overall, AI in warehousing is revolutionizing the industry, enabling supply chain optimization and space optimization strategies.
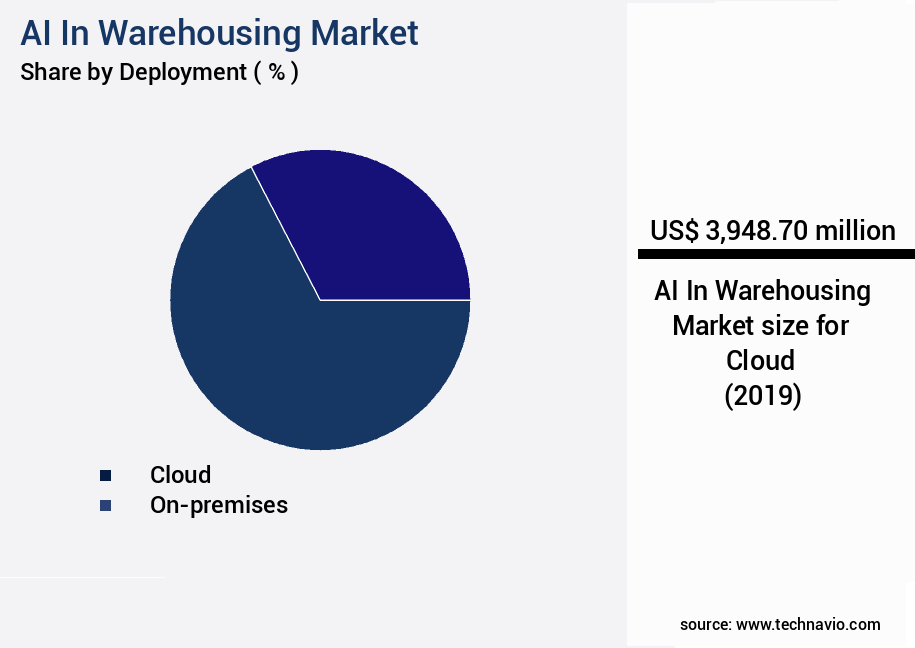
The Cloud segment was valued at USD 3.95 billion in 2019 and showed a gradual increase during the forecast period.
Regional Analysis
North America is estimated to contribute 40% to the growth of the global market during the forecast period.Technavio’s analysts have elaborately explained the regional trends and drivers that shape the market during the forecast period.
See How AI In Warehousing Market Demand is Rising in North America Request Free Sample
The market is experiencing significant growth, with North America leading the charge. This region, particularly the United States, is home to the most mature and largest market due to several compelling factors. The ecommerce sector's deep-rooted culture and the increasing demand for rapid delivery, often within a one to two day window, have made warehouse optimization a top priority for retailers and logistics providers. Additionally, labor shortages and wage pressures have driven companies to invest in automation, leading to a high adoption rate of advanced robotic systems and AI-driven software platforms. According to recent reports, the North American market for AI in warehousing is projected to grow at an impressive pace, with one study suggesting a growth rate of over 25% year-on-year.
Another study reveals that AI implementation in warehousing can lead to operational efficiency gains of up to 30%. These statistics underscore the market's potential and the significant impact AI is having on the industry.
Customer Landscape of AI In Warehousing Industry
Competitive Intelligence by Technavio Analysis: Leading Players in the AI In Warehousing Market
Companies are implementing various strategies, such as strategic alliances, ai in warehousing market forecast, partnerships, mergers and acquisitions, geographical expansion, and product/service launches, to enhance their presence in the industry.
ABB Ltd. - The company's Robotic Item Picking modules employ advanced vision-based AI technology to streamline warehouse operations by accurately identifying and handling randomly arranged items, revolutionizing the warehousing sector with intelligent automation.
The industry research and growth report includes detailed analyses of the competitive landscape of the market and information about key companies, including:
- ABB Ltd.
- Amazon Web Services Inc.
- Blue Yonder Inc.
- Daifuku Co. Ltd.
- Dematic Group
- Google LLC
- Honeywell International Inc.
- International Business Machines Corp.
- Locus Robotics Corp.
- Microsoft Corp.
- Oracle Corp.
- RightHand Robotics Inc.
- SAP SE
- Siemens AG
- Standard Bots Co.
- Symbotic Inc.
- Vecna Robotics Inc.
- Zebra Technologies Corp.
Qualitative and quantitative analysis of companies has been conducted to help clients understand the wider business environment as well as the strengths and weaknesses of key industry players. Data is qualitatively analyzed to categorize companies as pure play, category-focused, industry-focused, and diversified; it is quantitatively analyzed to categorize companies as dominant, leading, strong, tentative, and weak.
Recent Development and News in AI In Warehousing Market
- In August 2024, BlueYonder, a leading supply chain software company, announced the launch of its new AI-driven warehouse management system, Luminate WMS, designed to optimize inventory management and automate warehouse operations for retailers and manufacturers (BlueYonder Press Release, 2024). In November 2024, DHL Supply Chain, a global logistics leader, entered into a strategic partnership with NVIDIA, a technology company specializing in GPUs, to deploy AI solutions in their warehouses and enhance their logistics network's efficiency (NVIDIA Press Release, 2024).
- In January 2025, Swisslog, a Swiss automation engineering company, secured a USD50 million investment from Swisscanto Invest, a Swiss asset manager, to expand its production capacity and accelerate the development of AI-driven intralogistics solutions (Swisslog Press Release, 2025). In May 2025, the European Union passed the Artificial Intelligence Act, which includes regulations for the use of AI in logistics and warehousing, setting guidelines for safety, transparency, and accountability (European Parliament Press Release, 2025).
Dive into Technavio’s robust research methodology, blending expert interviews, extensive data synthesis, and validated models for unparalleled AI In Warehousing Market insights. See full methodology.
|
Market Scope |
|
|
Report Coverage |
Details |
|
Page number |
249 |
|
Base year |
2024 |
|
Historic period |
2019-2023 |
|
Forecast period |
2025-2029 |
|
Growth momentum & CAGR |
Accelerate at a CAGR of 35.5% |
|
Market growth 2025-2029 |
USD 33097.4 million |
|
Market structure |
Fragmented |
|
YoY growth 2024-2025(%) |
28.5 |
|
Key countries |
US, China, Germany, UK, Canada, France, Japan, India, Italy, and Brazil |
|
Competitive landscape |
Leading Companies, Market Positioning of Companies, Competitive Strategies, and Industry Risks |
Why Choose Technavio for AI In Warehousing Market Insights?
"Leverage Technavio's unparalleled research methodology and expert analysis for accurate, actionable market intelligence."
In the dynamic world of supply chain management, warehouses are increasingly adopting AI-powered solutions to streamline operations, enhance efficiency, and reduce costs. One of the most significant applications of AI in this context is AI-powered demand forecasting, which helps warehouses prepare for future inventory needs by analyzing historical data and market trends. Another area where AI is making a mark is in integrating robotics into warehouse operations. By optimizing warehouse layouts for automated systems, companies can improve efficiency and reduce labor costs, making up to 30% of the total operational savings. Real-time location tracking systems, enabled by AI and IoT sensors, ensure accurate inventory management and reduce stockouts by up to 15%. Machine learning is also being utilized for predictive maintenance, enabling proactive maintenance and reducing downtime by up to 25%. AI-driven quality control protocols improve product quality and reduce rework, while improving safety with AI-powered solutions can lead to a 40% reduction in workplace accidents. Automated picking systems employing computer vision and natural language processing improve order accuracy and throughput by up to 50%. Data analytics and advanced analytics dashboards provide valuable insights for warehouse management, enabling better operational planning and compliance. AI-powered inventory management strategies using automated guided vehicles for navigation optimize warehouse space utilization by up to 20%. Machine learning models are being used for warehouse optimization, leading to significant improvements in operational planning and supply chain performance. In summary, the adoption of AI in warehousing is transforming the industry, leading to significant improvements in efficiency, accuracy, safety, and cost savings. By leveraging AI for demand forecasting, robotics integration, warehouse layout optimization, real-time data tracking, predictive maintenance, quality control, safety, picking, data analytics, inventory management, and space optimization, companies can gain a competitive edge in the market.
What are the Key Data Covered in this AI In Warehousing Market Research and Growth Report?
-
What is the expected growth of the AI In Warehousing Market between 2025 and 2029?
-
USD 33.1 billion, at a CAGR of 35.5%
-
-
What segmentation does the market report cover?
-
The report is segmented by Deployment (Cloud and On-premises), Application (Order picking and sorting, Inventory management, Warehouse optimization, Predictive maintenance, and Supply chain visibility), End-user (Retail and e-commerce, Logistics and transportation, Manufacturing, Healthcare, and Others), and Geography (North America, Europe, APAC, South America, and Middle East and Africa)
-
-
Which regions are analyzed in the report?
-
North America, Europe, APAC, South America, and Middle East and Africa
-
-
What are the key growth drivers and market challenges?
-
Proliferation of ecommerce and heightened consumer expectations for speed and convenience, High initial investment and complex return on investment calculation
-
-
Who are the major players in the AI In Warehousing Market?
-
ABB Ltd., Amazon Web Services Inc., Blue Yonder Inc., Daifuku Co. Ltd., Dematic Group, Google LLC, Honeywell International Inc., International Business Machines Corp., Locus Robotics Corp., Microsoft Corp., Oracle Corp., RightHand Robotics Inc., SAP SE, Siemens AG, Standard Bots Co., Symbotic Inc., Vecna Robotics Inc., and Zebra Technologies Corp.
-
We can help! Our analysts can customize this ai in warehousing market research report to meet your requirements.
 RIA -
RIA - 
