AI Sensor Integration Market Analysis, Size, and Forecast 2026-2030: North America (US, Canada, and Mexico), APAC (China, Japan, and India), Europe (Germany, France, and UK), South America (Brazil and Argentina), Middle East and Africa (Saudi Arabia, UAE, and South Africa), and Rest of World (ROW)

AI Sensor Integration Market Analysis, Size, and Forecast 2026-2030:
North America (US, Canada, and Mexico), APAC (China, Japan, and India), Europe (Germany, France, and UK), South America (Brazil and Argentina), Middle East and Africa (Saudi Arabia, UAE, and South Africa), and Rest of World (ROW)

Published: Apr 2026 322 Pages SKU: IRTNTR80681

Market Overview at a Glance

$30.88 B
Market Opportunity
43.2%
CAGR 2025 - 2030
36.1%
North America Growth
$1.38 B
Mobility sector segment 2024

AI Sensor Integration Market Size 2026-2030

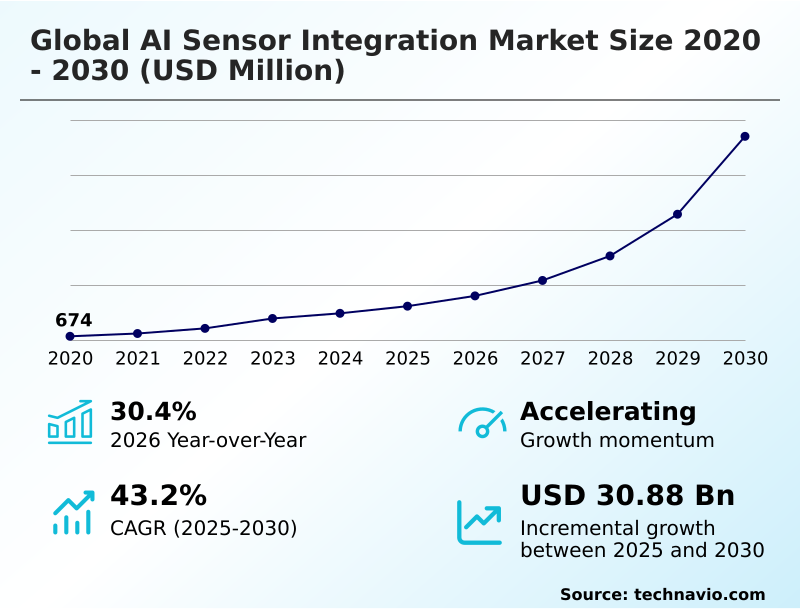
The ai sensor integration market size is valued to increase by USD 30.88 billion, at a CAGR of 43.2% from 2025 to 2030. Rapid advancement in edge computing and local processing capabilities will drive the ai sensor integration market.

Major Market Trends & Insights

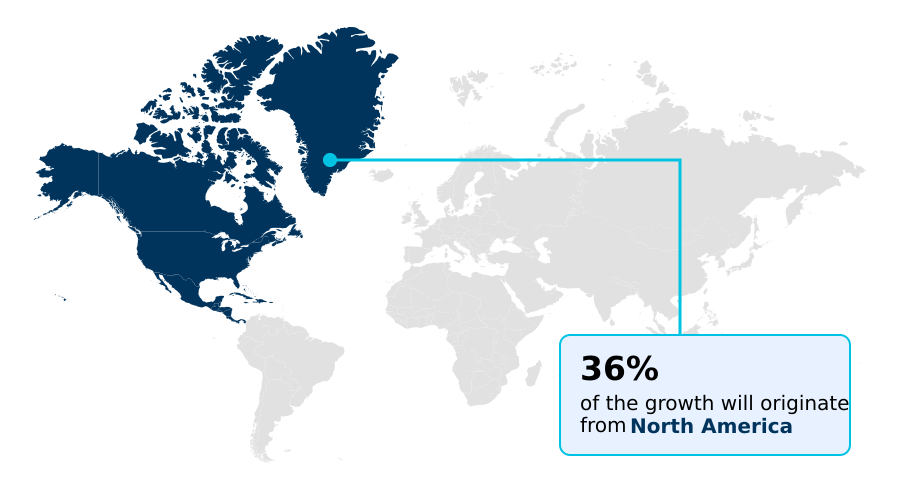
  • North America dominated the market and accounted for a 36.1% growth during the forecast period.
  • By Application - Mobility sector segment was valued at USD 1.38 billion in 2024
  • By Technology - Machine learning segment accounted for the largest market revenue share in 2024

Market Size & Forecast

  • Market Opportunities: USD 36.36 billion
  • Market Future Opportunities: USD 30.88 billion
  • CAGR from 2025 to 2030 : 43.2%

Market Summary

  • The AI Sensor Integration market is characterized by a rapid shift toward decentralizing intelligence, moving from cloud-based analysis to on-device AI processing. This transition is enabled by developments in system-on-chip architectures and embedded neural networks, which allow for real-time data interpretation directly at the source.
  • Key drivers include the push for Industry 4.0 integration, where industrial automation sensors facilitate predictive maintenance systems, and the evolution of autonomous systems perception in mobility. A prominent business scenario involves a smart factory ecosystem where AI-driven thermal sensing and acoustic signature analysis on machinery can preemptively identify potential failures, reducing unplanned downtime by over 30%.
  • However, the industry grapples with challenges like hardware-software harmonization and ensuring sensor data security across diverse applications. Trends such as multimodal sensor fusion and autocalibration algorithms are creating more robust and reliable intelligent sensing solutions, paving the way for sophisticated applications in healthcare, robotics, and smart city infrastructure. This convergence of advanced hardware and sophisticated software defines the competitive landscape.

What will be the Size of the AI Sensor Integration Market during the forecast period?

Get Key Insights on Market Forecast (PDF) Request Free Sample

How is the AI Sensor Integration Market Segmented?

The ai sensor integration industry research report provides comprehensive data (region-wise segment analysis), with forecasts and estimates in "USD million" for the period 2026-2030, as well as historical data from 2020-2024 for the following segments.
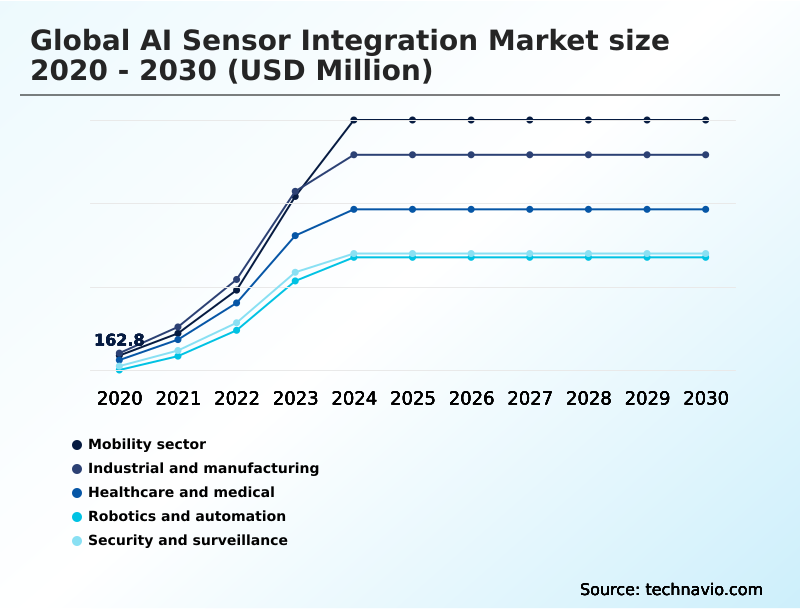
  • Application
    • Mobility sector
    • Industrial and manufacturing
    • Healthcare and medical
    • Robotics and automation
    • Security and surveillance
  • Technology
    • Machine learning
    • Computer vision
    • Deep learning
    • Natural language processing
  • Type
    • Image sensors
    • Radar sensors
    • Ultrasonic sensors
    • Lidar sensors
  • Geography
    • North America
      • US
      • Canada
      • Mexico
    • APAC
      • China
      • Japan
      • India
    • Europe
      • Germany
      • France
      • UK
    • South America
      • Brazil
      • Argentina
    • Middle East and Africa
      • Saudi Arabia
      • UAE
      • South Africa
    • Rest of World (ROW)

By Application Insights

The mobility sector segment is estimated to witness significant growth during the forecast period.

The mobility sector is undergoing a profound transformation, driven by the integration of intelligent sensing solutions into software-defined vehicles. This evolution prioritizes autonomous systems perception and advanced safety features, enabled by on-device AI processing and high-resolution sensor fusion.

The deployment of AI-native hardware in advanced driver-assistance systems (ADAS) is critical for achieving real-time path planning and reliable performance. Innovations in AI-driven thermal sensing and specialized AI microprocessors are enabling vehicles to interpret complex environments with high precision.

For instance, the use of deep learning models for sensors has improved object detection accuracy by over 40% in challenging weather conditions, establishing a new benchmark for industrial safety applications and autonomous navigation systems in the global AI sensor integration market 2026-2030.

Request Free Sample

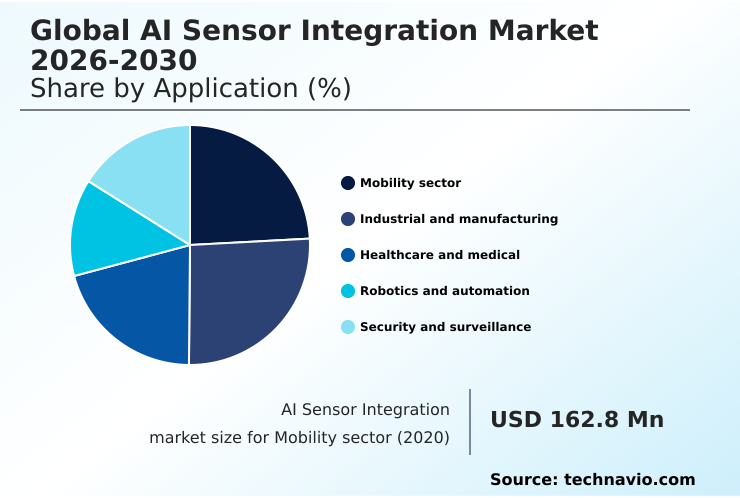
The Mobility sector segment was valued at USD 1.38 billion in 2024 and showed a gradual increase during the forecast period.

Request Free Sample

Regional Analysis

North America is estimated to contribute 36.1% to the growth of the global market during the forecast period.Technavio’s analysts have elaborately explained the regional trends and drivers that shape the market during the forecast period.

See How AI Sensor Integration Market Demand is Rising in North America Request Free Sample

The geographic landscape of the AI Sensor Integration market reflects distinct regional specializations.

North America leads in R&D and venture capital investment, contributing 36.1% of the market's incremental growth, with a strong focus on autonomous systems perception and AI-enhanced medical imaging.

The region's stringent regulatory compliance frameworks also drive innovation in explainable AI for sensors.

In contrast, APAC dominates global production, leveraging its vast electronics manufacturing base to embed low-power AI inference into consumer devices and industrial automation sensors, supporting a thriving smart factory ecosystem.

Europe distinguishes itself through its focus on Industry 4.0 integration and hardware-software harmonization, with an emphasis on lifecycle AI management and creating self-healing sensor networks that adhere to strict data privacy standards.

This global distribution fosters a competitive environment where regional strengths in technology, manufacturing, and regulation collectively advance the capabilities of intelligent sensing solutions.

Market Dynamics

Our researchers analyzed the data with 2025 as the base year, along with the key drivers, trends, and challenges. A holistic analysis of drivers will help companies refine their marketing strategies to gain a competitive advantage.

  • The AI Sensor Integration market is evolving through highly specific applications that deliver significant operational value. An AI sensor for predictive maintenance is becoming standard in industrial IoT, where real-time processing in AI sensors allows machinery to self-diagnose and prevent failures.
  • In mobility, edge AI in autonomous vehicles relies on LiDAR sensor fusion for robotics and other autonomous systems to navigate complex environments safely. This is complemented by on-chip AI for smart cameras, which enhances object detection and classification. For consumers, TinyML for wearable health devices is enabling continuous, low-power health monitoring.
  • The use of a digital twin for sensor autocalibration ensures long-term accuracy, while generative AI in sensor data synthesis helps train more robust models. Across industries, computer vision for quality control is achieving near-perfect inspection rates, a significant improvement over manual methods. AI-driven acoustic sensing applications are finding new uses in infrastructure monitoring.
  • As deployment scales, AI sensor integration cost analysis becomes crucial, alongside addressing AI sensor integration and data privacy. Key growth areas include AI sensor integration in smart cities and AI sensor integration for supply chains, where hardware acceleration for AI sensors is unlocking new efficiencies.
  • Furthermore, natural language processing for robotics and explainable AI in medical sensors are making systems more interactive and trustworthy, showcasing the broad impact of multimodal sensor data analysis.

What are the key market drivers leading to the rise in the adoption of AI Sensor Integration Industry?

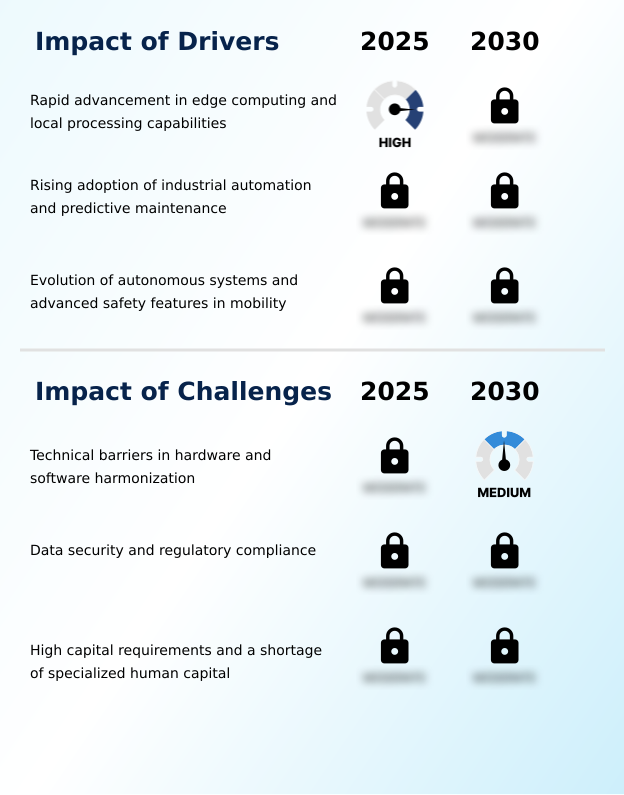
  • Rapid advancements in edge computing and local processing capabilities are a key driver for the market, enabling real-time data analysis at the sensor level.

  • The market's growth is fueled by fundamental shifts in computing and industrial strategy.
  • The primary driver is the advancement of edge computing capabilities, which enables local data processing and real-time responsiveness essential for autonomous navigation systems and industrial safety applications, reducing decision latency by over 50% versus cloud-dependent architectures.
  • A second major driver is the global adoption of Industry 4.0 integration, where AI-powered predictive maintenance systems are cutting unplanned downtime by as much as 60% in smart factory ecosystems.
  • The third driver is the pursuit of higher autonomy in software-defined vehicles, where the integration of advanced safety features has contributed to a 25% decrease in certain accident types, solidifying the importance of intelligent sensing solutions for enhancing safety and efficiency.

What are the market trends shaping the AI Sensor Integration Industry?

  • A defining market trend is the emergence of on-chip machine learning and TinyML architectures. This shift facilitates the migration of intelligence from the cloud to the extreme edge of sensor networks.

  • Key trends are reshaping the AI Sensor Integration market by embedding intelligence directly at the edge. The rise of TinyML architectures and on-chip machine learning is enabling always-on sensing capabilities in low-power devices, extending battery life in industrial IoT applications by up to 70%.
  • Another significant trend is multimodal sensor fusion, where unified software stacks process inputs from various sensors to create a comprehensive environmental understanding, improving fault detection accuracy by over 40% compared to single-sensor systems. Furthermore, the use of digital twin integration for autocalibration algorithms is creating self-healing sensor networks.
  • This approach, which facilitates predictive drift correction and lifecycle AI management, reduces manual calibration requirements by 90% and ensures sustained data integrity in critical systems, supporting new pay-per-use data models.

What challenges does the AI Sensor Integration Industry face during its growth?

  • Significant technical barriers in achieving hardware and software harmonization present a key challenge to industry growth and integration efficiency.

  • Despite strong growth, the AI Sensor Integration market faces significant operational hurdles. A primary challenge is hardware-software harmonization, where the lack of standardized interfaces between system-on-chip architectures and AI models can increase development cycles by up to 30%. This is compounded by the technical demands of creating effective thermal management systems for high-performance, low energy consumption SoCs.
  • Another critical challenge is navigating complex regulatory compliance frameworks and ensuring sensor data security, as the need for explainable AI for sensors adds another layer of design complexity.
  • Finally, the high capital investment and a shortage of professionals with interdisciplinary engineering skills create a barrier to entry, with the cost of deploying advanced sensor networks being 25% higher than traditional systems, limiting adoption for smaller enterprises.

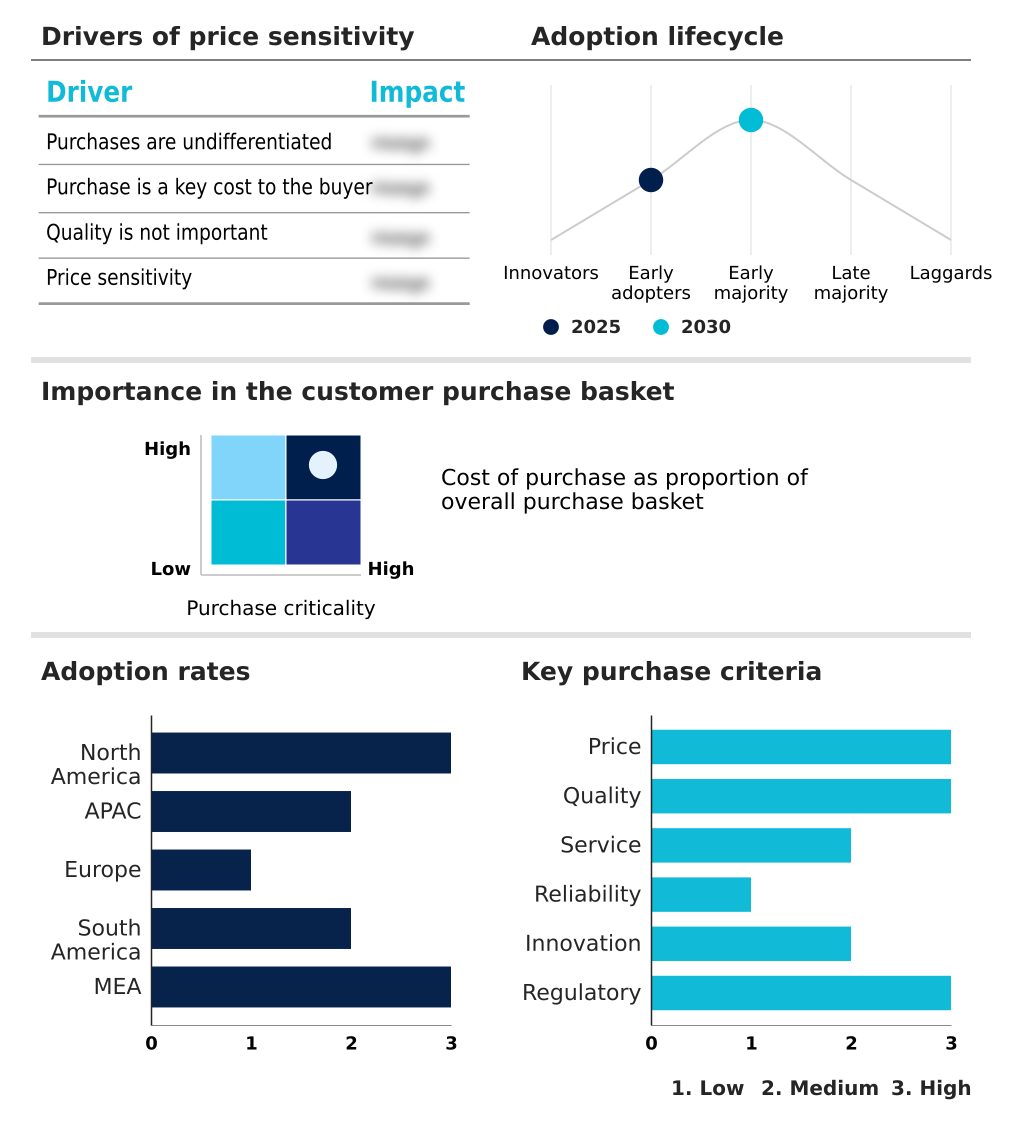
Exclusive Technavio Analysis on Customer Landscape

The ai sensor integration market forecasting report includes the adoption lifecycle of the market, covering from the innovator’s stage to the laggard’s stage. It focuses on adoption rates in different regions based on penetration. Furthermore, the ai sensor integration market report also includes key purchase criteria and drivers of price sensitivity to help companies evaluate and develop their market growth analysis strategies.

Customer Landscape of AI Sensor Integration Industry

Competitive Landscape

Companies are implementing various strategies, such as strategic alliances, ai sensor integration market forecast, partnerships, mergers and acquisitions, geographical expansion, and product/service launches, to enhance their presence in the industry.

ABB Ltd. - Offers intelligent sensing solutions for condition monitoring and AI-driven industrial automation, enhancing operational efficiency and predictive oversight.

The industry research and growth report includes detailed analyses of the competitive landscape of the market and information about key companies, including:

  • ABB Ltd.
  • ADLINK Technology Inc.
  • Advantech Co. Ltd.
  • Analog Devices Inc.
  • Basler AG
  • Honeywell International Inc.
  • Intel Corp.
  • Keyence Corp.
  • NVIDIA Corp.
  • NXP Semiconductors NV
  • OMRON Corp.
  • Qualcomm Inc.
  • Robert Bosch GmbH
  • Rockwell Automation Inc.
  • Schneider Electric SE
  • Siemens AG
  • Sony Semiconductor Solutions
  • Teledyne FLIR LLC
  • Teledyne Technologies Inc.
  • Zebra Technologies Corp.

Qualitative and quantitative analysis of companies has been conducted to help clients understand the wider business environment as well as the strengths and weaknesses of key industry players. Data is qualitatively analyzed to categorize companies as pure play, category-focused, industry-focused, and diversified; it is quantitatively analyzed to categorize companies as dominant, leading, strong, tentative, and weak.

Recent Development and News in Ai sensor integration market

  • In February, 2025, NXP Semiconductors NV introduced its latest series of high-performance microcontrollers engineered for edge-based AI sensing applications, enabling complex neural networks to run directly on the sensor node.
  • In March, 2025, Schneider Electric SE launched an innovative AI-driven thermal and acoustic sensing platform for critical electrical infrastructure, using integrated intelligence to monitor equipment health in real time.
  • In April, 2025, NVIDIA Corp. launched an update for its edge computing ecosystem that utilizes a localized large language model to interpret and reason across visual and acoustic sensor data for autonomous mobile robots.
  • In May, 2025, Qualcomm Inc. announced the commercial deployment of its next-generation Snapdragon Ride platform, which features highly integrated AI sensor processing units for real-time path planning and hazard detection.

Dive into Technavio’s robust research methodology, blending expert interviews, extensive data synthesis, and validated models for unparalleled AI Sensor Integration Market insights. See full methodology.

Market Scope
Page number 322
Base year 2025
Historic period 2020-2024
Forecast period 2026-2030
Growth momentum & CAGR Accelerate at a CAGR of 43.2%
Market growth 2026-2030 USD 30879.7 million
Market structure Fragmented
YoY growth 2025-2026(%) 30.4%
Key countries US, Canada, Mexico, China, Japan, India, South Korea, Australia, Singapore, Germany, France, UK, Italy, Spain, Sweden, Brazil, Chile, Argentina, Saudi Arabia, UAE, South Africa, Egypt and Israel
Competitive landscape Leading Companies, Market Positioning of Companies, Competitive Strategies, and Industry Risks

Request Free Sample

Research Analyst Overview

  • The AI Sensor Integration market is defined by the convergence of advanced hardware and sophisticated algorithms, creating a new class of intelligent devices. A core technological shift is the adoption of on-chip machine learning and specialized AI microprocessors, which enable real-time data interpretation and local data processing.
  • This is critical for applications demanding immediate action, such as autonomous systems perception and haptic feedback integration in robotics. Innovations in multimodal sensor fusion, powered by generative AI models and deep learning models for sensors, allow systems to synthesize data from multiple sources like 3D vision systems and LiDAR point cloud analysis.
  • This capability directly impacts boardroom strategy, as companies must decide whether to invest in developing AI-enhanced medical imaging or context-aware surveillance systems to gain a competitive edge. The use of autocalibration algorithms and predictive drift correction improves long-term reliability, while technologies like AI-driven thermal sensing and acoustic signature analysis enhance predictive maintenance systems.
  • For instance, firms deploying these technologies report a 35% reduction in false positives. The market is also shaped by the need for hardware-software harmonization, robust sensor data security, and adherence to regulatory compliance frameworks.

What are the Key Data Covered in this AI Sensor Integration Market Research and Growth Report?

  • What is the expected growth of the AI Sensor Integration Market between 2026 and 2030?

    • USD 30.88 billion, at a CAGR of 43.2%

  • What segmentation does the market report cover?

    • The report is segmented by Application (Mobility sector, Industrial and manufacturing, Healthcare and medical, Robotics and automation, and Security and surveillance), Technology (Machine learning, Computer vision, Deep learning, and Natural language processing), Type (Image sensors, Radar sensors, Ultrasonic sensors, and Lidar sensors) and Geography (North America, APAC, Europe, South America, Middle East and Africa)

  • Which regions are analyzed in the report?

    • North America, APAC, Europe, South America and Middle East and Africa

  • What are the key growth drivers and market challenges?

    • Rapid advancement in edge computing and local processing capabilities, Technical barriers in hardware and software harmonization

  • Who are the major players in the AI Sensor Integration Market?

    • ABB Ltd., ADLINK Technology Inc., Advantech Co. Ltd., Analog Devices Inc., Basler AG, Honeywell International Inc., Intel Corp., Keyence Corp., NVIDIA Corp., NXP Semiconductors NV, OMRON Corp., Qualcomm Inc., Robert Bosch GmbH, Rockwell Automation Inc., Schneider Electric SE, Siemens AG, Sony Semiconductor Solutions, Teledyne FLIR LLC, Teledyne Technologies Inc. and Zebra Technologies Corp.

Market Research Insights

  • The AI Sensor Integration market is defined by rapid advancements that deliver tangible business outcomes. The adoption of intelligent sensing solutions is enabling real-time responsiveness, with edge-based systems processing data up to 20 times faster than centralized models.
  • In mobility, the development of software-defined vehicles equipped with advanced driver-assistance systems (ADAS) has led to a 40% reduction in certain types of collisions. In manufacturing, Industry 4.0 integration with cognitive sensing systems facilitates automated quality control, improving defect detection rates by over 60%. These self-contained intelligent units not only enhance performance but also address data privacy at the edge.
  • The focus on creating self-healing sensor networks and AI-native hardware underscores a strategic pivot toward more autonomous, efficient, and secure operational frameworks across all major industries.

We can help! Our analysts can customize this ai sensor integration market research report to meet your requirements.

Get in touch

1. Executive Summary

1.1 Market overview

Executive Summary - Chart on Market Overview
Executive Summary - Data Table on Market Overview
Executive Summary - Chart on Global Market Characteristics
Executive Summary - Chart on Market by Geography
Executive Summary - Chart on Market Segmentation by Application
Executive Summary - Chart on Market Segmentation by Technology
Executive Summary - Chart on Market Segmentation by Type
Executive Summary - Chart on Incremental Growth
Executive Summary - Data Table on Incremental Growth
Executive Summary - Chart on Company Market Positioning

2. Technavio Analysis

2.1 Analysis of price sensitivity, lifecycle, customer purchase basket, adoption rates, and purchase criteria

2.2 Criticality of inputs and Factors of differentiation

Chart on Overview on criticality of inputs and factors of differentiation

2.3 Factors of disruption

Chart on Overview on factors of disruption

2.4 Impact of drivers and challenges

Chart on Impact of drivers and challenges in 2025 and 2030

3. Market Landscape

3.1 Market ecosystem

Chart on Parent Market
Data Table on - Parent Market

3.2 Market characteristics

Chart on Market characteristics analysis

3.3 Value chain analysis

Chart on Value chain analysis

4. Market Sizing

4.1 Market definition

Data Table on Offerings of companies included in the market definition

4.2 Market segment analysis

Market segments

4.3 Market size 2025

4.4 Market outlook: Forecast for 2025-2030

Chart on Global - Market size and forecast 2025-2030 ($ million)
Data Table on Global - Market size and forecast 2025-2030 ($ million)
Chart on Global Market: Year-over-year growth 2025-2030 (%)
Data Table on Global Market: Year-over-year growth 2025-2030 (%)

5. Historic Market Size

5.1 Global AI Sensor Integration Market 2020 - 2024

Historic Market Size - Data Table on Global AI Sensor Integration Market 2020 - 2024 ($ million)

5.2 Application segment analysis 2020 - 2024

Historic Market Size - Application Segment 2020 - 2024 ($ million)

5.3 Technology segment analysis 2020 - 2024

Historic Market Size - Technology Segment 2020 - 2024 ($ million)

5.4 Type segment analysis 2020 - 2024

Historic Market Size - Type Segment 2020 - 2024 ($ million)

5.5 Geography segment analysis 2020 - 2024

Historic Market Size - Geography Segment 2020 - 2024 ($ million)

5.6 Country segment analysis 2020 - 2024

Historic Market Size - Country Segment 2020 - 2024 ($ million)

6. Qualitative Analysis

6.1 Impact of geopolitical conflict on Global AI Sensor Integration Market

7. Five Forces Analysis

7.1 Five forces summary

Five forces analysis - Comparison between 2025 and 2030

7.2 Bargaining power of buyers

Bargaining power of buyers - Impact of key factors 2025 and 2030

7.3 Bargaining power of suppliers

Bargaining power of suppliers - Impact of key factors in 2025 and 2030

7.4 Threat of new entrants

Threat of new entrants - Impact of key factors in 2025 and 2030

7.5 Threat of substitutes

Threat of substitutes - Impact of key factors in 2025 and 2030

7.6 Threat of rivalry

Threat of rivalry - Impact of key factors in 2025 and 2030

7.7 Market condition

Chart on Market condition - Five forces 2025 and 2030

8. Market Segmentation by Application

8.1 Market segments

Chart on Application - Market share 2025-2030 (%)
Data Table on Application - Market share 2025-2030 (%)

8.2 Comparison by Application

Chart on Comparison by Application
Data Table on Comparison by Application

8.3 Mobility sector - Market size and forecast 2025-2030

Chart on Mobility sector - Market size and forecast 2025-2030 ($ million)
Data Table on Mobility sector - Market size and forecast 2025-2030 ($ million)
Chart on Mobility sector - Year-over-year growth 2025-2030 (%)
Data Table on Mobility sector - Year-over-year growth 2025-2030 (%)

8.4 Industrial and manufacturing - Market size and forecast 2025-2030

Chart on Industrial and manufacturing - Market size and forecast 2025-2030 ($ million)
Data Table on Industrial and manufacturing - Market size and forecast 2025-2030 ($ million)
Chart on Industrial and manufacturing - Year-over-year growth 2025-2030 (%)
Data Table on Industrial and manufacturing - Year-over-year growth 2025-2030 (%)

8.5 Healthcare and medical - Market size and forecast 2025-2030

Chart on Healthcare and medical - Market size and forecast 2025-2030 ($ million)
Data Table on Healthcare and medical - Market size and forecast 2025-2030 ($ million)
Chart on Healthcare and medical - Year-over-year growth 2025-2030 (%)
Data Table on Healthcare and medical - Year-over-year growth 2025-2030 (%)

8.6 Robotics and automation - Market size and forecast 2025-2030

Chart on Robotics and automation - Market size and forecast 2025-2030 ($ million)
Data Table on Robotics and automation - Market size and forecast 2025-2030 ($ million)
Chart on Robotics and automation - Year-over-year growth 2025-2030 (%)
Data Table on Robotics and automation - Year-over-year growth 2025-2030 (%)

8.7 Security and surveillance - Market size and forecast 2025-2030

Chart on Security and surveillance - Market size and forecast 2025-2030 ($ million)
Data Table on Security and surveillance - Market size and forecast 2025-2030 ($ million)
Chart on Security and surveillance - Year-over-year growth 2025-2030 (%)
Data Table on Security and surveillance - Year-over-year growth 2025-2030 (%)

8.8 Market opportunity by Application

Market opportunity by Application ($ million)
Data Table on Market opportunity by Application ($ million)

9. Market Segmentation by Technology

9.1 Market segments

Chart on Technology - Market share 2025-2030 (%)
Data Table on Technology - Market share 2025-2030 (%)

9.2 Comparison by Technology

Chart on Comparison by Technology
Data Table on Comparison by Technology

9.3 Machine learning - Market size and forecast 2025-2030

Chart on Machine learning - Market size and forecast 2025-2030 ($ million)
Data Table on Machine learning - Market size and forecast 2025-2030 ($ million)
Chart on Machine learning - Year-over-year growth 2025-2030 (%)
Data Table on Machine learning - Year-over-year growth 2025-2030 (%)

9.4 Computer vision - Market size and forecast 2025-2030

Chart on Computer vision - Market size and forecast 2025-2030 ($ million)
Data Table on Computer vision - Market size and forecast 2025-2030 ($ million)
Chart on Computer vision - Year-over-year growth 2025-2030 (%)
Data Table on Computer vision - Year-over-year growth 2025-2030 (%)

9.5 Deep learning - Market size and forecast 2025-2030

Chart on Deep learning - Market size and forecast 2025-2030 ($ million)
Data Table on Deep learning - Market size and forecast 2025-2030 ($ million)
Chart on Deep learning - Year-over-year growth 2025-2030 (%)
Data Table on Deep learning - Year-over-year growth 2025-2030 (%)

9.6 Natural language processing - Market size and forecast 2025-2030

Chart on Natural language processing - Market size and forecast 2025-2030 ($ million)
Data Table on Natural language processing - Market size and forecast 2025-2030 ($ million)
Chart on Natural language processing - Year-over-year growth 2025-2030 (%)
Data Table on Natural language processing - Year-over-year growth 2025-2030 (%)

9.7 Market opportunity by Technology

Market opportunity by Technology ($ million)
Data Table on Market opportunity by Technology ($ million)

10. Market Segmentation by Type

10.1 Market segments

Chart on Type - Market share 2025-2030 (%)
Data Table on Type - Market share 2025-2030 (%)

10.2 Comparison by Type

Chart on Comparison by Type
Data Table on Comparison by Type

10.3 Image sensors - Market size and forecast 2025-2030

Chart on Image sensors - Market size and forecast 2025-2030 ($ million)
Data Table on Image sensors - Market size and forecast 2025-2030 ($ million)
Chart on Image sensors - Year-over-year growth 2025-2030 (%)
Data Table on Image sensors - Year-over-year growth 2025-2030 (%)

10.4 Radar sensors - Market size and forecast 2025-2030

Chart on Radar sensors - Market size and forecast 2025-2030 ($ million)
Data Table on Radar sensors - Market size and forecast 2025-2030 ($ million)
Chart on Radar sensors - Year-over-year growth 2025-2030 (%)
Data Table on Radar sensors - Year-over-year growth 2025-2030 (%)

10.5 Ultrasonic sensors - Market size and forecast 2025-2030

Chart on Ultrasonic sensors - Market size and forecast 2025-2030 ($ million)
Data Table on Ultrasonic sensors - Market size and forecast 2025-2030 ($ million)
Chart on Ultrasonic sensors - Year-over-year growth 2025-2030 (%)
Data Table on Ultrasonic sensors - Year-over-year growth 2025-2030 (%)

10.6 Lidar sensors - Market size and forecast 2025-2030

Chart on Lidar sensors - Market size and forecast 2025-2030 ($ million)
Data Table on Lidar sensors - Market size and forecast 2025-2030 ($ million)
Chart on Lidar sensors - Year-over-year growth 2025-2030 (%)
Data Table on Lidar sensors - Year-over-year growth 2025-2030 (%)

10.7 Market opportunity by Type

Market opportunity by Type ($ million)
Data Table on Market opportunity by Type ($ million)

11. Customer Landscape

11.1 Customer landscape overview

Analysis of price sensitivity, lifecycle, customer purchase basket, adoption rates, and purchase criteria

12. Geographic Landscape

12.1 Geographic segmentation

Chart on Market share by geography 2025-2030 (%)
Data Table on Market share by geography 2025-2030 (%)

12.2 Geographic comparison

Chart on Geographic comparison
Data Table on Geographic comparison

12.3 North America - Market size and forecast 2025-2030

Chart on North America - Market size and forecast 2025-2030 ($ million)
Data Table on North America - Market size and forecast 2025-2030 ($ million)
Chart on North America - Year-over-year growth 2025-2030 (%)
Data Table on North America - Year-over-year growth 2025-2030 (%)
Chart on Regional Comparison - North America
Data Table on Regional Comparison - North America

12.3.1 US - Market size and forecast 2025-2030

Chart on US - Market size and forecast 2025-2030 ($ million)
Data Table on US - Market size and forecast 2025-2030 ($ million)
Chart on US - Year-over-year growth 2025-2030 (%)
Data Table on US - Year-over-year growth 2025-2030 (%)

12.3.2 Canada - Market size and forecast 2025-2030

Chart on Canada - Market size and forecast 2025-2030 ($ million)
Data Table on Canada - Market size and forecast 2025-2030 ($ million)
Chart on Canada - Year-over-year growth 2025-2030 (%)
Data Table on Canada - Year-over-year growth 2025-2030 (%)

12.3.3 Mexico - Market size and forecast 2025-2030

Chart on Mexico - Market size and forecast 2025-2030 ($ million)
Data Table on Mexico - Market size and forecast 2025-2030 ($ million)
Chart on Mexico - Year-over-year growth 2025-2030 (%)
Data Table on Mexico - Year-over-year growth 2025-2030 (%)

12.4 APAC - Market size and forecast 2025-2030

Chart on APAC - Market size and forecast 2025-2030 ($ million)
Data Table on APAC - Market size and forecast 2025-2030 ($ million)
Chart on APAC - Year-over-year growth 2025-2030 (%)
Data Table on APAC - Year-over-year growth 2025-2030 (%)
Chart on Regional Comparison - APAC
Data Table on Regional Comparison - APAC

12.4.1 China - Market size and forecast 2025-2030

Chart on China - Market size and forecast 2025-2030 ($ million)
Data Table on China - Market size and forecast 2025-2030 ($ million)
Chart on China - Year-over-year growth 2025-2030 (%)
Data Table on China - Year-over-year growth 2025-2030 (%)

12.4.2 Japan - Market size and forecast 2025-2030

Chart on Japan - Market size and forecast 2025-2030 ($ million)
Data Table on Japan - Market size and forecast 2025-2030 ($ million)
Chart on Japan - Year-over-year growth 2025-2030 (%)
Data Table on Japan - Year-over-year growth 2025-2030 (%)

12.4.3 India - Market size and forecast 2025-2030

Chart on India - Market size and forecast 2025-2030 ($ million)
Data Table on India - Market size and forecast 2025-2030 ($ million)
Chart on India - Year-over-year growth 2025-2030 (%)
Data Table on India - Year-over-year growth 2025-2030 (%)

12.4.4 South Korea - Market size and forecast 2025-2030

Chart on South Korea - Market size and forecast 2025-2030 ($ million)
Data Table on South Korea - Market size and forecast 2025-2030 ($ million)
Chart on South Korea - Year-over-year growth 2025-2030 (%)
Data Table on South Korea - Year-over-year growth 2025-2030 (%)

12.4.5 Australia - Market size and forecast 2025-2030

Chart on Australia - Market size and forecast 2025-2030 ($ million)
Data Table on Australia - Market size and forecast 2025-2030 ($ million)
Chart on Australia - Year-over-year growth 2025-2030 (%)
Data Table on Australia - Year-over-year growth 2025-2030 (%)

12.4.6 Singapore - Market size and forecast 2025-2030

Chart on Singapore - Market size and forecast 2025-2030 ($ million)
Data Table on Singapore - Market size and forecast 2025-2030 ($ million)
Chart on Singapore - Year-over-year growth 2025-2030 (%)
Data Table on Singapore - Year-over-year growth 2025-2030 (%)

12.5 Europe - Market size and forecast 2025-2030

Chart on Europe - Market size and forecast 2025-2030 ($ million)
Data Table on Europe - Market size and forecast 2025-2030 ($ million)
Chart on Europe - Year-over-year growth 2025-2030 (%)
Data Table on Europe - Year-over-year growth 2025-2030 (%)
Chart on Regional Comparison - Europe
Data Table on Regional Comparison - Europe

12.5.1 Germany - Market size and forecast 2025-2030

Chart on Germany - Market size and forecast 2025-2030 ($ million)
Data Table on Germany - Market size and forecast 2025-2030 ($ million)
Chart on Germany - Year-over-year growth 2025-2030 (%)
Data Table on Germany - Year-over-year growth 2025-2030 (%)

12.5.2 France - Market size and forecast 2025-2030

Chart on France - Market size and forecast 2025-2030 ($ million)
Data Table on France - Market size and forecast 2025-2030 ($ million)
Chart on France - Year-over-year growth 2025-2030 (%)
Data Table on France - Year-over-year growth 2025-2030 (%)

12.5.3 UK - Market size and forecast 2025-2030

Chart on UK - Market size and forecast 2025-2030 ($ million)
Data Table on UK - Market size and forecast 2025-2030 ($ million)
Chart on UK - Year-over-year growth 2025-2030 (%)
Data Table on UK - Year-over-year growth 2025-2030 (%)

12.5.4 Italy - Market size and forecast 2025-2030

Chart on Italy - Market size and forecast 2025-2030 ($ million)
Data Table on Italy - Market size and forecast 2025-2030 ($ million)
Chart on Italy - Year-over-year growth 2025-2030 (%)
Data Table on Italy - Year-over-year growth 2025-2030 (%)

12.5.5 Spain - Market size and forecast 2025-2030

Chart on Spain - Market size and forecast 2025-2030 ($ million)
Data Table on Spain - Market size and forecast 2025-2030 ($ million)
Chart on Spain - Year-over-year growth 2025-2030 (%)
Data Table on Spain - Year-over-year growth 2025-2030 (%)

12.5.6 Sweden - Market size and forecast 2025-2030

Chart on Sweden - Market size and forecast 2025-2030 ($ million)
Data Table on Sweden - Market size and forecast 2025-2030 ($ million)
Chart on Sweden - Year-over-year growth 2025-2030 (%)
Data Table on Sweden - Year-over-year growth 2025-2030 (%)

12.6 South America - Market size and forecast 2025-2030

Chart on South America - Market size and forecast 2025-2030 ($ million)
Data Table on South America - Market size and forecast 2025-2030 ($ million)
Chart on South America - Year-over-year growth 2025-2030 (%)
Data Table on South America - Year-over-year growth 2025-2030 (%)
Chart on Regional Comparison - South America
Data Table on Regional Comparison - South America

12.6.1 Brazil - Market size and forecast 2025-2030

Chart on Brazil - Market size and forecast 2025-2030 ($ million)
Data Table on Brazil - Market size and forecast 2025-2030 ($ million)
Chart on Brazil - Year-over-year growth 2025-2030 (%)
Data Table on Brazil - Year-over-year growth 2025-2030 (%)

12.6.2 Chile - Market size and forecast 2025-2030

Chart on Chile - Market size and forecast 2025-2030 ($ million)
Data Table on Chile - Market size and forecast 2025-2030 ($ million)
Chart on Chile - Year-over-year growth 2025-2030 (%)
Data Table on Chile - Year-over-year growth 2025-2030 (%)

12.6.3 Argentina - Market size and forecast 2025-2030

Chart on Argentina - Market size and forecast 2025-2030 ($ million)
Data Table on Argentina - Market size and forecast 2025-2030 ($ million)
Chart on Argentina - Year-over-year growth 2025-2030 (%)
Data Table on Argentina - Year-over-year growth 2025-2030 (%)

12.7 Middle East and Africa - Market size and forecast 2025-2030

Chart on Middle East and Africa - Market size and forecast 2025-2030 ($ million)
Data Table on Middle East and Africa - Market size and forecast 2025-2030 ($ million)
Chart on Middle East and Africa - Year-over-year growth 2025-2030 (%)
Data Table on Middle East and Africa - Year-over-year growth 2025-2030 (%)
Chart on Regional Comparison - Middle East and Africa
Data Table on Regional Comparison - Middle East and Africa

12.7.1 Saudi Arabia - Market size and forecast 2025-2030

Chart on Saudi Arabia - Market size and forecast 2025-2030 ($ million)
Data Table on Saudi Arabia - Market size and forecast 2025-2030 ($ million)
Chart on Saudi Arabia - Year-over-year growth 2025-2030 (%)
Data Table on Saudi Arabia - Year-over-year growth 2025-2030 (%)

12.7.2 UAE - Market size and forecast 2025-2030

Chart on UAE - Market size and forecast 2025-2030 ($ million)
Data Table on UAE - Market size and forecast 2025-2030 ($ million)
Chart on UAE - Year-over-year growth 2025-2030 (%)
Data Table on UAE - Year-over-year growth 2025-2030 (%)

12.7.3 South Africa - Market size and forecast 2025-2030

Chart on South Africa - Market size and forecast 2025-2030 ($ million)
Data Table on South Africa - Market size and forecast 2025-2030 ($ million)
Chart on South Africa - Year-over-year growth 2025-2030 (%)
Data Table on South Africa - Year-over-year growth 2025-2030 (%)

12.7.4 Egypt - Market size and forecast 2025-2030

Chart on Egypt - Market size and forecast 2025-2030 ($ million)
Data Table on Egypt - Market size and forecast 2025-2030 ($ million)
Chart on Egypt - Year-over-year growth 2025-2030 (%)
Data Table on Egypt - Year-over-year growth 2025-2030 (%)

12.7.5 Israel - Market size and forecast 2025-2030

Chart on Israel - Market size and forecast 2025-2030 ($ million)
Data Table on Israel - Market size and forecast 2025-2030 ($ million)
Chart on Israel - Year-over-year growth 2025-2030 (%)
Data Table on Israel - Year-over-year growth 2025-2030 (%)

12.8 Market opportunity by geography

Market opportunity by geography ($ million)
Data Tables on Market opportunity by geography ($ million)

13. Drivers, Challenges, and Opportunity

13.1 Market drivers

Rapid advancement in edge computing and local processing capabilities
Rising adoption of industrial automation and predictive maintenance
Evolution of autonomous systems and advanced safety features in mobility

13.2 Market challenges

Technical barriers in hardware and software harmonization
Data security and regulatory compliance
High capital requirements and a shortage of specialized human capital

13.3 Impact of drivers and challenges

Impact of drivers and challenges in 2025 and 2030

13.4 Market opportunities

Emergence of on-chip machine learning and tinyml architectures
Multimodal sensor fusion driven by generative AI and transformer models
Autocalibration and predictive drift correction via digital twin integration

14. Competitive Landscape

14.1 Overview

14.2

Overview on criticality of inputs and factors of differentiation

14.3 Landscape disruption

Overview on factors of disruption

14.4 Industry risks

Impact of key risks on business

15. Competitive Analysis

15.1 Companies profiled

Companies covered

15.2 Company ranking index

15.3 Market positioning of companies

Matrix on companies position and classification

15.4 ABB Ltd.

ABB Ltd. - Overview
ABB Ltd. - Business segments
ABB Ltd. - Key news
ABB Ltd. - Key offerings
ABB Ltd. - Segment focus
SWOT

15.5 Advantech Co. Ltd.

Advantech Co. Ltd. - Overview
Advantech Co. Ltd. - Business segments
Advantech Co. Ltd. - Key offerings
Advantech Co. Ltd. - Segment focus
SWOT

15.6 Analog Devices Inc.

Analog Devices Inc. - Overview
Analog Devices Inc. - Business segments
Analog Devices Inc. - Key offerings
Analog Devices Inc. - Segment focus
SWOT

15.7 Basler AG

Basler AG - Overview
Basler AG - Product / Service
Basler AG - Key offerings
SWOT

15.8 Honeywell International Inc.

Honeywell International Inc. - Overview
Honeywell International Inc. - Business segments
Honeywell International Inc. - Key news
Honeywell International Inc. - Key offerings
Honeywell International Inc. - Segment focus
SWOT

15.9 Intel Corp.

Intel Corp. - Overview
Intel Corp. - Business segments
Intel Corp. - Key news
Intel Corp. - Key offerings
Intel Corp. - Segment focus
SWOT

15.10 Keyence Corp.

Keyence Corp. - Overview
Keyence Corp. - Product / Service
Keyence Corp. - Key offerings
SWOT

15.11 NVIDIA Corp.

NVIDIA Corp. - Overview
NVIDIA Corp. - Business segments
NVIDIA Corp. - Key news
NVIDIA Corp. - Key offerings
NVIDIA Corp. - Segment focus
SWOT

15.12 NXP Semiconductors NV

NXP Semiconductors NV - Overview
NXP Semiconductors NV - Business segments
NXP Semiconductors NV - Key news
NXP Semiconductors NV - Key offerings
NXP Semiconductors NV - Segment focus
SWOT

15.13 OMRON Corp.

OMRON Corp. - Overview
OMRON Corp. - Business segments
OMRON Corp. - Key offerings
OMRON Corp. - Segment focus
SWOT

15.14 Qualcomm Inc.

Qualcomm Inc. - Overview
Qualcomm Inc. - Business segments
Qualcomm Inc. - Key news
Qualcomm Inc. - Key offerings
Qualcomm Inc. - Segment focus
SWOT

15.15 Robert Bosch GmbH

Robert Bosch GmbH - Overview
Robert Bosch GmbH - Product / Service
Robert Bosch GmbH - Key news
Robert Bosch GmbH - Key offerings
SWOT

15.16 Rockwell Automation Inc.

Rockwell Automation Inc. - Overview
Rockwell Automation Inc. - Business segments
Rockwell Automation Inc. - Key news
Rockwell Automation Inc. - Key offerings
Rockwell Automation Inc. - Segment focus
SWOT

15.17 Schneider Electric SE

Schneider Electric SE - Overview
Schneider Electric SE - Business segments
Schneider Electric SE - Key offerings
Schneider Electric SE - Segment focus
SWOT

15.18 Siemens AG

Siemens AG - Overview
Siemens AG - Business segments
Siemens AG - Key news
Siemens AG - Key offerings
Siemens AG - Segment focus
SWOT

16. Appendix

16.1 Scope of the report

Market definition
Objectives
Notes and caveats

16.2 Inclusions and exclusions checklist

Inclusions checklist
Exclusions checklist

16.3 Currency conversion rates for US$

16.4 Research methodology

16.5 Data procurement

Information sources

16.6 Data validation

16.7 Validation techniques employed for market sizing

16.8 Data synthesis

16.9 360 degree market analysis

16.10 List of abbreviations

Research Methodology

Technavio presents a detailed picture of the market by way of study, synthesis, and summation of data from multiple sources. The analysts have presented the various facets of the market with a particular focus on identifying the key industry influencers. The data thus presented is comprehensive, reliable, and the result of extensive research, both primary and secondary.

INFORMATION SOURCES

Primary sources

  • Manufacturers and suppliers
  • Channel partners
  • Industry experts
  • Strategic decision makers

Secondary sources

  • Industry journals and periodicals
  • Government data
  • Financial reports of key industry players
  • Historical data
  • Press releases

DATA ANALYSIS

Data Synthesis

  • Collation of data
  • Estimation of key figures
  • Analysis of derived insights

Data Validation

  • Triangulation with data models
  • Reference against proprietary databases
  • Corroboration with industry experts

REPORT WRITING

Qualitative

  • Market drivers
  • Market challenges
  • Market trends
  • Five forces analysis

Quantitative

  • Market size and forecast
  • Market segmentation
  • Geographical insights
  • Competitive landscape

Interested in this report?

Get your sample now to see our research methodology and insights!

Download Now

Frequently Asked Questions

AI Sensor Integration market growth will increase by USD 30879.7 million during 2026-2030.

The AI Sensor Integration market is expected to grow at a CAGR of 43.2% during 2026-2030.

AI Sensor Integration market is segmented by Application (Mobility sector, Industrial and manufacturing, Healthcare and medical, Robotics and automation, Security and surveillance) Technology (Machine learning, Computer vision, Deep learning, Natural language processing) Type (Image sensors, Radar sensors, Ultrasonic sensors, Lidar sensors)

ABB Ltd., ADLINK Technology Inc., Advantech Co. Ltd., Analog Devices Inc., Basler AG, Honeywell International Inc., Intel Corp., Keyence Corp., NVIDIA Corp., NXP Semiconductors NV, OMRON Corp., Qualcomm Inc., Robert Bosch GmbH, Rockwell Automation Inc., Schneider Electric SE, Siemens AG, Sony Semiconductor Solutions, Teledyne FLIR LLC, Teledyne Technologies Inc., Zebra Technologies Corp. are a few of the key vendors in the AI Sensor Integration market.

North America will register the highest growth rate of 36.1% among the other regions. Therefore, the AI Sensor Integration market in North America is expected to garner significant business opportunities for the vendors during the forecast period.

US, Canada, Mexico, China, Japan, India, South Korea, Australia, Singapore, Germany, France, UK, Italy, Spain, Sweden, Brazil, Chile, Argentina, Saudi Arabia, UAE, South Africa, Egypt, Israel

  • Rapid advancement in edge computing and local processing capabilities is the driving factor this market.

The AI Sensor Integration market vendors should focus on grabbing business opportunities from the Application segment as it accounted for the largest market share in the base year.
RIA - Research AI Assistant
Ask RIA