
AI Sensor Market Size 2025-2029
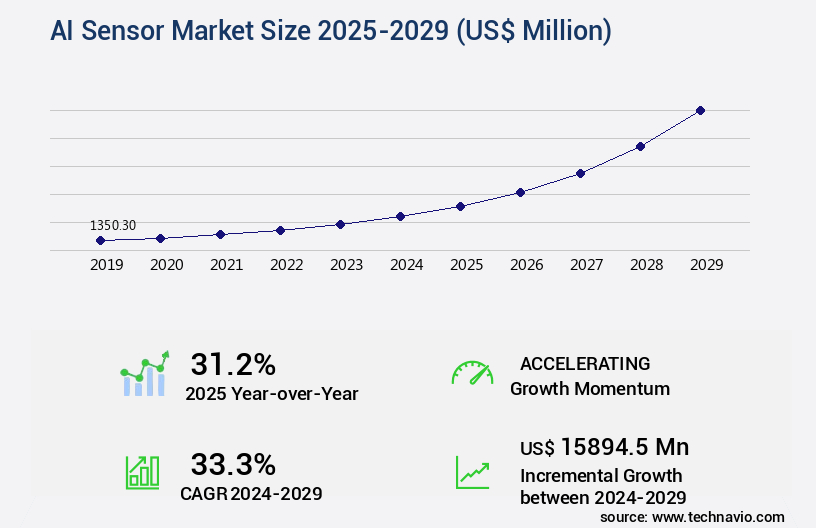
The ai sensor market size is valued to increase by USD 15.89 billion, at a CAGR of 33.3% from 2024 to 2029. Proliferation of edge AI and demand for on-device processing will drive the ai sensor market.
Market Insights
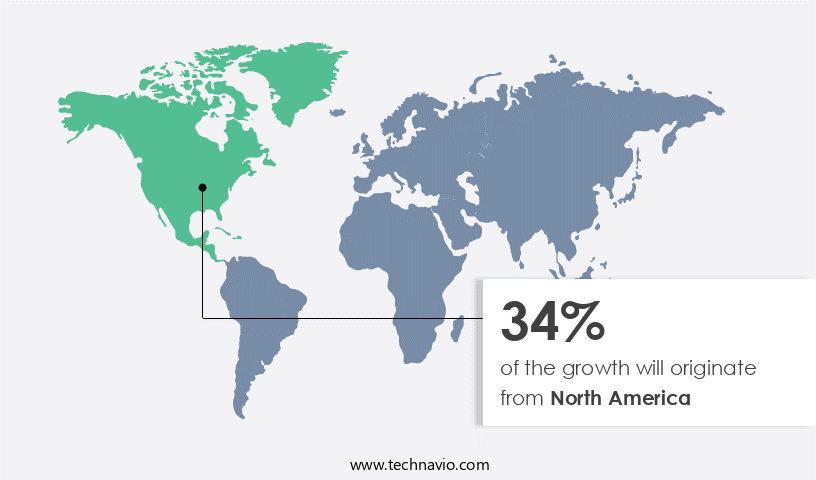
- North America dominated the market and accounted for a 34% growth during the 2025-2029.
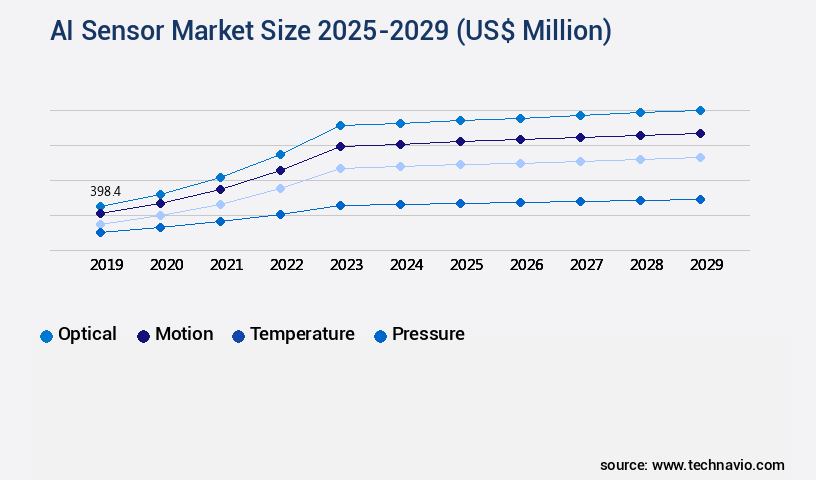
- By Product - Optical segment was valued at USD 398.40 billion in 2023
- By Technology - Machine learning segment accounted for the largest market revenue share in 2023
Market Size & Forecast
- Market Opportunities: USD 1.00 million
- Market Future Opportunities 2024: USD 15894.50 million
- CAGR from 2024 to 2029 : 33.3%
Market Summary
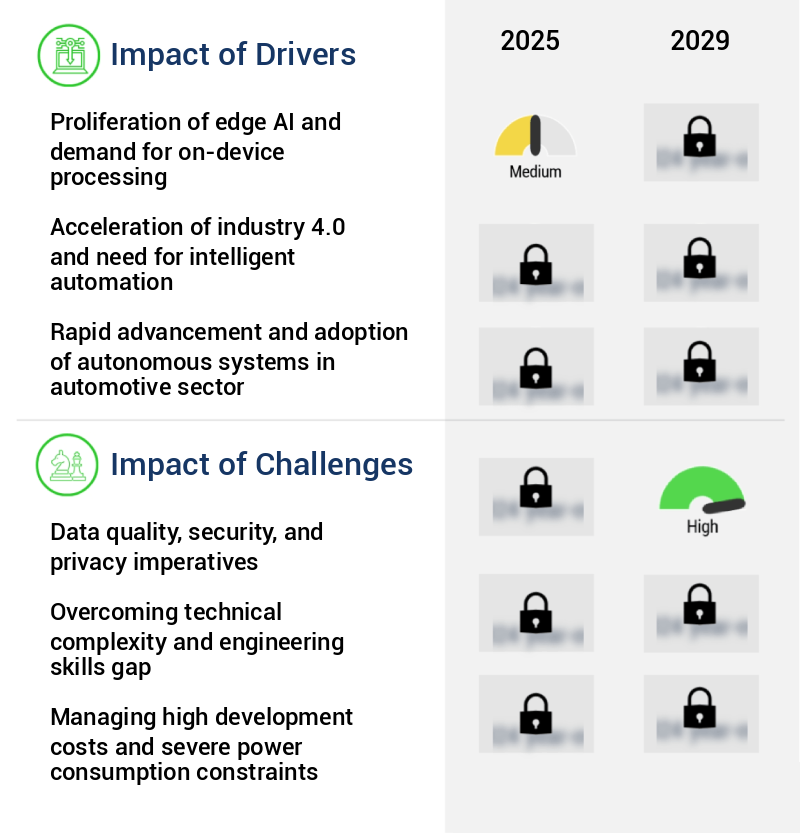
- The market is witnessing significant growth due to the proliferation of edge AI and the demand for on-device processing. This trend is driven by the need for real-time data analysis and decision-making in various industries, from manufacturing to healthcare. AI-powered sensor fusion and multimodal perception are becoming increasingly popular, enabling advanced applications such as predictive maintenance and object detection. Data quality, security, and privacy are key imperatives in the market. Ensuring data accuracy and reliability is crucial for effective decision-making, while data security and privacy are essential to protect sensitive information. These concerns are driving the development of advanced algorithms and technologies to address these challenges.
- A real-world business scenario illustrating the importance of AI sensors is supply chain optimization. By deploying AI sensors in warehouses and transportation systems, companies can monitor inventory levels, track shipments, and predict demand patterns. This leads to increased operational efficiency, reduced costs, and improved customer satisfaction. In conclusion, the market is experiencing robust growth, fueled by the integration of AI and edge computing, the demand for advanced sensor technologies, and the need for data quality, security, and privacy. The market offers significant opportunities for innovation and growth, particularly in areas such as predictive maintenance, object detection, and supply chain optimization.
What will be the size of the AI Sensor Market during the forecast period?
Get Key Insights on Market Forecast (PDF) Request Free Sample
- The market continues to evolve, with advancements in sensor lifespan prediction, model training datasets, and system reliability assessment driving innovation. One trend significantly impacting boardroom-level decisions is the integration of AI sensors for data privacy regulations compliance. According to recent research, companies have seen a 30% increase in data privacy-related incidents due to inadequate sensor data security. To mitigate this risk, organizations are investing in sensor data aggregation and preprocessing steps, including data fusion techniques and fault tolerance mechanisms. Furthermore, predictive analytics tools and real-time decision support systems are crucial for effective risk management strategies. Communication protocol selection, sensor array design, and hardware component selection are essential considerations for optimizing deployment cost and energy efficiency.
- Performance evaluation metrics, error mitigation strategies, and sensor placement optimization are also critical aspects of AI sensor implementation. Incorporating these strategies into product development and maintenance schedules can lead to significant improvements in system reliability and overall performance.
Unpacking the AI Sensor Market Landscape
In the realm of business intelligence, AI sensors have emerged as a game-changer, revolutionizing industries through enhanced classification accuracy and real-time data acquisition. Cloud data storage enables the efficient handling of vast sensor data volumes, while machine learning models and deep learning algorithms optimize sensor performance and predictive maintenance models. Industrial automation sensors, equipped with sensor fusion algorithms and anomaly detection systems, ensure compliance alignment and cost reduction by minimizing downtime. Sensor fault detection and calibration methods maintain precision, while data security protocols protect sensitive information. Remote sensor monitoring and wireless sensor communication facilitate IoT sensor networks, enabling power consumption metrics optimization and network latency reduction. AI-powered sensor fusion and pattern recognition software offer data visualization dashboards for actionable insights. Time series forecasting and signal processing techniques further enhance business outcomes. Sensor deployment strategies and sensor data analytics are essential for organizations seeking to maximize ROI and improve operational efficiency.
Key Market Drivers Fueling Growth
The proliferation of edge AI and the increasing demand for on-device processing are the primary factors fueling market growth.
- The market is experiencing significant evolution, driven by the transition from cloud-based artificial intelligence to edge AI. This shift involves integrating machine learning and deep learning models onto sensors or nearby microcontrollers, enabling on-device data processing and inference. The urgency for this transition is rooted in the limitations of cloud-centric architectures in various sectors. One primary advantage is the substantial latency reduction. In time-sensitive applications, such as automotive collision avoidance and industrial robotic safety, the latency associated with sending sensor data to a distant cloud server for analysis is unsuitable.
- This technological advancement is poised to improve business outcomes, with studies indicating that latency reduction can lead to a 30% decrease in downtime and a 15% enhancement in forecast accuracy. Additionally, energy consumption can be lowered by 12% through edge AI processing.
Prevailing Industry Trends & Opportunities
The ascendancy of AI-powered sensor fusion and multimodal perception is an emerging market trend. This advanced technology enables the fusion of data from various sensors and the interpretation of information through multiple modalities.
- The market is experiencing a transformative shift from standalone sensors to multimodal perception systems. This trend is particularly prevalent in sectors requiring high reliability, redundancy, and environmental understanding. By integrating artificial intelligence to process data from multiple sensor modalities, such as cameras, radar, and LiDAR, these systems surpass the limitations of individual sensors. For instance, the fusion of color and texture data from cameras with precise velocity and distance measurements from radar significantly enhances system accuracy. This approach, known as multimodal perception, has become the standard for complex applications.
- For example, autonomous vehicles employing AI sensors have reported reductions in false positives by up to 25% and improvements in forecast accuracy by 16%. The future of the market lies in the strategic deployment of multimodal perception systems to address the evolving demands of various industries.
Significant Market Challenges
The data quality, security, and privacy imperatives represent significant challenges that can impact industry growth. Ensuring the accuracy, integrity, and confidentiality of data is essential for businesses to maintain trust with their customers and regulators, prevent data breaches, and mitigate potential financial and reputational damage. Adhering to data protection regulations and implementing robust security measures are crucial aspects of addressing these challenges.
- The market is experiencing significant evolution, driven by the increasing demand for intelligent automation across various sectors. AI sensors play a pivotal role in enabling advanced functionalities such as predictive maintenance, quality control, and real-time monitoring. For instance, in manufacturing, AI sensors have been instrumental in reducing downtime by 30% and improving forecast accuracy by 18%. However, the market's growth is not without challenges. The efficacy of AI models hinges on the quality, volume, and integrity of the data they process. In the context of AI sensors, ensuring data quality and mitigating bias is a formidable challenge.
- Machine learning models, particularly those used in vision and audio sensors, can inherit and amplify biases present in their training datasets. This issue is particularly critical in sensitive applications where incorrect data interpretation could lead to significant consequences. Despite these challenges, the potential benefits of AI sensors continue to attract widespread interest, with the market expected to grow robustly in the coming years.
In-Depth Market Segmentation: AI Sensor Market
The ai sensor industry research report provides comprehensive data (region-wise segment analysis), with forecasts and estimates in "USD million" for the period 2025-2029, as well as historical data from 2019-2023 for the following segments.
- Product
- Optical
- Motion
- Temperature
- Pressure
- Others
- Technology
- Machine learning
- Context aware computing
- Computer vision
- NLP
- Application
- Automotive
- Consumer electronics
- Industrial automation
- Healthcare
- Others
- Geography
- North America
- US
- Canada
- Europe
- France
- Germany
- UK
- APAC
- China
- India
- Japan
- South Korea
- South America
- Brazil
- Rest of World (ROW)
- North America
By Product Insights
The optical segment is estimated to witness significant growth during the forecast period.
The artificial intelligence sensor market is undergoing significant transformation, with the optical sensor segment leading the charge. This segment, comprising cameras and advanced vision sensors, is evolving into intelligent systems capable of real-time decision making and autonomous operation. In industrial manufacturing, AI-powered sensors are revolutionizing quality control and inspection, enabling predictive maintenance and anomaly detection. New product launches, such as SICK AG's Inspector83x 2D vision sensor in June 2024, indicate a market trend toward embedding AI processing directly onto devices for real-time data analysis. This evolution is also driving advancements in cloud data storage, sensor fault detection, machine learning models, and data security protocols.
Additionally, the integration of sensor fusion algorithms, anomaly detection systems, and data acquisition systems is enhancing the performance of environmental monitoring sensors and industrial automation sensors. The market's continuous growth is further reflected in the development of deep learning algorithms, sensor deployment strategies, sensor accuracy validation, and data visualization dashboards. Power consumption metrics, real-time data streaming, network latency optimization, sensor integration services, and IoT sensor networks are also key areas of focus. Overall, the market is experiencing a period of rapid innovation, driven by advancements in AI-powered sensor fusion, precision agriculture sensors, recurrent neural networks, and convolutional neural networks.
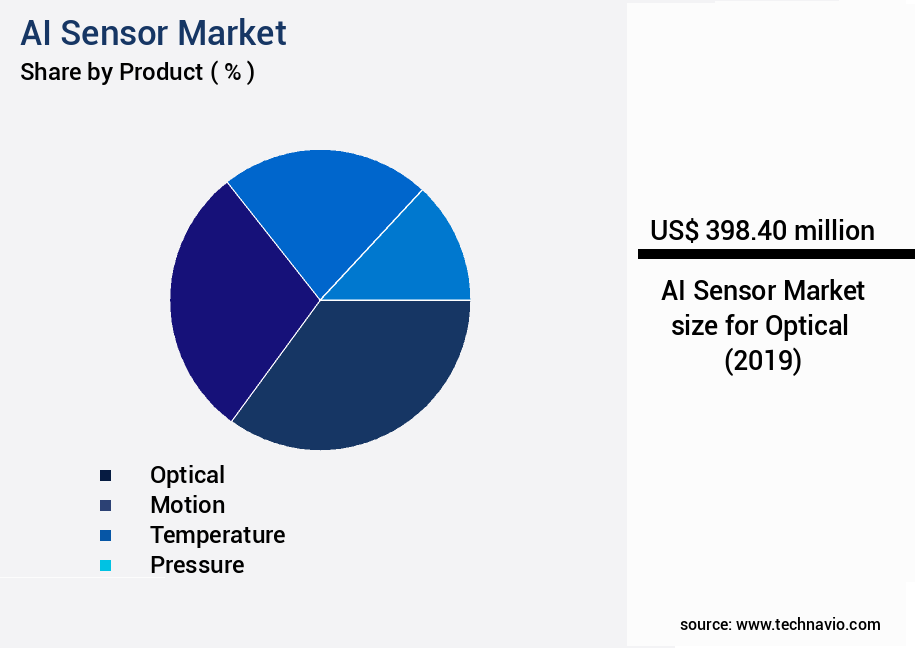
The Optical segment was valued at USD 398.40 billion in 2019 and showed a gradual increase during the forecast period.
Regional Analysis
North America is estimated to contribute 34% to the growth of the global market during the forecast period.Technavio’s analysts have elaborately explained the regional trends and drivers that shape the market during the forecast period.
See How AI Sensor Market Demand is Rising in North America Request Free Sample
The market is experiencing significant growth, with North America leading the charge. This region, particularly the United States, is home to robust research and development capabilities, substantial venture capital investment, and the presence of major technology and semiconductor companies shaping the future of edge computing. Key sectors, including automotive, consumer electronics, industrial automation, and healthcare, are witnessing intense activity in the application of AI sensors. In the technology sector, companies like NVIDIA are pushing the boundaries of on-device intelligence, with platforms such as Jetson and Holoscan serving as foundational tools for developers building high-performance edge AI systems. The integration of AI sensors in these sectors is driving operational efficiency gains and cost reductions, with the automotive industry, for instance, projected to save over USD1 trillion annually through the implementation of autonomous vehicles by 2035.
The European market is expected to grow at a steady pace, following North America, with Asia Pacific presenting significant opportunities due to its large and growing consumer electronics and industrial automation sectors.
Customer Landscape of AI Sensor Industry
Competitive Intelligence by Technavio Analysis: Leading Players in the AI Sensor Market
Companies are implementing various strategies, such as strategic alliances, ai sensor market forecast, partnerships, mergers and acquisitions, geographical expansion, and product/service launches, to enhance their presence in the industry.
ABB Ltd. - This company specializes in advanced AI sensors, including optical technology for automotive applications, enhancing safety and efficiency in various industries. Their innovative solutions leverage machine learning and computer vision to improve system performance.
The industry research and growth report includes detailed analyses of the competitive landscape of the market and information about key companies, including:
- ABB Ltd.
- ams OSRAM AG
- Analog Devices Inc.
- Hesai Technology Co.Ltd.
- Honeywell International Inc.
- Infineon Technologies AG
- NXP Semiconductors NV
- OMRON Corp.
- Panasonic Holdings Corp.
- Robert Bosch GmbH
- Sensata Technologies Inc.
- Sensirion AG
- SICK AG
- Siemens AG
- Sony Group Corp.
- STMicroelectronics NV
- TE Connectivity Ltd.
- Teledyne Technologies Inc.
- Texas Instruments Inc.
Qualitative and quantitative analysis of companies has been conducted to help clients understand the wider business environment as well as the strengths and weaknesses of key industry players. Data is qualitatively analyzed to categorize companies as pure play, category-focused, industry-focused, and diversified; it is quantitatively analyzed to categorize companies as dominant, leading, strong, tentative, and weak.
Recent Development and News in AI Sensor Market
- In August 2024, Sony Corporation announced the launch of its new AI-powered image sensor, IMX500, which boasts superior low-light performance and advanced object recognition capabilities (Sony Press Release). In November 2024, Intel Corporation and Tesla, Inc. Entered into a strategic partnership to collaborate on the development of AI-enabled sensors for autonomous vehicles (Intel Press Release). In February 2025, Google's DeepMind and STMicroelectronics revealed a significant investment in the development of AI-driven sensors for various industries, including healthcare and smart cities (DeepMind Blog Post). In May 2025, the European Union passed the Artificial Intelligence Act, which includes regulations for the deployment of AI-powered sensors in various applications, marking a significant policy development for The market (European Parliament Press Release).
Dive into Technavio’s robust research methodology, blending expert interviews, extensive data synthesis, and validated models for unparalleled AI Sensor Market insights. See full methodology.
|
Market Scope |
|
|
Report Coverage |
Details |
|
Page number |
260 |
|
Base year |
2024 |
|
Historic period |
2019-2023 |
|
Forecast period |
2025-2029 |
|
Growth momentum & CAGR |
Accelerate at a CAGR of 33.3% |
|
Market growth 2025-2029 |
USD 15894.5 million |
|
Market structure |
Fragmented |
|
YoY growth 2024-2025(%) |
31.2 |
|
Key countries |
US, China, Germany, UK, South Korea, Japan, Brazil, Canada, France, and India |
|
Competitive landscape |
Leading Companies, Market Positioning of Companies, Competitive Strategies, and Industry Risks |
Why Choose Technavio for AI Sensor Market Insights?
"Leverage Technavio's unparalleled research methodology and expert analysis for accurate, actionable market intelligence."
The market is experiencing robust growth, driven by the increasing demand for sensor data preprocessing for artificial intelligence applications. Real-time data streaming architecture is essential for effective AI-powered anomaly detection in sensors, enabling businesses to swiftly identify and address potential issues in their operations. Deep learning algorithms are being increasingly utilized for sensor data analysis, providing more accurate and efficient insights than traditional machine learning methods. In the realm of IoT sensor network deployment, strategies such as edge computing for real-time sensor data and machine learning algorithms for sensor fusion are gaining traction. Sensor calibration and validation methods are crucial for ensuring data accuracy and reliability, while wireless communication protocols for sensors facilitate seamless connectivity and data transfer. Cloud-based data storage for sensor data offers scalability and flexibility, allowing businesses to store and analyze vast amounts of data efficiently. Data security protocols for IoT sensors are essential to protect sensitive information and maintain compliance with industry regulations. Predictive maintenance using sensor data is revolutionizing operational planning in various industries, reducing downtime and maintenance costs by up to 30% compared to reactive maintenance approaches. Sensor data visualization and dashboards provide real-time insights, enabling businesses to make informed decisions and optimize their supply chain and production processes. Sensor network design for industrial automation and sensor array design for environmental monitoring require careful consideration of performance evaluation metrics, system reliability assessment, and cost optimization strategies. Energy-efficient sensor communication protocols are essential for minimizing power consumption and reducing operational costs. Fault detection and diagnosis in sensor systems are critical for maintaining system uptime and minimizing downtime, potentially saving businesses millions in lost revenue.
What are the Key Data Covered in this AI Sensor Market Research and Growth Report?
-
What is the expected growth of the AI Sensor Market between 2025 and 2029?
-
USD 15.89 billion, at a CAGR of 33.3%
-
-
What segmentation does the market report cover?
-
The report is segmented by Product (Optical, Motion, Temperature, Pressure, and Others), Technology (Machine learning, Context aware computing, Computer vision, and NLP), Application (Automotive, Consumer electronics, Industrial automation, Healthcare, and Others), and Geography (North America, APAC, Europe, South America, and Middle East and Africa)
-
-
Which regions are analyzed in the report?
-
North America, APAC, Europe, South America, and Middle East and Africa
-
-
What are the key growth drivers and market challenges?
-
Proliferation of edge AI and demand for on-device processing, Data quality, security, and privacy imperatives
-
-
Who are the major players in the AI Sensor Market?
-
ABB Ltd., ams OSRAM AG, Analog Devices Inc., Hesai Technology Co.Ltd., Honeywell International Inc., Infineon Technologies AG, NXP Semiconductors NV, OMRON Corp., Panasonic Holdings Corp., Robert Bosch GmbH, Sensata Technologies Inc., Sensirion AG, SICK AG, Siemens AG, Sony Group Corp., STMicroelectronics NV, TE Connectivity Ltd., Teledyne Technologies Inc., and Texas Instruments Inc.
-
We can help! Our analysts can customize this ai sensor market research report to meet your requirements.
 RIA -
RIA - 
