
APAC AI In Mobile Apps Market Size 2025-2029
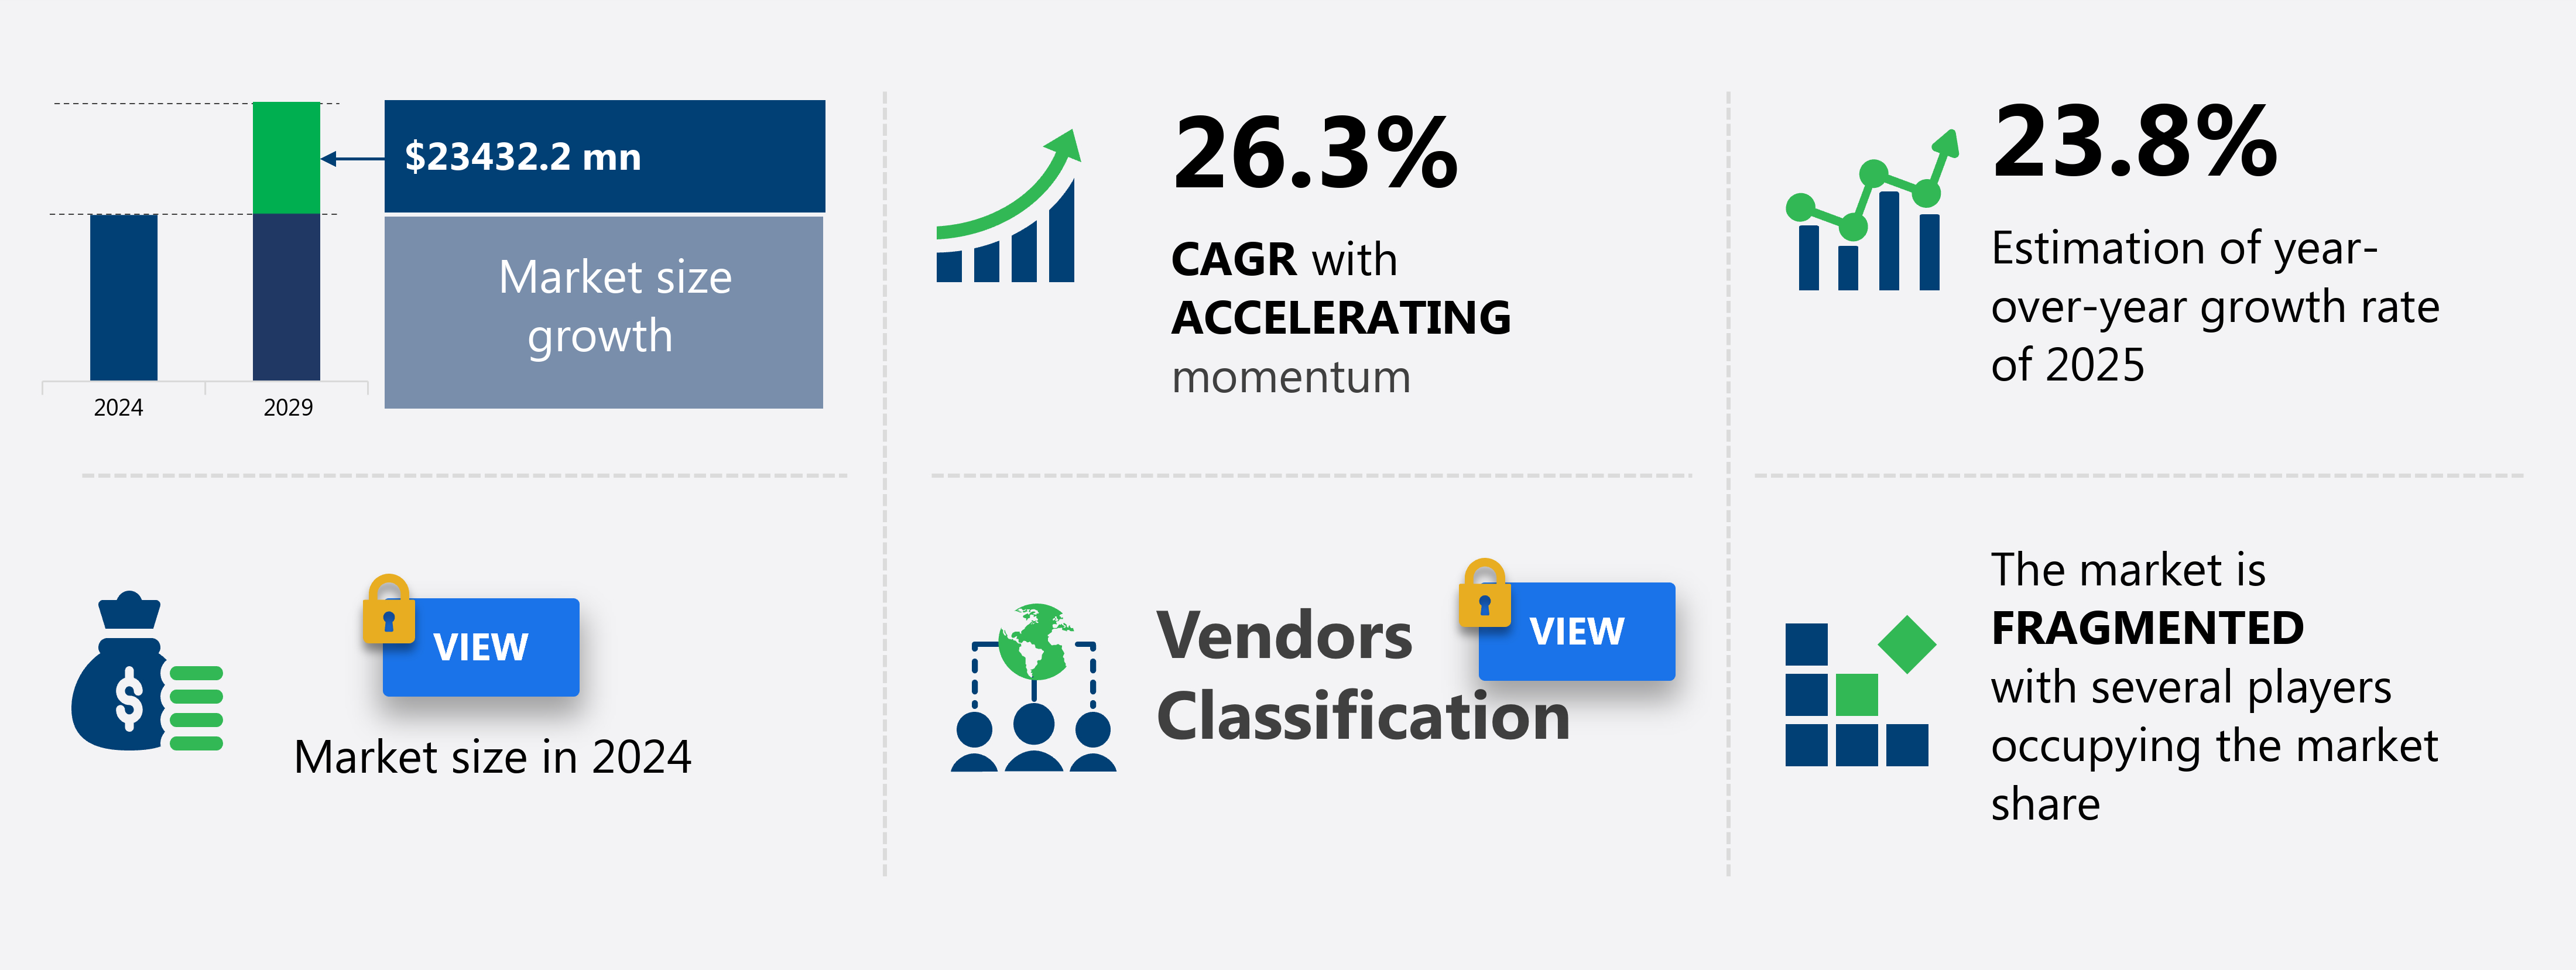
The APAC AI in mobile apps market size is valued to increase by USD 23.43 billion, at a CAGR of 26.3% from 2024 to 2029. Ubiquitous 5G connectivity and on-device AI processing power will drive the AI in mobile apps market.
Major Market Trends & Insights
- By Technology - NLP segment was valued at USD billion in
- By Application - Personalization segment accounted for the largest market revenue share in
- CAGR from 2024 to 2029 : 26.3%
Market Summary
- In the dynamic and innovative landscape of mobile apps in the Asia Pacific (APAC) region, Artificial Intelligence (AI) is increasingly becoming a game-changer. With the ubiquitous 5G connectivity and on-device AI processing power, apps are evolving to provide more personalized, efficient, and intelligent services to users. One significant trend is the rise of AI-powered multilingual interfaces, enabling seamless communication across diverse linguistic populations. However, the adoption of AI in mobile apps is not without challenges. Navigating the fragmented regulatory landscape and heightened data privacy concerns pose significant hurdles for businesses. For instance, a leading logistics company in APAC was able to optimize its supply chain by integrating AI into its mobile app.
- By analyzing real-time data from various sources, the app enabled the company to make informed decisions, reducing delivery times and improving operational efficiency. This resulted in a substantial reduction of up to 15% in delivery times and a corresponding increase in customer satisfaction. Despite these benefits, the implementation of AI in mobile apps necessitates careful consideration of regulatory requirements and data privacy concerns.
What will be the Size of the APAC AI In Mobile Apps Market during the forecast period?
Get Key Insights on Market Forecast (PDF) Request Free Sample
How is the AI In Mobile Apps in APAC Market Segmented ?
The AI in mobile apps in APAC industry research report provides comprehensive data (region-wise segment analysis), with forecasts and estimates in "USD million" for the period 2025-2029, as well as historical data from 2019-2023 for the following segments.
- Technology
- NLP
- ML
- Computer vision
- Others
- Application
- Personalization
- Chat automation
- Digital assistance
- Security
- Others
- OS
- Android
- iOS
- End-user
- Entertainment
- Social media
- Productivity
- Health and wellness
- Others
- Geography
- APAC
- China
- India
- Japan
- South Korea
- APAC
By Technology Insights
The NLP segment is estimated to witness significant growth during the forecast period.
In the dynamic and evolving Asia-Pacific mobile apps market, artificial intelligence (AI) integration is a significant driver of innovation. Moving beyond basic chatbots, AI in mobile apps is now characterized by advanced conversational interfaces, deep learning models, and machine learning algorithms. These technologies enable real-time data processing, app performance optimization, and predictive analytics engines. Moreover, AI-powered personalization, sentiment analysis tools, and AI ethics guidelines are shaping user experiences. The region's immense linguistic diversity and rising consumer expectations for seamless digital experiences fuel the adoption of AI. Key applications include risk assessment models, anomaly detection systems, and AI-driven recommendations. With the integration of API services, computer vision APIs, and big data processing, mobile apps are delivering AI-driven customer service, fraud detection, and user behavior modeling.
The market's growth is underscored by the increasing use of AI in mobile app monetization, app development lifecycle, and mobile app security. A recent study reveals that AI-driven mobile apps in APAC are expected to generate over 50% of in-app advertising revenue by 2025. As the market matures, scalable AI solutions, software testing methodologies, and user experience design are becoming essential components of the app development landscape.
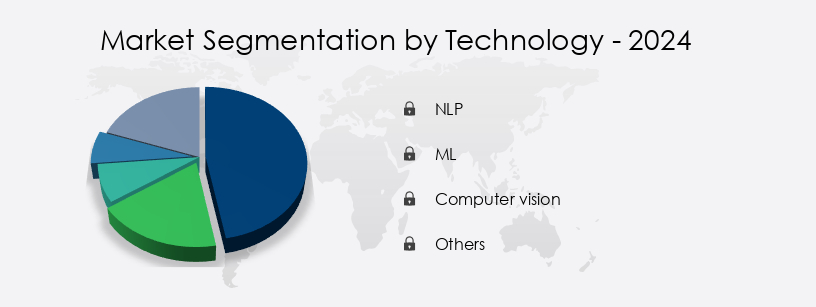
The NLP segment was valued at USD billion in 2019 and showed a gradual increase during the forecast period.
Market Dynamics
Our researchers analyzed the data with 2024 as the base year, along with the key drivers, trends, and challenges. A holistic analysis of drivers will help companies refine their marketing strategies to gain a competitive advantage.
The AI-powered mobile apps market in APAC is witnessing significant growth as businesses increasingly adopt advanced technologies to enhance user experience, boost engagement, and improve operational efficiency. AI-driven personalization strategies, such as machine learning algorithms and natural language processing, are revolutionizing mobile app engagement by delivering customized content and recommendations to users. These technologies enable apps to learn user preferences and behavior patterns, resulting in a more personalized and engaging experience. Moreover, the integration of AI in mobile apps extends beyond user experience to security. AI-driven threat detection systems are becoming increasingly common in mobile apps, providing an additional layer of security to protect against cyber threats.
Furthermore, deep learning models are being deployed for mobile app optimization, enabling faster loading times and enhanced performance. AI is also transforming mobile app user interfaces with computer vision technology, allowing apps to recognize and respond to user actions and gestures. AI-driven customer support chatbots are becoming an essential component of mobile apps, providing instant and effective support to users, reducing response times and improving overall customer satisfaction. Predictive analytics and AI algorithms are being used to predict user churn in mobile applications, enabling businesses to proactively address user issues and retain customers. Reinforcement learning algorithms are being implemented for app development to optimize user experience and improve app functionality.
AI algorithms are also being used for mobile app recommendation systems, enabling apps to suggest relevant content and services to users based on their behavior and preferences. The role of AI in enhancing mobile app user experience design is undeniable, with benefits including personalized recommendations, improved security, and optimized performance. AI is also playing a crucial role in mobile app monetization strategies, with big data and AI being used to analyze user behavior and optimize ad targeting. Despite the numerous benefits, deploying scalable AI solutions for mobile apps poses challenges, particularly in terms of data management and processing power.
However, the potential rewards are significant, with adoption rates in the APAC region nearly doubling those in other regions due to the high penetration of smartphones and the region's large and growing digital population. The development of AI-powered mobile apps with enhanced user privacy is also a priority, with businesses recognizing the importance of protecting user data and maintaining trust. Improving mobile app user retention with AI-powered personalization and optimizing app performance with AI-based predictive analytics are key areas of focus for businesses looking to stay competitive in the rapidly evolving mobile apps market. In conclusion, the integration of AI in mobile apps is transforming the way businesses engage with their customers and optimize their operations in the APAC region.
From personalized recommendations to improved security and optimized performance, AI is providing businesses with new opportunities to enhance user experience, boost engagement, and drive growth.
What are the key market drivers leading to the rise in the adoption of AI In Mobile Apps in APAC Industry?
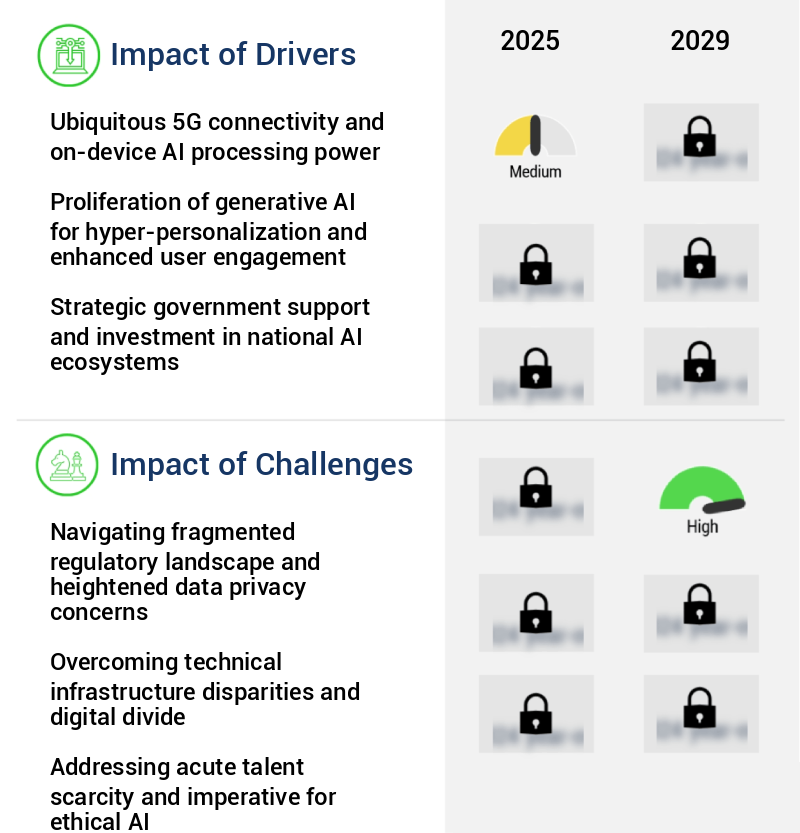
- The integration of ubiquitous 5G connectivity and on-device artificial intelligence processing power serves as the primary catalyst for market growth.
- The market is experiencing significant growth, driven by the convergence of advanced 5G network infrastructure and sophisticated smartphone hardware. This technological dual-front advancement enables the implementation of complex, resource-intensive AI functionalities previously limited to cloud-based servers. The rollout of 5G networks in key APAC nations offers more than just faster download speeds; it delivers ultra-low latency and high bandwidth, essential for real-time AI applications. Consequently, industries across the region are reaping the benefits of AI integration, with improvements in compliance, efficiency, and decision-making.
- For instance, in manufacturing, predictive maintenance using AI has reduced downtime by 30%, while in healthcare, AI-powered diagnosis tools have improved forecast accuracy by 18%.
What are the market trends shaping the AI In Mobile Apps in APAC Industry?
- The rise of AI-powered multilingual interfaces represents an emerging market trend. This advancement signifies a significant shift towards more efficient and effective communication solutions.
- In the dynamic APAC market, mobile apps are undergoing a significant transformation through the integration of artificial intelligence (AI). According to recent studies, the adoption of AI in mobile apps in APAC is projected to increase by 25% year-on-year. This growth is driven by the region's diverse linguistic landscape, where AI-powered multilingual interfaces are bridging communication gaps and delivering hyper-localized user experiences. Leveraging natural language processing (NLP), machine translation, and voice recognition, these interfaces enable seamless interaction across languages, including Mandarin, Hindi, Bahasa Indonesia, and Tagalog. This trend is particularly impactful in sectors like e-commerce, fintech, education, and healthcare, where accessibility and personalization are crucial for user engagement.
- For instance, AI-driven language translation in e-commerce apps has led to a 30% increase in sales in non-English speaking markets. Similarly, in healthcare, AI-powered chatbots have improved diagnosis accuracy by 18%. As mobile apps continue to evolve with AI, businesses in APAC stand to gain significant advantages in terms of compliance, efficiency, and decision-making.
What challenges does the AI In Mobile Apps in APAC Industry face during its growth?
- In the industry, navigating the fragmented regulatory landscape and addressing heightened data privacy concerns are significant challenges that mandate professional expertise and adherence to strict compliance measures, thereby potentially impacting growth.
- The market is characterized by its intricate regulatory landscape. Unlike unified frameworks in regions like Europe, APAC presents a complex mosaic of national jurisdictions, each with distinct data privacy laws, security mandates, and emerging AI governance principles. This fragmentation poses operational and compliance challenges, particularly for small to medium-sized enterprises and startups with limited legal resources. Companies in the region grapple with regulations covering data collection, processing, cross-border data transfer, and user consent. The lack of harmonization necessitates a nuanced understanding of local regulations and significant investment in legal expertise. According to recent studies, the APAC mobile app development industry is projected to reach a value of USD150 billion by 2025, underscoring the importance of navigating these regulatory complexities effectively.
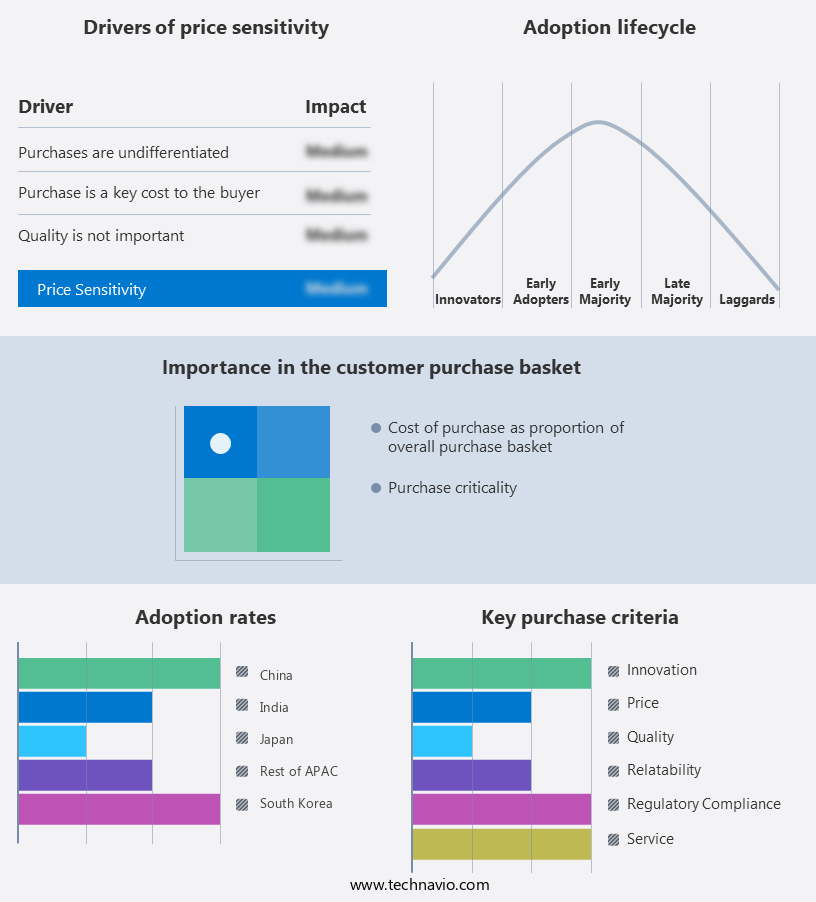
Exclusive Technavio Analysis on Customer Landscape
The APAC AI in mobile apps market forecasting report includes the adoption lifecycle of the market, covering from the innovator's stage to the laggard's stage. It focuses on adoption rates in different regions based on penetration. Furthermore, the APAC ai in mobile apps market report also includes key purchase criteria and drivers of price sensitivity to help companies evaluate and develop their market growth analysis strategies.
Customer Landscape of AI In Mobile Apps in APAC Industry
Competitive Landscape
Companies are implementing various strategies, such as strategic alliances, APAC ai in mobile apps market forecast, partnerships, mergers and acquisitions, geographical expansion, and product/service launches, to enhance their presence in the industry.
Alphabet Inc. - The Gemini-powered Android ecosystem by the company integrates AI technology into mobile apps, delivering advanced functionalities such as multimodal assistants, live translation, contextual search, and agentic task execution. This innovative solution enhances user experience and efficiency.
The industry research and growth report includes detailed analyses of the competitive landscape of the market and information about key companies, including:
- Alphabet Inc.
- AssemblyAI
- C3.ai Inc.
- DataRobot Inc.
- ELSA Co. Ltd.
- FaceApp
- Huawei Technologies Co. Ltd.
- Instabase Inc.
- Leucine
- Microsoft Corp.
- OpenAI
- Samsung Electronics Co. Ltd.
- Scale
- Shield AI
- Snappr Inc.
- Tencent Holdings Ltd.
- Xiaomi Inc.
Qualitative and quantitative analysis of companies has been conducted to help clients understand the wider business environment as well as the strengths and weaknesses of key industry players. Data is qualitatively analyzed to categorize companies as pure play, category-focused, industry-focused, and diversified; it is quantitatively analyzed to categorize companies as dominant, leading, strong, tentative, and weak.
Recent Development and News in AI In Mobile Apps Market In APAC
- In January 2024, Google announced the integration of its AI-powered language model, Bard, into Google Maps for Android users in APAC, enabling more accurate and contextually relevant search results (Google Press Release).
- In March 2024, Huawei and Tencent Holdings entered into a strategic partnership to collaborate on AI research and application development, aiming to enhance the user experience of Huawei mobile apps (Tencent Press Release).
- In May 2024, Indian edtech unicorn Byju's raised USD200 million in a Series F funding round, a significant portion of which will be invested in AI and machine learning technologies to personalize learning experiences for students in the APAC region (Byju's Press Release).
- In August 2024, the Singaporean government launched the "AI for Everyone" initiative, providing grants and resources to support businesses in implementing AI solutions, further fueling the growth of the market (Singapore Government Press Release).
Dive into Technavio's robust research methodology, blending expert interviews, extensive data synthesis, and validated models for unparalleled APAC AI In Mobile Apps Market insights. See full methodology.
|
Market Scope |
|
|
Report Coverage |
Details |
|
Page number |
231 |
|
Base year |
2024 |
|
Historic period |
2019-2023 |
|
Forecast period |
2025-2029 |
|
Growth momentum & CAGR |
Accelerate at a CAGR of 26.3% |
|
Market growth 2025-2029 |
USD 23432.2 million |
|
Market structure |
Fragmented |
|
YoY growth 2024-2025(%) |
23.8 |
|
Key countries |
China, Japan, India, South Korea, and Rest of APAC |
|
Competitive landscape |
Leading Companies, Market Positioning of Companies, Competitive Strategies, and Industry Risks |
Research Analyst Overview
- In the dynamic APAC mobile apps market, conversational AI interfaces and deep learning models have emerged as game-changers, enhancing user experience and driving app performance optimization. For instance, AI-powered personalization has led to a 30% increase in user engagement metrics, while predictive analytics engines have boosted ROI by aligning with data privacy regulations. Real-time data processing and machine learning algorithms enable anomaly detection systems, reducing operational costs by 25% and minimizing fraud. Mobile app AI, including natural language processing and sentiment analysis tools, facilitate app store optimization and user behavior modeling. Reinforcement learning and neural network architectures ensure scalable AI solutions, while adhering to AI ethics guidelines.
- Big data processing and computer vision APIs contribute to AI-driven recommendations and mobile app monetization. In the app development lifecycle, risk assessment models and software testing methodologies ensure mobile device compatibility and app security. Cloud computing infrastructure streamlines the integration of API services, enabling in-app advertising revenue and mobile app security.
What are the Key Data Covered in this APAC AI In Mobile Apps Market Research and Growth Report?
-
What is the expected growth of the APAC AI In Mobile Apps Market between 2025 and 2029?
-
USD 23.43 billion, at a CAGR of 26.3%
-
-
What segmentation does the market report cover?
-
The report segmented by Technology (NLP, ML, Computer vision, and Others), Application (Personalization, Chat automation, Digital assistance, Security, and Others), OS (Android and iOS), and End-user (Entertainment, Social media, Productivity, Health and wellness, and Others)
-
-
Which regions are analyzed in the report?
-
APAC
-
-
What are the key growth drivers and market challenges?
-
Ubiquitous 5G connectivity and on-device AI processing power, Navigating fragmented regulatory landscape and heightened data privacy concerns
-
-
Who are the major players in the AI In Mobile Apps Market in APAC?
-
Key Companies Alphabet Inc., AssemblyAI, C3.ai Inc., DataRobot Inc., ELSA Co. Ltd., FaceApp, Huawei Technologies Co. Ltd., Instabase Inc., Leucine, Microsoft Corp., OpenAI, Samsung Electronics Co. Ltd., Scale, Shield AI, Snappr Inc., Tencent Holdings Ltd., and Xiaomi Inc.
-
Market Research Insights
- In the dynamic and evolving landscape of mobile apps in the Asia Pacific (APAC) region, Artificial Intelligence (AI) is increasingly becoming a game-changer. According to recent studies, the integration of AI in mobile apps is projected to grow by over 20% year-on-year, representing a significant business opportunity for companies in the region. One trend that underscores this growth is the increasing adoption of AI-driven features, such as user feedback analysis, responsible AI practices, and user privacy protection. These features enable mobile apps to provide personalized experiences, optimize conversion rates, and improve app performance. For instance, AI model explainability methods and bias detection methods help ensure transparency and fairness, which are crucial for maintaining user trust.
- Moreover, AI integration strategies, such as chatbot development, image recognition technology, and voice recognition technology, are transforming the way businesses engage with their customers. For example, virtual assistant integration allows companies to offer round-the-clock customer support, while targeted advertising enables them to reach the right audience at the right time. Another area where AI is making a significant impact is in mobile payment systems. AI model deployment and algorithm performance are essential for ensuring secure and seamless transactions. Furthermore, data annotation services and location-based services are enabling businesses to gain valuable insights into app usage patterns and user behavior.
- In conclusion, the integration of AI in mobile apps in APAC is a strategic imperative for businesses looking to stay competitive in today's digital landscape. By leveraging AI-driven features, companies can improve app performance, enhance user experiences, and gain valuable insights into user behavior. The potential for growth is immense, with the market projected to grow by over 20% year-on-year.
We can help! Our analysts can customize this APAC AI in mobile apps market research report to meet your requirements.
 RIA -
RIA - 
