Artificial Intelligence In Telemedicine Market Size 2025-2029
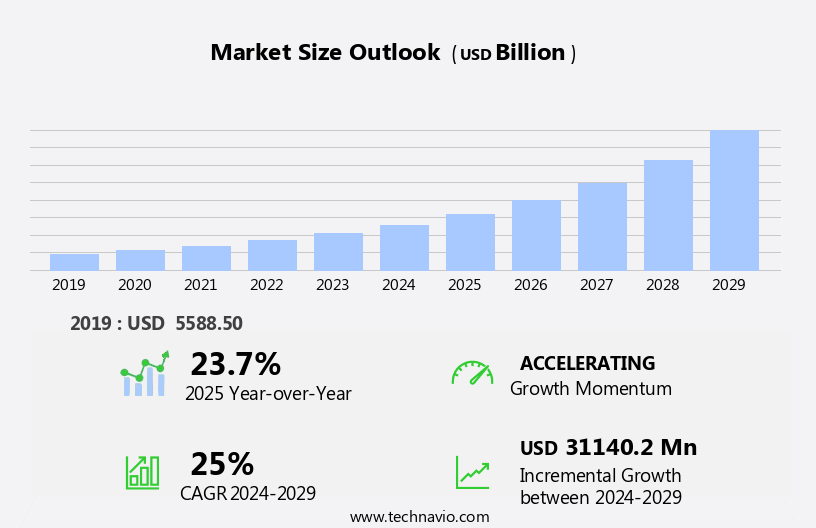
The artificial intelligence in telemedicine market size is forecast to increase by USD 31.14 billion at a CAGR of 25% between 2024 and 2029.
- The Artificial Intelligence (AI) in telemedicine market is witnessing substantial growth, driven by the increasing demand for remote healthcare services and the need for efficient, scalable solutions among healthcare providers. AI integration enhances telemedicine platforms by enabling more accurate diagnostics, personalized treatment recommendations, and improved clinical decision-making, all of which are critical for healthcare organizations aiming to optimize patient outcomes and operational efficiency. The market is further supported by continuous innovation and the launch of advanced AI in telemedicine powered solutions tailored for virtual care environments. However, data privacy and security remain significant concerns, as the digital transmission and storage of sensitive patient information expose healthcare systems to potential breaches and regulatory risks
- With the increasing use of telemedicine and AI, sensitive patient data is being transmitted and stored digitally, making data security a major concern. Ensuring the confidentiality and protection of patient data is crucial for the growth and success of AI in Telemedicine market players. Companies must invest in robust security measures and adhere to regulatory standards to mitigate these risks and build trust with their customers.
What will be the Size of the Artificial Intelligence In Telemedicine Market during the forecast period?

Request Free Sample
- The artificial intelligence (AI) in telemedicine market continues to evolve, with healthcare providers increasingly integrating AI-driven solutions into their virtual care offerings. Telemedicine infrastructure is enhanced through AI-powered virtual assistants, enabling seamless patient engagement and clinical decision support. Personalized medicine benefits from data integration and predictive analytics, while AI-driven diagnostics and machine learning algorithms advance medical imaging analysis. Insurance companies leverage AI for streamlined claims processing and risk assessment. Telehealth platforms incorporate AI for mental health support, virtual care, and emergency medicine. High-speed internet access and cloud computing facilitate remote patient monitoring and real-time data analysis.
- Wearable sensors and remote patient monitoring systems collect vast amounts of data, which is analyzed using AI for predictive analytics and clinical decision support. Regulatory compliance is ensured through AI-driven systems, while deep learning and computer vision are applied to drug discovery and specialty care. Natural language processing and video conferencing improve patient education and communication. AI-driven systems also support remote surgery and chronic disease management. Data privacy and big data analytics are essential considerations in the evolving AI telemedicine landscape.
How is this Artificial Intelligence In Telemedicine Industry segmented?
The artificial intelligence in telemedicine industry research report provides comprehensive data (region-wise segment analysis), with forecasts and estimates in "USD million" for the period 2025-2029, as well as historical data from 2019-2023 for the following segments.
- Component
- Software
- Hardware
- Services
- End-user
- Pharmaceutical companies
- Hospitals
- Research institutes
- Others
- Technology Specificity
- Machine Learning
- Natural Language Processing
- Computer Vision
- Deep Learning
- Application
- Diagnostics
- Remote Monitoring
- Virtual Assistants
- Drug Discovery
- Deployment Type
- Geography
- North America
- Europe
- Middle East and Africa
- APAC
- Australia
- China
- India
- South Korea
- Rest of World (ROW)
By Component Insights
The software segment is estimated to witness significant growth during the forecast period.
The artificial intelligence (AI) market in telemedicine is experiencing significant growth, with the software segment playing a pivotal role. This segment encompasses diagnostic platforms, virtual assistants, clinical decision support systems, and data analytics tools, all of which leverage machine learning (ML), natural language processing (NLP), and other advanced AI techniques. AI-driven diagnostic software utilizes sophisticated algorithms to analyze medical data, including medical images, electronic health records (EHR), and genetic information, enabling healthcare providers to make more accurate diagnoses and offer evidence-based treatment recommendations. Virtual assistants, powered by AI, enhance patient engagement and streamline workflows, while predictive analytics tools help identify potential health risks and optimize resource allocation.
Telehealth platforms integrate AI to offer personalized medicine, remote patient monitoring, and wearable sensors, allowing for more effective chronic disease management. In mental health, AI-powered virtual care offers immersive, harmonious therapy sessions. AI also plays a crucial role in emergency medicine, medical imaging analysis, drug discovery, specialty care, and regulatory compliance. Cloud computing and high-speed internet access facilitate seamless data integration and access, ensuring efficient clinical decision support. AI's impact extends to primary care, regulatory compliance, and remote surgery, with data privacy and big data analytics ensuring patient data security and improving overall healthcare outcomes.

Request Free Sample
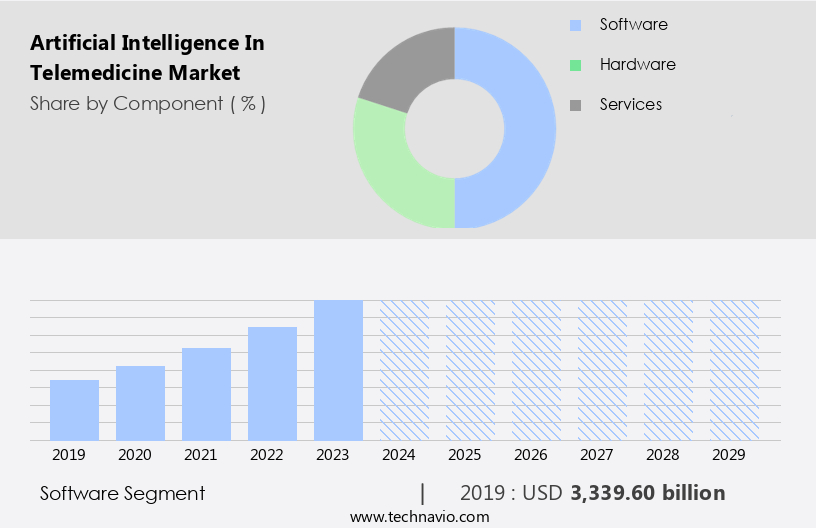
The Software segment was valued at USD 3.34 billion in 2019 and showed a gradual increase during the forecast period.
Regional Analysis
North America is estimated to contribute 34% to the growth of the global market during the forecast period.Technavio's analysts have elaborately explained the regional trends and drivers that shape the market during the forecast period.

Request Free Sample
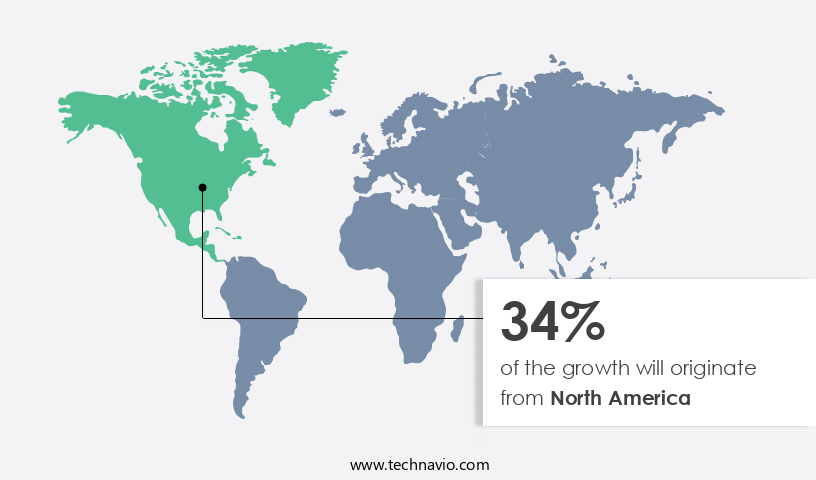
In the global telemedicine market, North America is a major contributor to the artificial intelligence sector, fueled by high adoption rates and technological innovations. According to recent research, 30.1% of adults in the region utilized telemedicine services in 2022, underscoring the increasing trust and dependence on digital health solutions. Canada, in particular, stands out as a pioneer in telemedicine, driven by the need to deliver healthcare in remote locations and the advancement of telecommunications technologies. The Canadian telehealth industry experiences significant growth, expanding at an average annual rate of 35%. Canadian companies, such as Tech4Life in Milton, Ontario, are making waves internationally with their groundbreaking AI-driven telemedicine solutions, including virtual assistants, predictive analytics, and clinical decision support.
These advancements are revolutionizing various aspects of healthcare, from mental health and virtual care to emergency medicine, medical imaging analysis, and chronic disease management. Machine learning algorithms and natural language processing are enhancing patient engagement and enabling personalized medicine, while cloud computing and high-speed internet access ensure seamless data integration and real-time clinical decision support. Insurance companies are also embracing telemedicine, making it an essential component of their offerings. The market's evolution is further characterized by regulatory compliance, data privacy, and big data analytics, which are critical to ensuring the security and effectiveness of AI-powered diagnostics, remote patient monitoring, and remote surgery. The integration of computer vision and deep learning is paving the way for advanced drug discovery and specialty care, ultimately transforming the healthcare landscape.
Market Dynamics
Our researchers analyzed the data with 2024 as the base year, along with the key drivers, trends, and challenges. A holistic analysis of drivers will help companies refine their marketing strategies to gain a competitive advantage.
The Artificial Intelligence Market in Telemedicine advances with AI-powered telemedicine platforms and machine learning for remote diagnostics. AI in telehealth market trends highlight deep learning for patient monitoring and AI-driven virtual health assistants. Natural language processing in telemedicine enhances AI for chronic disease management, while predictive analytics for telehealth improves outcomes. AI telemedicine for rural healthcare and cloud-based AI telemedicine solutions ensure accessibility, per telemedicine AI market forecast. AI for medical imaging analysis and real-time AI patient monitoring drive precision, supported by AI telemedicine cybersecurity solutions. AI in telehospital services, automated AI triage systems, and AI for telehealth data privacy optimize care. AI-powered remote consultations, AI telemedicine for mental health, scalable AI telemedicine platforms, and AI for personalized telehealth fuel growth, transforming healthcare delivery through 2029.
What are the key market drivers leading to the rise in the adoption of Artificial Intelligence In Telemedicine Industry?
- The surge in demand for telemedicine services is the primary market driver, as more patients seek convenient and accessible healthcare solutions from the comfort of their homes.
- Artificial Intelligence (AI) is revolutionizing telemedicine by enhancing healthcare accessibility and outcomes, particularly in underserved areas. The lack of medical facilities and professionals in these regions poses significant challenges to delivering quality healthcare. AI in telemedicine bridges this gap by enabling remote consultations, continuous patient monitoring, and timely interventions through virtual assistants and AI-powered diagnostics. The integration of predictive analytics and data integration further personalizes treatment plans and improves overall efficiency. The COVID-19 pandemic has accelerated the adoption of telehealth services due to the necessity for social distancing and minimizing in-person interactions.
- This shift has highlighted the convenience and effectiveness of telemedicine, establishing a long-term demand for AI-enhanced telemedicine infrastructure. Insurance companies are increasingly recognizing the value of telemedicine and AI-powered diagnostics, further driving market growth. By leveraging AI, telemedicine infrastructure can offer more immersive, harmonious, and efficient healthcare services, ultimately improving patient care and satisfaction.
What are the market trends shaping the Artificial Intelligence In Telemedicine Industry?
- The trend in the market involves frequent new launches from companies. This professional and knowledgeable observation underlines the importance of staying informed about industry developments.
- The artificial intelligence (AI) market in telemedicine is experiencing substantial growth due to innovative product launches by companies. One such recent example is the introduction of Wound AI on October 23, 2024, by Vantiq, Telemedicine Solutions, and NTT DATA. This clinical decision support platform, presented at the HLTH Conference 2024, is revolutionizing wound-care treatment. Leveraging real-time, GenAI-powered recommendations, Wound AI aims to enhance patient outcomes, minimize wound-related complications, and boost operational efficiency. The platform seamlessly integrates with Electronic Health Records (EHR) and employs a federated AI model to safeguard data privacy. Wound AI provides precise wound classification, personalized treatment recommendations, and real-time quality checks, all backed by NTT DATA's Smart Management Platform for sophisticated analytics.
- In telehealth, AI applications such as machine learning algorithms, virtual care, mental health, patient engagement, clinical decision support, medical imaging analysis, and wearable sensors are transforming healthcare delivery and operational efficiency. By offering advanced capabilities, these technologies are enabling healthcare providers to make more informed decisions, improve patient care, and optimize resources.
What challenges does the Artificial Intelligence In Telemedicine Industry face during its growth?
- Data privacy and security concerns represent a significant challenge to the industry's growth, as organizations must balance the need to collect and use data to drive innovation and business growth with the imperative to protect sensitive information from unauthorized access, use, or disclosure.
- Artificial Intelligence (AI) is revolutionizing telemedicine by enabling remote patient monitoring, video conferencing, and natural language processing for effective patient education. Cloud computing facilitates the storage and accessibility of vast amounts of medical data, enabling AI algorithms to analyze patient data and provide accurate diagnoses and treatment recommendations. In emergency medicine, AI can assist doctors in making critical decisions by analyzing vital signs and symptoms in real-time. However, the increasing use of digital health solutions presents significant challenges, particularly in ensuring data privacy and security. According to the U.S. Department of Health and Human Services, there were over 700 healthcare data breaches reported in 2022, exposing millions of records, including sensitive patient information.
- These breaches underscore the importance of implementing robust security measures to protect patient data and prevent severe consequences such as identity theft, financial loss, and compromised patient trust. High-speed internet access and drug discovery are also areas where AI is making a significant impact in telemedicine. Overall, the integration of AI in telemedicine offers numerous benefits, but it is crucial to address the challenges associated with data privacy and security.
Exclusive Customer Landscape
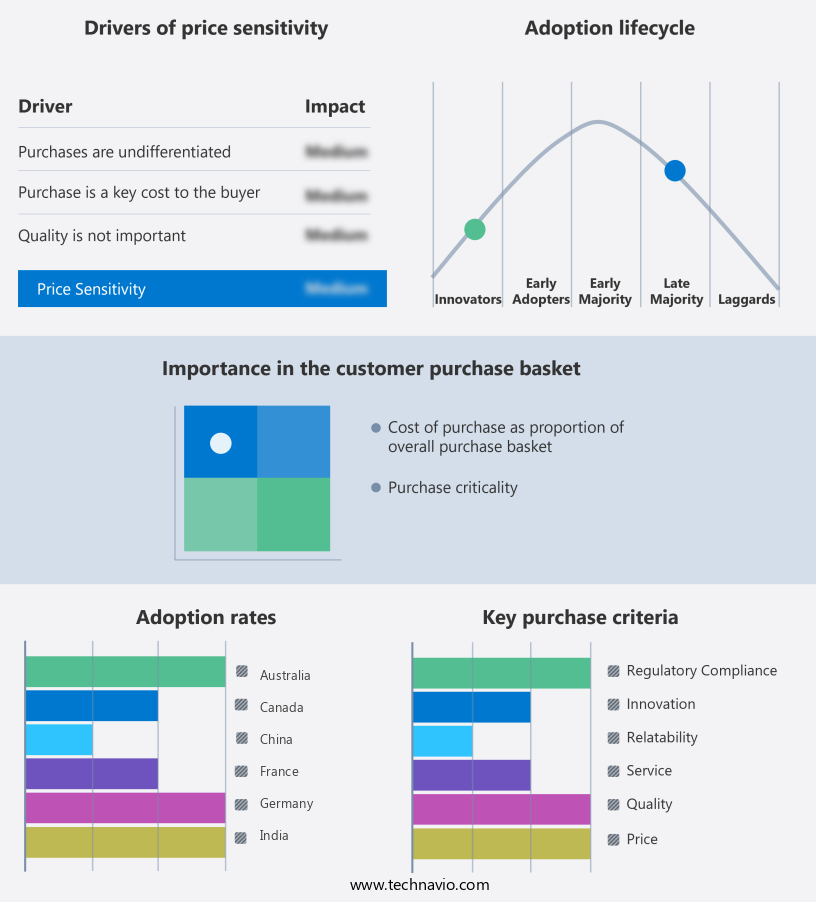
The artificial intelligence in telemedicine market forecasting report includes the adoption lifecycle of the market, covering from the innovator's stage to the laggard's stage. It focuses on adoption rates in different regions based on penetration. Furthermore, the artificial intelligence in telemedicine market report also includes key purchase criteria and drivers of price sensitivity to help companies evaluate and develop their market growth analysis strategies.

Customer Landscape
Key Companies & Market Insights
Companies are implementing various strategies, such as strategic alliances, artificial intelligence in telemedicine market forecast, partnerships, mergers and acquisitions, geographical expansion, and product/service launches, to enhance their presence in the industry.
The industry research and growth report includes detailed analyses of the competitive landscape of the market and information about key companies, including:
- IBM
- Microsoft
- Google
- Amazon Web Services
- NVIDIA
- Philips
- Siemens Healthineers
- GE Healthcare
- Aidoc
- Zebra Medical Vision
- Medtronic
- Teladoc Health
- Amwell
- Butterfly Network
- AliveCor
- Enlitic
- Sensely
- Viz.ai
- Qure.ai
- Icometrix
Qualitative and quantitative analysis of companies has been conducted to help clients understand the wider business environment as well as the strengths and weaknesses of key industry players. Data is qualitatively analyzed to categorize companies as pure play, category-focused, industry-focused, and diversified; it is quantitatively analyzed to categorize companies as dominant, leading, strong, tentative, and weak.
Recent Development and News in Artificial Intelligence In Telemedicine Market
- In March 2023, Google's healthcare subsidiary, Google Health, announced the integration of Google's AI-powered chatbot, "Google Me," with Google Meet for telemedicine consultations (Google, 2023). This development aims to streamline the patient consultation process by enabling automated appointment scheduling, symptom assessment, and prescription management.
- In July 2022, IBM Watson Health and Teladoc Health entered into a strategic partnership to integrate IBM Watson's AI capabilities into Teladoc's telehealth platform (IBM, 2022). This collaboration aims to enhance Teladoc's virtual care offerings by providing AI-driven diagnostic tools and personalized treatment recommendations.
- In January 2022, Microsoft announced the FDA clearance of its AI-powered telemedicine platform, Microsoft Azure AI, for remote patient monitoring and diagnosis (Microsoft, 2022). This approval marks a significant milestone in the adoption of AI in telemedicine, enabling remote diagnosis and treatment of various conditions using AI algorithms.
- In October 2021, Babylon Health secured a USD200 million investment led by Kinnevik and Alphabet's investment arm, GV, to expand its AI-powered digital health services (Babylon, 2021). This funding round will support the company's growth in new markets and the development of advanced AI capabilities for personalized healthcare solutions.
Research Analyst Overview
The artificial intelligence (AI) in telemedicine market is experiencing significant growth, driven by advancements in patient portal technology and the increasing importance of patient consent and medical data security. Health data management is becoming more sophisticated, with AI applications like image segmentation and explainable AI playing crucial roles in precision medicine. However, concerns over AI bias and data encryption remain, necessitating ongoing efforts to ensure patient privacy and trust. Telemedicine apps and virtual consultations are transforming healthcare accessibility, enabling remote monitoring devices to collect and transmit data for disease prediction and patient adherence. AI-driven drug development and genomic sequencing are revolutionizing treatment plans, while AI-assisted diagnosis and medical device integration offer new possibilities for virtual hospital care.
Telemedicine adoption continues to expand, with virtual consultations and AI-enabled medical imaging becoming essential tools for healthcare providers. Despite these advancements, ethical considerations and telemedicine reimbursement remain challenges to widespread adoption. Object detection and biomarker identification are other AI applications contributing to the market's growth, offering opportunities for innovation and improved patient outcomes.
Dive into Technavio's robust research methodology, blending expert interviews, extensive data synthesis, and validated models for unparalleled Artificial Intelligence In Telemedicine Market insights. See full methodology.
Market Scope
|
Report Coverage
|
Details
|
Page number
|
213
|
Base year
|
2024
|
Historic period
|
2019-2023 |
Forecast period
|
2025-2029
|
Growth momentum & CAGR
|
Accelerate at a CAGR of 25%
|
Market growth 2025-2029
|
USD 31140.2 million
|
Market structure
|
Fragmented
|
YoY growth 2024-2025(%)
|
23.7
|
Key countries
|
US, China, Germany, Canada, UK, India, Australia, France, South Korea, and UAE
|
Competitive landscape
|
Leading Companies, Market Positioning of Companies, Competitive Strategies, and Industry Risks
|
Request Free Sample
What are the Key Data Covered in this Artificial Intelligence In Telemedicine Market Research and Growth Report?
- CAGR of the Artificial Intelligence In Telemedicine industry during the forecast period
- Detailed information on factors that will drive the growth and forecasting between 2025 and 2029
- Precise estimation of the size of the market and its contribution of the industry in focus to the parent market
- Accurate predictions about upcoming growth and trends and changes in consumer behaviour
- Growth of the market across North America, Europe, APAC, South America, and Middle East and Africa
- Thorough analysis of the market's competitive landscape and detailed information about companies
- Comprehensive analysis of factors that will challenge the artificial intelligence in telemedicine market growth of industry companies
We can help! Our analysts can customize this artificial intelligence in telemedicine market research report to meet your requirements.
Get in touch
1 Executive Summary
- 1.1 Market overview
- Executive Summary - Chart on Market Overview
- Executive Summary - Data Table on Market Overview
- Executive Summary - Chart on Global Market Characteristics
- Executive Summary - Chart on Market by Geography
- Executive Summary - Chart on Market Segmentation by Component
- Executive Summary - Chart on Market Segmentation by End-user
- Executive Summary - Chart on Incremental Growth
- Executive Summary - Data Table on Incremental Growth
- Executive Summary - Chart on Company Market Positioning
2 Technavio Analysis
- 2.1 Analysis of price sensitivity, lifecycle, customer purchase basket, adoption rates, and purchase criteria
- Analysis of price sensitivity, lifecycle, customer purchase basket, adoption rates, and purchase criteria
- 2.2 Criticality of inputs and Factors of differentiation
- Overview on criticality of inputs and factors of differentiation
- 2.3 Factors of disruption
- Overview on factors of disruption
- 2.4 Impact of drivers and challenges
- Impact of drivers and challenges in 2024 and 2029
3 Market Landscape
- 3.1 Market ecosystem
- Parent Market
- Data Table on - Parent Market
- 3.2 Market characteristics
- Market characteristics analysis
4 Market Sizing
- 4.1 Market definition
- Offerings of companies included in the market definition
- 4.2 Market segment analysis
- 4.4 Market outlook: Forecast for 2024-2029
- Chart on Global - Market size and forecast 2024-2029 ($ million)
- Data Table on Global - Market size and forecast 2024-2029 ($ million)
- Chart on Global Market: Year-over-year growth 2024-2029 (%)
- Data Table on Global Market: Year-over-year growth 2024-2029 (%)
5 Historic Market Size
- 5.1 Global Artificial Intelligence Market In Telemedicine 2019 - 2023
- Historic Market Size - Data Table on Global Artificial Intelligence Market In Telemedicine 2019 - 2023 ($ million)
- 5.2 Component segment analysis 2019 - 2023
- Historic Market Size - Component Segment 2019 - 2023 ($ million)
- 5.3 End-user segment analysis 2019 - 2023
- Historic Market Size - End-user Segment 2019 - 2023 ($ million)
- 5.4 Geography segment analysis 2019 - 2023
- Historic Market Size - Geography Segment 2019 - 2023 ($ million)
- 5.5 Country segment analysis 2019 - 2023
- Historic Market Size - Country Segment 2019 - 2023 ($ million)
6 Qualitative Analysis
- 6.1 Impact of AI in the Global Artificial Intelligence (AI) Market in Telemedicine
7 Five Forces Analysis
- 7.1 Five forces summary
- Five forces analysis - Comparison between 2024 and 2029
- 7.2 Bargaining power of buyers
- Bargaining power of buyers - Impact of key factors 2024 and 2029
- 7.3 Bargaining power of suppliers
- Bargaining power of suppliers - Impact of key factors in 2024 and 2029
- 7.4 Threat of new entrants
- Threat of new entrants - Impact of key factors in 2024 and 2029
- 7.5 Threat of substitutes
- Threat of substitutes - Impact of key factors in 2024 and 2029
- 7.6 Threat of rivalry
- Threat of rivalry - Impact of key factors in 2024 and 2029
- 7.7 Market condition
- Chart on Market condition - Five forces 2024 and 2029
8 Market Segmentation by Component
- 8.1 Market segments
- Chart on Component - Market share (2024-2029) (%)
- Data Table on Component - Market share (2024-2029) (%)
- 8.2 Comparison by Component
- Chart on Comparison by Component
- Data Table on Comparison by Component
- 8.3 Software - Market size and forecast (2024-2029)
- Chart on Software - Market size and forecast (2024-2029) ($ million)
- Data Table on Software - Market size and forecast (2024-2029) ($ million)
- Chart on Software - Year-over-year growth (2024-2029) (%)
- Data Table on Software - Year-over-year growth (2024-2029) (%)
- 8.4 Hardware - Market size and forecast (2024-2029)
- Chart on Hardware - Market size and forecast (2024-2029) ($ million)
- Data Table on Hardware - Market size and forecast (2024-2029) ($ million)
- Chart on Hardware - Year-over-year growth (2024-2029) (%)
- Data Table on Hardware - Year-over-year growth (2024-2029) (%)
- 8.5 Services - Market size and forecast (2024-2029)
- Chart on Services - Market size and forecast (2024-2029) ($ million)
- Data Table on Services - Market size and forecast (2024-2029) ($ million)
- Chart on Services - Year-over-year growth (2024-2029) (%)
- Data Table on Services - Year-over-year growth (2024-2029) (%)
- 8.6 Market opportunity by Component
- Market opportunity by Component ($ million)
- Data Table on Market opportunity by Component ($ million)
9 Market Segmentation by End-user
- 9.1 Market segments
- Chart on End-user - Market share (2024-2029) (%)
- Data Table on End-user - Market share (2024-2029) (%)
- 9.2 Comparison by End-user
- Chart on Comparison by End-user
- Data Table on Comparison by End-user
- 9.3 Pharmaceutical companies - Market size and forecast (2024-2029)
- Chart on Pharmaceutical companies - Market size and forecast (2024-2029) ($ million)
- Data Table on Pharmaceutical companies - Market size and forecast (2024-2029) ($ million)
- Chart on Pharmaceutical companies - Year-over-year growth (2024-2029) (%)
- Data Table on Pharmaceutical companies - Year-over-year growth (2024-2029) (%)
- 9.4 Hospitals - Market size and forecast (2024-2029)
- Chart on Hospitals - Market size and forecast (2024-2029) ($ million)
- Data Table on Hospitals - Market size and forecast (2024-2029) ($ million)
- Chart on Hospitals - Year-over-year growth (2024-2029) (%)
- Data Table on Hospitals - Year-over-year growth (2024-2029) (%)
- 9.5 Research institutes - Market size and forecast (2024-2029)
- Chart on Research institutes - Market size and forecast (2024-2029) ($ million)
- Data Table on Research institutes - Market size and forecast (2024-2029) ($ million)
- Chart on Research institutes - Year-over-year growth (2024-2029) (%)
- Data Table on Research institutes - Year-over-year growth (2024-2029) (%)
- 9.6 Others - Market size and forecast (2024-2029)
- Chart on Others - Market size and forecast (2024-2029) ($ million)
- Data Table on Others - Market size and forecast (2024-2029) ($ million)
- Chart on Others - Year-over-year growth (2024-2029) (%)
- Data Table on Others - Year-over-year growth (2024-2029) (%)
- 9.7 Market opportunity by End-user
- Market opportunity by End-user ($ million)
- Data Table on Market opportunity by End-user ($ million)
10 Market Segmentation by Technology Specificity
- 10.1 Market segments
- Chart on Technology Specificity - Market share (2024-2029) (%)
- Data Table on Technology Specificity - Market share (2024-2029) (%)
- 10.2 Comparison by Technology Specificity
- Chart on Comparison by Technology Specificity
- Data Table on Comparison by Technology Specificity
- 10.3 Machine Learning - Market size and forecast (2024-2029)
- Chart on Machine Learning - Market size and forecast (2024-2029) ($ million)
- Data Table on Machine Learning - Market size and forecast (2024-2029) ($ million)
- Chart on Machine Learning - Year-over-year growth (2024-2029) (%)
- Data Table on Machine Learning - Year-over-year growth (2024-2029) (%)
- 10.4 Natural Language Processing - Market size and forecast (2024-2029)
- Chart on Natural Language Processing - Market size and forecast (2024-2029) ($ million)
- Data Table on Natural Language Processing - Market size and forecast (2024-2029) ($ million)
- Chart on Natural Language Processing - Year-over-year growth (2024-2029) (%)
- Data Table on Natural Language Processing - Year-over-year growth (2024-2029) (%)
- 10.5 Computer Vision - Market size and forecast (2024-2029)
- Chart on Computer Vision - Market size and forecast (2024-2029) ($ million)
- Data Table on Computer Vision - Market size and forecast (2024-2029) ($ million)
- Chart on Computer Vision - Year-over-year growth (2024-2029) (%)
- Data Table on Computer Vision - Year-over-year growth (2024-2029) (%)
- 10.6 Deep Learning - Market size and forecast (2024-2029)
- Chart on Deep Learning - Market size and forecast (2024-2029) ($ million)
- Data Table on Deep Learning - Market size and forecast (2024-2029) ($ million)
- Chart on Deep Learning - Year-over-year growth (2024-2029) (%)
- Data Table on Deep Learning - Year-over-year growth (2024-2029) (%)
- 10.7 Market opportunity by Technology Specificity
- Market opportunity by Technology Specificity ($ million)
- Data Table on Market opportunity by Technology Specificity ($ million)
11 Market Segmentation by Application
- 11.1 Market segments
- Chart on Application - Market share (2024-2029) (%)
- Data Table on Application - Market share (2024-2029) (%)
- 11.2 Comparison by Application
- Chart on Comparison by Application
- Data Table on Comparison by Application
- 11.3 Diagnostics - Market size and forecast (2024-2029)
- Chart on Diagnostics - Market size and forecast (2024-2029) ($ million)
- Data Table on Diagnostics - Market size and forecast (2024-2029) ($ million)
- Chart on Diagnostics - Year-over-year growth (2024-2029) (%)
- Data Table on Diagnostics - Year-over-year growth (2024-2029) (%)
- 11.4 Remote Monitoring - Market size and forecast (2024-2029)
- Chart on Remote Monitoring - Market size and forecast (2024-2029) ($ million)
- Data Table on Remote Monitoring - Market size and forecast (2024-2029) ($ million)
- Chart on Remote Monitoring - Year-over-year growth (2024-2029) (%)
- Data Table on Remote Monitoring - Year-over-year growth (2024-2029) (%)
- 11.5 Virtual Assistants - Market size and forecast (2024-2029)
- Chart on Virtual Assistants - Market size and forecast (2024-2029) ($ million)
- Data Table on Virtual Assistants - Market size and forecast (2024-2029) ($ million)
- Chart on Virtual Assistants - Year-over-year growth (2024-2029) (%)
- Data Table on Virtual Assistants - Year-over-year growth (2024-2029) (%)
- 11.6 Drug Discovery - Market size and forecast (2024-2029)
- Chart on Drug Discovery - Market size and forecast (2024-2029) ($ million)
- Data Table on Drug Discovery - Market size and forecast (2024-2029) ($ million)
- Chart on Drug Discovery - Year-over-year growth (2024-2029) (%)
- Data Table on Drug Discovery - Year-over-year growth (2024-2029) (%)
- 11.7 Market opportunity by Application
- Market opportunity by Application ($ million)
- Data Table on Market opportunity by Application ($ million)
12 Market Segmentation by Deployment Type
- 12.1 Market segments
- Chart on Deployment Type - Market share (2024-2029) (%)
- Data Table on Deployment Type - Market share (2024-2029) (%)
- 12.2 Comparison by Deployment Type
- Chart on Comparison by Deployment Type
- Data Table on Comparison by Deployment Type
- 12.3 Cloud-Based - Market size and forecast (2024-2029)
- Chart on Cloud-Based - Market size and forecast (2024-2029) ($ million)
- Data Table on Cloud-Based - Market size and forecast (2024-2029) ($ million)
- Chart on Cloud-Based - Year-over-year growth (2024-2029) (%)
- Data Table on Cloud-Based - Year-over-year growth (2024-2029) (%)
- 12.4 On-Premises - Market size and forecast (2024-2029)
- Chart on On-Premises - Market size and forecast (2024-2029) ($ million)
- Data Table on On-Premises - Market size and forecast (2024-2029) ($ million)
- Chart on On-Premises - Year-over-year growth (2024-2029) (%)
- Data Table on On-Premises - Year-over-year growth (2024-2029) (%)
- 12.5 Market opportunity by Deployment Type
- Market opportunity by Deployment Type ($ million)
- Data Table on Market opportunity by Deployment Type ($ million)
13 Customer Landscape
- 13.1 Customer landscape overview
- Analysis of price sensitivity, lifecycle, customer purchase basket, adoption rates, and purchase criteria
14 Geographic Landscape
- 14.1 Geographic segmentation
- Chart on Market share by geography 2024-2029 (%)
- Data Table on Market share by geography 2024-2029 (%)
- 14.2 Geographic comparison
- Chart on Geographic comparison
- Data Table on Geographic comparison
- 14.3 North America - Market size and forecast 2024-2029
- Chart on North America - Market size and forecast 2024-2029 ($ million)
- Data Table on North America - Market size and forecast 2024-2029 ($ million)
- Chart on North America - Year-over-year growth 2024-2029 (%)
- Data Table on North America - Year-over-year growth 2024-2029 (%)
- 14.4 Europe - Market size and forecast 2024-2029
- Chart on Europe - Market size and forecast 2024-2029 ($ million)
- Data Table on Europe - Market size and forecast 2024-2029 ($ million)
- Chart on Europe - Year-over-year growth 2024-2029 (%)
- Data Table on Europe - Year-over-year growth 2024-2029 (%)
- 14.5 APAC - Market size and forecast 2024-2029
- Chart on APAC - Market size and forecast 2024-2029 ($ million)
- Data Table on APAC - Market size and forecast 2024-2029 ($ million)
- Chart on APAC - Year-over-year growth 2024-2029 (%)
- Data Table on APAC - Year-over-year growth 2024-2029 (%)
- 14.6 South America - Market size and forecast 2024-2029
- Chart on South America - Market size and forecast 2024-2029 ($ million)
- Data Table on South America - Market size and forecast 2024-2029 ($ million)
- Chart on South America - Year-over-year growth 2024-2029 (%)
- Data Table on South America - Year-over-year growth 2024-2029 (%)
- 14.7 Middle East and Africa - Market size and forecast 2024-2029
- Chart on Middle East and Africa - Market size and forecast 2024-2029 ($ million)
- Data Table on Middle East and Africa - Market size and forecast 2024-2029 ($ million)
- Chart on Middle East and Africa - Year-over-year growth 2024-2029 (%)
- Data Table on Middle East and Africa - Year-over-year growth 2024-2029 (%)
- 14.8 US - Market size and forecast 2024-2029
- Chart on US - Market size and forecast 2024-2029 ($ million)
- Data Table on US - Market size and forecast 2024-2029 ($ million)
- Chart on US - Year-over-year growth 2024-2029 (%)
- Data Table on US - Year-over-year growth 2024-2029 (%)
- 14.9 China - Market size and forecast 2024-2029
- Chart on China - Market size and forecast 2024-2029 ($ million)
- Data Table on China - Market size and forecast 2024-2029 ($ million)
- Chart on China - Year-over-year growth 2024-2029 (%)
- Data Table on China - Year-over-year growth 2024-2029 (%)
- 14.10 Germany - Market size and forecast 2024-2029
- Chart on Germany - Market size and forecast 2024-2029 ($ million)
- Data Table on Germany - Market size and forecast 2024-2029 ($ million)
- Chart on Germany - Year-over-year growth 2024-2029 (%)
- Data Table on Germany - Year-over-year growth 2024-2029 (%)
- 14.11 UK - Market size and forecast 2024-2029
- Chart on UK - Market size and forecast 2024-2029 ($ million)
- Data Table on UK - Market size and forecast 2024-2029 ($ million)
- Chart on UK - Year-over-year growth 2024-2029 (%)
- Data Table on UK - Year-over-year growth 2024-2029 (%)
- 14.12 Canada - Market size and forecast 2024-2029
- Chart on Canada - Market size and forecast 2024-2029 ($ million)
- Data Table on Canada - Market size and forecast 2024-2029 ($ million)
- Chart on Canada - Year-over-year growth 2024-2029 (%)
- Data Table on Canada - Year-over-year growth 2024-2029 (%)
- 14.13 India - Market size and forecast 2024-2029
- Chart on India - Market size and forecast 2024-2029 ($ million)
- Data Table on India - Market size and forecast 2024-2029 ($ million)
- Chart on India - Year-over-year growth 2024-2029 (%)
- Data Table on India - Year-over-year growth 2024-2029 (%)
- 14.14 Australia - Market size and forecast 2024-2029
- Chart on Australia - Market size and forecast 2024-2029 ($ million)
- Data Table on Australia - Market size and forecast 2024-2029 ($ million)
- Chart on Australia - Year-over-year growth 2024-2029 (%)
- Data Table on Australia - Year-over-year growth 2024-2029 (%)
- 14.15 France - Market size and forecast 2024-2029
- Chart on France - Market size and forecast 2024-2029 ($ million)
- Data Table on France - Market size and forecast 2024-2029 ($ million)
- Chart on France - Year-over-year growth 2024-2029 (%)
- Data Table on France - Year-over-year growth 2024-2029 (%)
- 14.16 South Korea - Market size and forecast 2024-2029
- Chart on South Korea - Market size and forecast 2024-2029 ($ million)
- Data Table on South Korea - Market size and forecast 2024-2029 ($ million)
- Chart on South Korea - Year-over-year growth 2024-2029 (%)
- Data Table on South Korea - Year-over-year growth 2024-2029 (%)
- 14.17 UAE - Market size and forecast 2024-2029
- Chart on UAE - Market size and forecast 2024-2029 ($ million)
- Data Table on UAE - Market size and forecast 2024-2029 ($ million)
- Chart on UAE - Year-over-year growth 2024-2029 (%)
- Data Table on UAE - Year-over-year growth 2024-2029 (%)
- 14.18 Market opportunity by geography
- Market opportunity by geography ($ million)
- Data Tables on Market opportunity by geography ($ million)
- 14.19 Rest of World (ROW) - Market size and forecast (2024-2029)
- Chart on Rest of World (ROW) - Market size and forecast (2024-2029) ($ million)
- Data Table on Rest of World (ROW) - Market size and forecast (2024-2029) ($ million)
- Chart on Rest of World (ROW) - Year-over-year growth (2024-2029) (%)
- Data Table on Rest of World (ROW) - Year-over-year growth (2024-2029) (%)
15 Drivers, Challenges, and Opportunity/Restraints
- 15.3 Impact of drivers and challenges
- Impact of drivers and challenges in 2024 and 2029
- 15.4 Market opportunities/restraints
16 Competitive Landscape
- 16.2 Competitive Landscape
- Overview on criticality of inputs and factors of differentiation
- 16.3 Landscape disruption
- Overview on factors of disruption
- 16.4 Industry risks
- Impact of key risks on business
17 Competitive Analysis
- 17.2 Market positioning of companies
- Matrix on companies position and classification
- 17.3 IBM
- IBM - Overview
- IBM - Product / Service
- IBM - Key offerings
- 17.4 Microsoft
- Microsoft - Overview
- Microsoft - Product / Service
- Microsoft - Key offerings
- 17.5 Google
- Google - Overview
- Google - Product / Service
- Google - Key offerings
- 17.6 Amazon Web Services
- Amazon Web Services - Overview
- Amazon Web Services - Product / Service
- Amazon Web Services - Key offerings
- 17.7 NVIDIA
- NVIDIA - Overview
- NVIDIA - Product / Service
- NVIDIA - Key offerings
- 17.8 Philips
- Philips - Overview
- Philips - Product / Service
- Philips - Key offerings
- 17.9 Siemens Healthineers
- Siemens Healthineers - Overview
- Siemens Healthineers - Product / Service
- Siemens Healthineers - Key offerings
- 17.10 GE Healthcare
- GE Healthcare - Overview
- GE Healthcare - Product / Service
- GE Healthcare - Key offerings
- 17.11 Aidoc
- Aidoc - Overview
- Aidoc - Product / Service
- Aidoc - Key offerings
- 17.12 Zebra Medical Vision
- Zebra Medical Vision - Overview
- Zebra Medical Vision - Product / Service
- Zebra Medical Vision - Key offerings
- 17.13 Medtronic
- Medtronic - Overview
- Medtronic - Product / Service
- Medtronic - Key offerings
- 17.14 Teladoc Health
- Teladoc Health - Overview
- Teladoc Health - Product / Service
- Teladoc Health - Key offerings
- 17.15 Amwell
- Amwell - Overview
- Amwell - Product / Service
- Amwell - Key offerings
- 17.16 Butterfly Network
- Butterfly Network - Overview
- Butterfly Network - Product / Service
- Butterfly Network - Key offerings
- 17.17 AliveCor
- AliveCor - Overview
- AliveCor - Product / Service
- AliveCor - Key offerings
- 17.18 Enlitic
- Enlitic - Overview
- Enlitic - Product / Service
- Enlitic - Key offerings
- 17.19 Sensely
- Sensely - Overview
- Sensely - Product / Service
- Sensely - Key offerings
- 17.20 Viz.ai
- Viz.ai - Overview
- Viz.ai - Product / Service
- Viz.ai - Key offerings
- 17.21 Qure.ai
- Qure.ai - Overview
- Qure.ai - Product / Service
- Qure.ai - Key offerings
- 17.22 Icometrix
- Icometrix - Overview
- Icometrix - Product / Service
- Icometrix - Key offerings
- 17.23 AliveCor Inc.
- AliveCor Inc. - Overview
- AliveCor Inc. - Product / Service
- AliveCor Inc. - Key offerings
- 17.24 Alphabet Inc.
- Alphabet Inc. - Overview
- Alphabet Inc. - Product / Service
- Alphabet Inc. - Key offerings
- 17.25 Amazon Web Services Inc.
- Amazon Web Services Inc. - Overview
- Amazon Web Services Inc. - Product / Service
- Amazon Web Services Inc. - Key offerings
- 17.26 Dhanush Healthcare Systems Pvt Ltd
- Dhanush Healthcare Systems Pvt Ltd - Overview
- Dhanush Healthcare Systems Pvt Ltd - Product / Service
- Dhanush Healthcare Systems Pvt Ltd - Key offerings
- 17.27 Intel Corp.
- Intel Corp. - Overview
- Intel Corp. - Product / Service
- Intel Corp. - Key offerings
- 17.28 International Business Machines Corp.
- International Business Machines Corp. - Overview
- International Business Machines Corp. - Product / Service
- International Business Machines Corp. - Key offerings
- 17.29 Koninklijke Philips NV
- Koninklijke Philips NV - Overview
- Koninklijke Philips NV - Product / Service
- Koninklijke Philips NV - Key offerings
- 17.30 Lybrate Inc. USA.
- Lybrate Inc. USA. - Overview
- Lybrate Inc. USA. - Product / Service
- Lybrate Inc. USA. - Key offerings
- 17.31 Microsoft Corp
- Microsoft Corp - Overview
- Microsoft Corp - Product / Service
- Microsoft Corp - Key offerings
- 17.32 NVIDIA Corp.
- NVIDIA Corp. - Overview
- NVIDIA Corp. - Product / Service
- NVIDIA Corp. - Key offerings
- 17.33 Plum Benefits Insurance Brokers Pvt Ltd
- Plum Benefits Insurance Brokers Pvt Ltd - Overview
- Plum Benefits Insurance Brokers Pvt Ltd - Product / Service
- Plum Benefits Insurance Brokers Pvt Ltd - Key offerings
- 17.34 Practo Technologies Pvt. Ltd.
- Practo Technologies Pvt. Ltd. - Overview
- Practo Technologies Pvt. Ltd. - Product / Service
- Practo Technologies Pvt. Ltd. - Key offerings
- 17.35 Teladoc Health Inc.
- Teladoc Health Inc. - Overview
- Teladoc Health Inc. - Product / Service
- Teladoc Health Inc. - Key offerings
- 17.36 TeleVital India Pvt. Ltd.
- TeleVital India Pvt. Ltd. - Overview
- TeleVital India Pvt. Ltd. - Product / Service
- TeleVital India Pvt. Ltd. - Key offerings
- 17.37 Turtle Shell Technologies Pvt Ltd
- Turtle Shell Technologies Pvt Ltd - Overview
- Turtle Shell Technologies Pvt Ltd - Product / Service
- Turtle Shell Technologies Pvt Ltd - Key offerings
- 17.38 XpressCure
- XpressCure - Overview
- XpressCure - Product / Service
- XpressCure - Key offerings
- 17.39 Zyla Health Pvt Ltd
- Zyla Health Pvt Ltd - Overview
- Zyla Health Pvt Ltd - Product / Service
- Zyla Health Pvt Ltd - Key offerings
18 Appendix
- 18.2 Inclusions and exclusions checklist
- Inclusions checklist
- Exclusions checklist
- 18.3 Currency conversion rates for US$
- Currency conversion rates for US$
- 18.4 Research methodology
- 18.7 Validation techniques employed for market sizing
- Validation techniques employed for market sizing
- 18.9 360 degree market analysis
- 360 degree market analysis
- 18.10 List of abbreviations