Attenuators Market Size 2024-2028
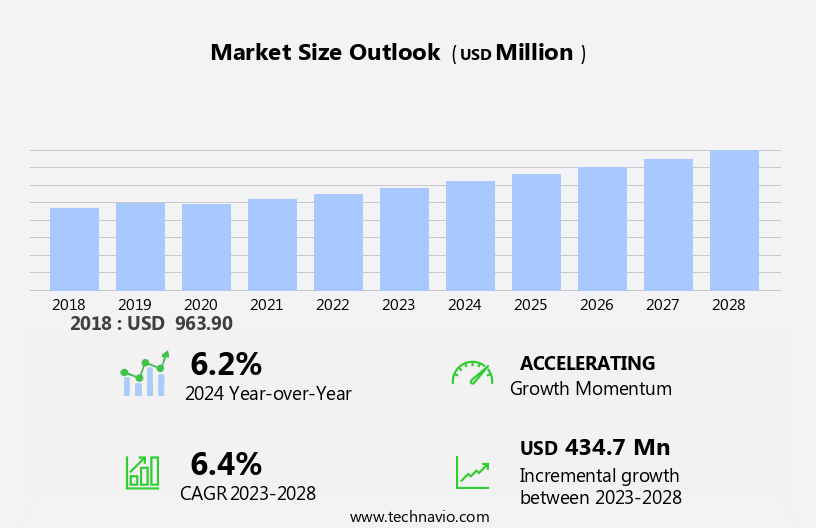
The attenuators market size is forecast to increase by USD 434.7 million, at a CAGR of 6.4% between 2023 and 2028.
- The market is experiencing significant growth due to the increasing demand for protection against wave action in marine environments. This need is particularly prevalent in North America, where the coastline is extensive and subject to frequent storms and harsh weather conditions. Additionally, innovation in material technology is expanding, leading to the development of more durable and effective attenuators. Silicon-based timing devices further enhance the performance of attenuators in modern communication systems. However, ensuring accurate measurements in attenuators is a significant challenge. Linearity issues in power sensing devices, such as power sensors and detectors, can compromise measurement reliability. To address this, test engineers seek consistent power exposure levels to maintain measurement accuracy. Overall, the market is poised for continued expansion as the demand for effective wave mitigation solutions increases.
What will be the Size of the Attenuators Market During the Forecast Period?
- The market encompasses passive devices that play a crucial role in data centers, data transmission, and network communication systems. These components ensure signal integrity during data transmission, particularly in high-speed applications such as cloud computing, the Internet of Things (IoT), wireless infrastructure, and 5G technology. Attenuators are essential for maintaining Quality of Service (QoS) in communication equipment and telecommunications networks, reducing signal power through voltage divider networks and semiconductor devices like digital attenuators, single-channel jitter attenuators, and multi-channel jitter attenuators. Driver circuitry, including CMOS logic and TTL, are integral to the functionality of these devices, enabling amplitude reduction for test and measurement applications. Maximum rated attenuation levels vary, with applications in 5G and data centers requiring precise attenuation for signal power reduction.
How is this Attenuators Industry segmented and which is the largest segment?
The attenuators industry research report provides comprehensive data (region-wise segment analysis), with forecasts and estimates in "USD million" for the period 2024-2028, as well as historical data from 2018-2022 for the following segments.
- Type
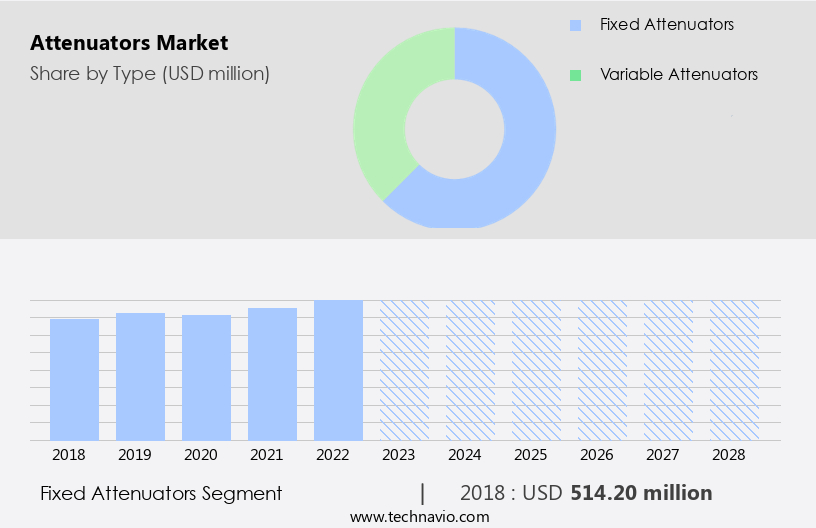
- Fixed attenuators
- Variable attenuators
- Application
- Telecommunications
- Broad casting
- Data centers
- Automotive
- Others
- Geography
- APAC
- China
- Japan
- North America
- US
- Europe
- Germany
- UK
- South America
- Middle East and Africa
- APAC
By Type Insights
- The fixed attenuators segment is estimated to witness significant growth during the forecast period.
Fixed attenuators are essential components in telecommunications, particularly in wireless infrastructure and 5G technology, that ensure consistent signal attenuation for various applications. These devices reduce signal amplitude by a predetermined amount, typically measured in decibels (dB), using a fixed resistance network to dissipate excess power as heat. The market for fixed attenuators comprises several types, including Standard, Cryogenic, Space-Grade, Superconducting, and Microwave Fixed Attenuators. To guarantee reliability under extreme conditions, these devices undergo rigorous testing In thermal vacuum chambers and radiation facilities. Fixed attenuators play a vital role in maintaining Quality of Service (QoS) by managing precise signal levels in telecommunications networks.
Get a glance at the Attenuators Industry report of share of various segments Request Free Sample
The fixed attenuators segment was valued at USD 514.20 million in 2018 and showed a gradual increase during the forecast period.
Regional Analysis
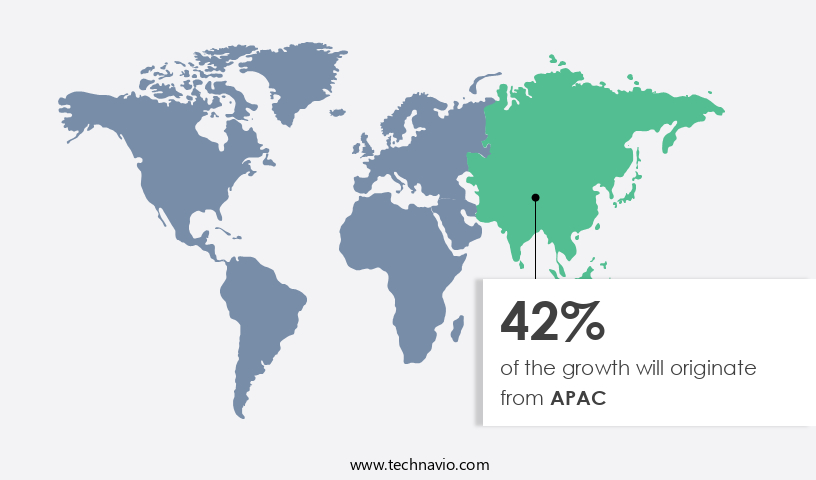
- APAC is estimated to contribute 42% to the growth of the global market during the forecast period.
Technavio's analysts have elaborately explained the regional trends and drivers that shape the market during the forecast period.
For more insights on the market share of various regions, Request Free Sample
The market is experiencing notable growth, particularly In the Asia Pacific (APAC) region, due to the expansion of the telecommunications sector. India, as the second-largest telecommunications market globally, with approximately 1.20 billion subscribers, significantly contributes to this growth. Over the last two decades, the Indian telecommunications sector has seen remarkable growth, contributing substantially to the nation's Gross Domestic Product (GDP). Attenuators play a crucial role in telecommunications by controlling signal levels in RF systems, preventing damage to sensitive equipment from high power levels. Factors driving the growth of the telecommunications sector in India include the increasing adoption of 4G and the rollout of 5G networks, the growing demand for consumer electronics, and the integration of military applications, including autonomous cars and LTE and 5G networks.
Market Dynamics
Our attenuators market researchers analyzed the data with 2023 as the base year, along with the key drivers, trends, and challenges. A holistic analysis of drivers will help companies refine their marketing strategies to gain a competitive advantage.
What are the key market drivers leading to the rise In the adoption of the Attenuators Industry?
The need for protection against wave action in marine environments is the key driver of the market.
- The market is experiencing significant growth due to the increasing demand for signal integrity in various applications, particularly in data centers, data transmission, network communication, cloud computing, and the Internet of Things (IoT). With the proliferation of high bandwidth technologies such as 5G Technology, 5G Networks, and LTE Networks, there is a rising need for attenuators in wireless infrastructure to ensure Quality of Service (QoS) and maintain signal power reduction. Attenuators are passive devices used to reduce the amplitude of signals in telecommunications and test and measurement applications. They are available in various types, including single-channel jitter attenuators, multi-channel jitter attenuators, digital attenuators, and active and variable attenuators.
- These devices are crucial in various industries, including telecommunications, military applications, consumer electronics, and the automotive sector, where they are used in autonomous cars and connected cars. Moreover, attenuators find extensive applications in data center applications, where they are used to ensure signal integrity and reduce voltage levels. They are also used in silicon-based timing devices, vibration dampers, and machine-learning algorithms. The increasing adoption of smart grid technology, time-sensitive smart meters, financial security, digital transformation, and e-commerce are also driving the demand for attenuators.
What are the market trends shaping the Attenuators Industry?
Expanding innovation in material technology is the upcoming market trend.
-
The market is experiencing significant growth due to the increasing demand for advanced data transmission solutions in sectors such as data centers, cloud computing, Internet of Things (IoT), and 5G technology. Attenuators play a crucial role in ensuring signal integrity and Quality of Service (QoS) in network communication, particularly in high bandwidth technologies like 5G networks and LTE networks. In the context of data center applications, attenuators are used to reduce signal power and maintain voltage levels in digital attenuators and passive devices. Semiconductor devices, such as transistor-transistor logic (TTL) driver circuitry, are integral to the functioning of attenuators.
-
The market is witnessing innovation in attenuator technology, with advancements in single-channel jitter attenuators and multi-channel jitter attenuators. These attenuators are essential in various industries, including telecommunications, military applications, consumer electronics, and wireless infrastructure. Recent developments in 5G technology and IoT have led to the emergence of new applications, such as autonomous cars, connected cars, and smart grid technology. These applications require high precision and reliability, necessitating the use of advanced attenuators. Silicon-based timing devices are also gaining popularity due to their small form factor and low power consumption. In the realm of test and measurement and communication equipment, active and variable attenuators are widely used for power wattage adjustment and precision signal attenuation.
What challenges does the Attenuators Industry face during its growth?
Uncertainty in producing accurate measurements is a key challenge affecting the industry growth.
-
The market is experiencing significant growth due to the increasing demand for advanced data transmission solutions in sectors such as data centers, cloud computing, Internet of Things (IoT), and 5G technology. Attenuators play a crucial role in ensuring signal integrity and Quality of Service (QoS) in network communication, particularly in high bandwidth technologies like 5G networks and LTE networks. In the context of data center applications, attenuators are used to reduce signal power and maintain voltage levels in digital attenuators and passive devices. Semiconductor devices, such as transistor-transistor logic (TTL) driver circuitry, are integral to the functioning of attenuators.
-
The market is witnessing innovation in attenuator technology, with advancements in single-channel jitter attenuators and multi-channel jitter attenuators. These attenuators are essential in various industries, including telecommunications, military applications, consumer electronics, and wireless infrastructure. Recent developments in 5G technology and IoT have led to the emergence of new applications, such as autonomous cars, connected cars, and smart grid technology. These applications require high precision and reliability, necessitating the use of advanced attenuators. Silicon-based timing devices are also gaining popularity due to their small form factor and low power consumption. In the realm of test and measurement and communication equipment, active and variable attenuators are widely used for power wattage adjustment and precision signal attenuation.
Exclusive Customer Landscape
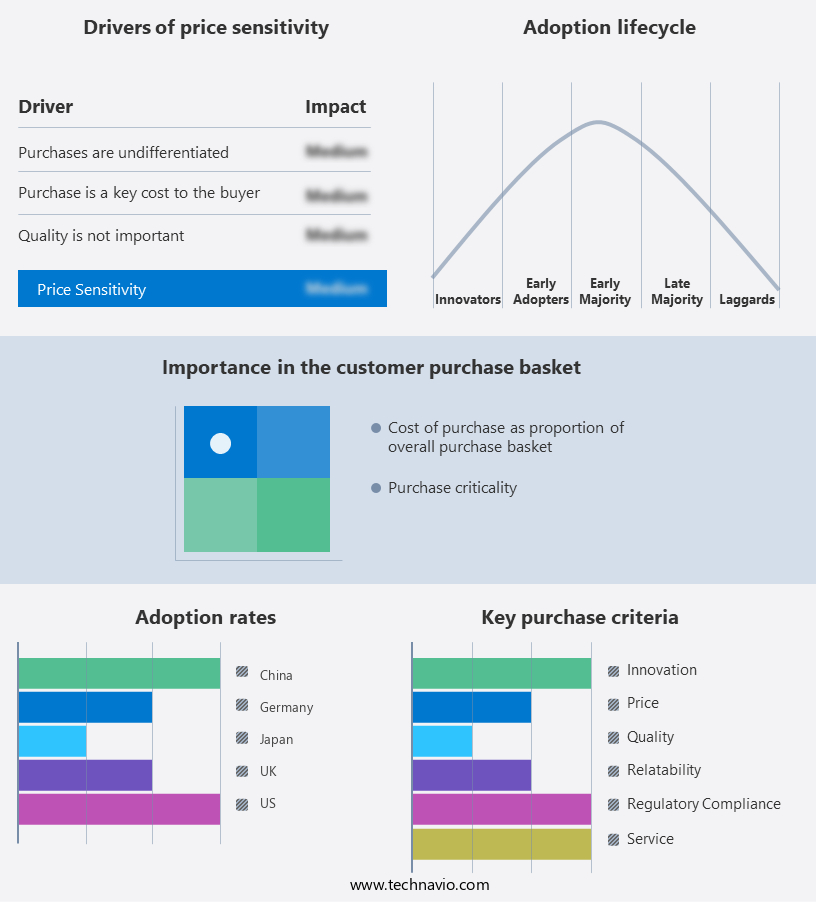
The attenuators market forecasting report includes the adoption lifecycle of the market, covering from the innovator's stage to the laggard's stage. It focuses on adoption rates in different regions based on penetration. Furthermore, the attenuators market report also includes key purchase criteria and drivers of price sensitivity to help companies evaluate and develop their market growth analysis strategies.
Customer Landscape
Key Companies & Market Insights
Companies are implementing various strategies, such as strategic alliances, attenuators market forecast, partnerships, mergers and acquisitions, geographical expansion, and product/service launches, to enhance their presence In the industry.
The industry research and growth report includes detailed analyses of the competitive landscape of the market and information about key companies, including:
- Amphenol Corp.
- Analog Devices Inc.
- Bird
- Eravant
- HUBER SUHNER AG
- HYPERLABS INC.
- Infinite Electronics International, Inc.
- JFW Industries Inc
- MECA Electronics Inc
- Narda MITEQ
- Qorvo Inc.
- Renesas Electronics Corp.
- RF Industries Ltd.
- RF Lambda
- Roho Connector Ltd
- Scientific Components Corp
- Smiths Interconnect Group Ltd
- Spectrum Control Ltd
- TTM Technologies Inc.
- Valtir LLC
Qualitative and quantitative analysis of companies has been conducted to help clients understand the wider business environment as well as the strengths and weaknesses of key industry players. Data is qualitatively analyzed to categorize companies as pure play, category-focused, industry-focused, and diversified; it is quantitatively analyzed to categorize companies as dominant, leading, strong, tentative, and weak.
Research Analyst Overview
Attenuators are essential passive components in modern communication systems, playing a crucial role in managing signal power and ensuring optimal signal integrity. These devices are integral to various applications, including data centers, telecommunications, wireless infrastructure, and digital transformation initiatives. In the context of data transmission, attenuators help maintain signal quality by reducing the amplitude of the signal as it travels through transmission lines. This amplitude reduction is essential for ensuring signal integrity and preventing distortion, particularly in high bandwidth technologies such as 5G and data center applications. Signal power reduction is a critical aspect of attenuator functionality. In a voltage divider network, for instance, attenuators are used to distribute voltage evenly across components.
Semiconductor devices and driver circuitry, such as transistor-transistor logic (TTL), rely on consistent voltage levels to function correctly. Attenuators are also vital in network communication systems, including LTE and 5G networks. In these networks, Quality of Service (QoS) is a primary concern, and attenuators help maintain signal levels and prevent signal degradation. Multi-channel jitter attenuators, in particular, are effective in reducing jitter, ensuring reliable and efficient data transmission. The telecommunications industry has seen significant growth in recent years, driven by the increasing demand for connectivity and the proliferation of IoT and cloud computing. Attenuators have become indispensable components in this sector, with applications ranging from military communications to consumer electronics. In military applications, attenuators are used to protect sensitive communication systems from interference and ensure secure transmission.
In consumer electronics, they help manage signal levels in various devices, from smartphones to smart home systems. The role of attenuators extends beyond traditional telecommunications applications. In the realm of autonomous vehicles, for example, they are used to manage signal levels in various sensors and communication systems, ensuring reliable and efficient operation. In the context of the smart grid, attenuators help manage power flow and ensure consistent voltage levels, enabling the integration of renewable energy sources. Attenuators are also essential in test and measurement applications, where they are used to calibrate communication equipment and ensure accurate measurement of signal levels. In the financial sector, attenuators help maintain signal integrity in high-speed trading systems, ensuring reliable and efficient data transmission.
|
Attenuators Market Scope |
|
|
Report Coverage |
Details |
|
Page number |
212 |
|
Base year |
2023 |
|
Historic period |
2018-2022 |
|
Forecast period |
2024-2028 |
|
Growth momentum & CAGR |
Accelerate at a CAGR of 6.4% |
|
Market Growth 2024-2028 |
USD 434.7 million |
|
Market structure |
Fragmented |
|
YoY growth 2023-2024(%) |
6.2 |
|
Key countries |
US, China, Germany, Japan, and UK |
|
Competitive landscape |
Leading Companies, Market Positioning of Companies, Competitive Strategies, and Industry Risks |
What are the Key Data Covered in this Attenuators Market Research and Growth Report?
- CAGR of the Attenuators industry during the forecast period
- Detailed information on factors that will drive the Attenuators Market growth and forecasting between 2024 and 2028
- Precise estimation of the size of the market and its contribution of the industry in focus to the parent market
- Accurate predictions about upcoming growth and trends and changes in consumer behaviour
- Growth of the market across APAC, North America, Europe, South America, and Middle East and Africa
- Thorough analysis of the market's competitive landscape and detailed information about companies
- Comprehensive analysis of factors that will challenge the attenuators market growth of industry companies
We can help! Our analysts can customize this attenuators market research report to meet your requirements.
 RIA -
RIA - 
