
Automotive E-Commerce Market Size 2025-2029
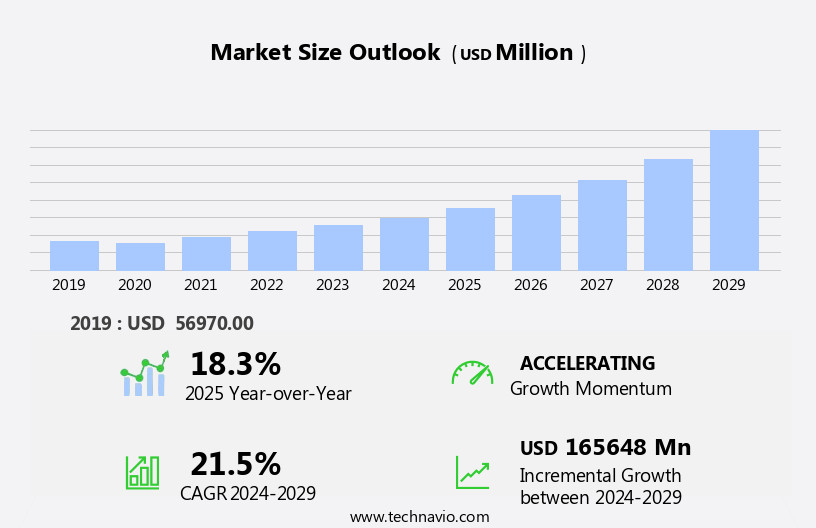
The automotive e-commerce market size is forecast to increase by USD 165.65 billion, at a CAGR of 21.5% between 2024 and 2029.
- The market is experiencing significant growth, driven by the increasing penetration of smartphones and the internet. With more consumers turning to digital platforms for purchasing goods, the automotive industry is following suit. E-commerce platforms facilitate seamless digital payment and order management systems. The convenience of researching and buying automotive parts online, coupled with the availability of multiple payment modes, is making e-commerce an attractive option for both consumers and sellers. However, challenges persist, including the widespread availability of counterfeit automotive parts. This issue poses a significant risk to both consumers and manufacturers, as the use of substandard parts can lead to safety concerns and damage to vehicles.
- Companies looking to capitalize on market opportunities must prioritize authenticity and transparency in their offerings, while also investing in robust security measures to protect against counterfeit products. Effective supply chain management and partnerships with trusted suppliers are essential to maintaining a strong market position. In navigating this dynamic landscape, strategic planning and operational agility will be key to success. Customer data protection and supply chain optimization are crucial components, ensuring secure transactions and efficient logistics.
What will be the Size of the Automotive E-Commerce Market during the forecast period?
Explore in-depth regional segment analysis with market size data - historical 2019-2023 and forecasts 2025-2029 - in the full report.
Request Free Sample
The market continues to evolve, with dynamic market activities unfolding across various sectors. Parts ordering systems are seamlessly integrated into digital platforms, enabling customers to easily purchase necessary components for their vehicles. Customer reviews play a crucial role in influencing purchasing decisions, shaping the market landscape. Influencer marketing and retargeting campaigns are increasingly utilized to reach potential customers, while digital showrooms provide a virtual shopping experience for consumers. Lead generation and sales process automation streamline the buying journey, enhancing the customer experience. Promotional campaigns and special offers are employed to attract and retain customers, with data analytics and marketing automation tools used to optimize pricing strategies and personalize user experiences.
Social media marketing and email marketing are essential channels for reaching diverse customer segments, from luxury car buyers to those in the market for pick-up trucks. Vehicle financing options and leasing deals are offered online, with payment gateways ensuring secure transactions. Customer support is available through various channels, including website chat and phone, to address any concerns or questions. Return processing is streamlined through digital platforms, ensuring a seamless experience for customers. UX and website usability are prioritized to create an intuitive and user-friendly shopping environment. Mobile app development caters to the growing trend of mobile commerce, enabling customers to shop on-the-go. Used car sales and financing options, including extended warranties and lease agreements, expand the market's reach.
How is this Automotive E-Commerce Industry segmented?
The automotive e-commerce industry research report provides comprehensive data (region-wise segment analysis), with forecasts and estimates in "USD million" for the period 2025-2029, as well as historical data from 2019-2023 for the following segments.
- Vehicle Type
- Passenger car
- Two-wheeler
- Commercial vehicle
- Channel
- Aftermarket
- OEM
- Product Type
- Parts and accessories
- Tires and wheels
- Infotainment and electronics
- Interior and exterior accessories
- Tools and garage equipment
- Geography
- North America
- US
- Canada
- Mexico
- Europe
- Germany
- UK
- APAC
- China
- India
- Japan
- South Korea
- South America
- Brazil
- Rest of World (ROW)
- North America
By Vehicle Type Insights
The passenger car segment is estimated to witness significant growth during the forecast period.
The market is experiencing significant growth due to the increasing adoption of digital channels for buying and selling certified pre-owned vehicles, insurance integration, and other related services. E-commerce platforms have become a preferred choice for consumers seeking convenience and a wide selection of options, including luxury cars, pick-up trucks, and hybrid vehicles. These platforms offer features like 3D vehicle configurators, online dealerships, email marketing, and social media marketing to engage customers and facilitate seamless transactions. Customer segmentation and personalization engines enable targeted marketing efforts, while recommendation algorithms and data-driven insights help retailers optimize their inventory management systems and sales forecasting.
The market is witnessing a rise in growth due to the integration of various technologies and services, including data analytics, mobile commerce, and personalization engines, which are transforming the way consumers buy and sell vehicles online. Data-driven insights inform inventory management systems and sales forecasting, optimizing supply chain operations and ensuring a steady flow of stock. Hybrid vehicles and performance metrics are key areas of focus for e-commerce platforms, reflecting the evolving needs of the market. Recommendation algorithms and personalization engines are employed to provide tailored shopping experiences, enhancing customer engagement and loyalty. Content marketing and virtual test drives offer valuable information and interactive experiences, further differentiating e-commerce offerings. The ongoing integration of these elements into the market underscores its continuous dynamism and evolution. Original equipment manufacturers (OEMs) and retailers are capitalizing on the rising Internet penetration to sell passenger cars, hybrid vehicles, and used cars online.
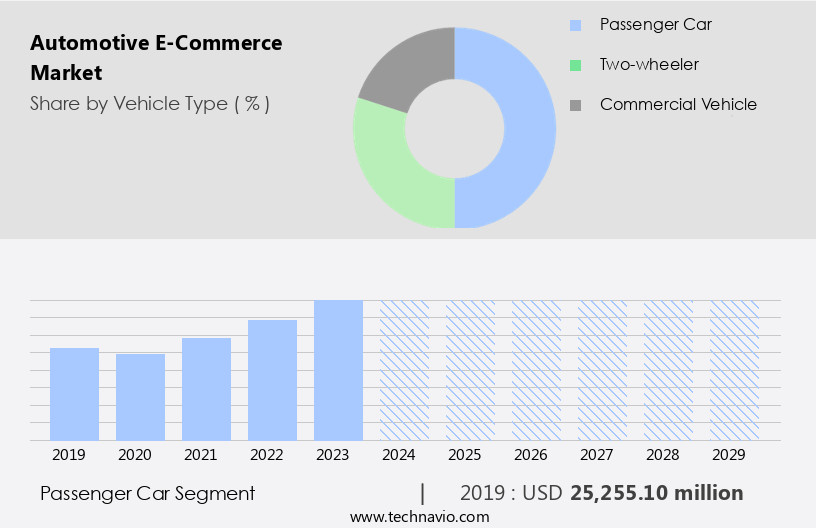
The Passenger car segment was valued at USD 25.26 billion in 2019 and showed a gradual increase during the forecast period.
Payment gateways and vehicle financing platforms ensure a seamless buying experience, while marketing automation and lead generation tools facilitate efficient sales process automation. The integration of delivery logistics, order fulfillment, and customer support services further enhances the customer experience. Moreover, the adoption of mobile commerce and supply chain optimization enables retailers to reach a broader audience and streamline their operations. Content marketing, influencer marketing, and retargeting campaigns are effective strategies for customer engagement and retention. Warranty management and parts ordering systems ensure post-sales support, while customer reviews and sales process automation facilitate trust and transparency. With more consumers turning to digital platforms for convenience and accessibility through e-commerce platforms have become a preferred channel for purchasing parts, accessories, and even vehicles.
Regional Analysis
North America is estimated to contribute 38% to the growth of the global market during the forecast period. Technavio's analysts have elaborately explained the regional trends and drivers that shape the market during the forecast period.
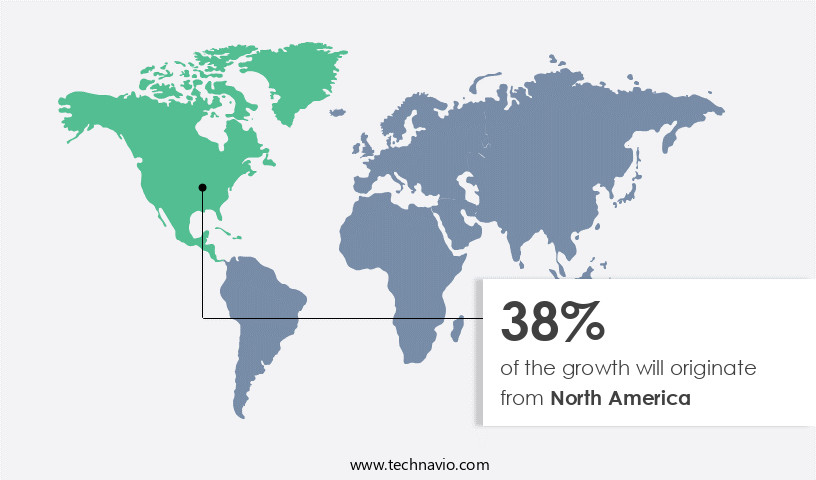
The North American market holds a significant position in the global automotive e-commerce industry, driven by advancements in technology and high consumer adoption of new vehicles. This region is the largest revenue generator in the market, with a strong presence in both the passenger car and commercial vehicle segments. Notably, North America is home to a substantial number of DIY customers who prefer to repair or upgrade their vehicles in their garages. As a result, automotive e-commerce platforms offer a convenient solution for purchasing components and accessories. E-commerce platforms have integrated various features to enhance the customer experience. These include 3D vehicle configurators, online dealerships, email marketing, and social media marketing. Third-party logistics (3PL) providers ensure timely delivery through last-mile services, while fraud detection systems secure online transactions.
Customer segmentation is crucial, with offerings tailored to luxury cars, pick-up trucks, and hybrid vehicles. Data analytics plays a pivotal role in understanding customer behavior and preferences, enabling personalized recommendations and pricing strategies. The market offers various financing options, such as vehicle financing platforms and lease deals. Payment gateways ensure secure transactions, while customer retention is fostered through special offers, affiliate marketing, and marketing automation. Inventory management systems, sales forecasting, and order fulfillment optimize supply chain operations. Digital showrooms, lead generation, and sales process automation streamline the buying process. Return processing, user experience (UX), and website usability are essential for customer satisfaction.
Mobile commerce and mobile app development cater to the increasing use of smartphones for purchasing. Warranty management and parts ordering systems provide peace of mind for customers. Customer reviews, influencer marketing, and retargeting campaigns help build trust and loyalty. Performance metrics, recommendation algorithms, and personalization engines enhance the overall shopping experience. Content marketing and virtual test drives offer valuable information and convenience. The market is data-driven, with insights from data analytics shaping business strategies. The North American market is dynamic and evolving, with a strong focus on enhancing the customer experience and offering convenience. The integration of various features, from 3D vehicle configurators to warranty management, caters to diverse customer needs and preferences.
Market Dynamics
Our researchers analyzed the data with 2024 as the base year, along with the key drivers, trends, and challenges. A holistic analysis of drivers will help companies refine their marketing strategies to gain a competitive advantage.
What are the key market drivers leading to the rise in the adoption of Automotive E-Commerce Industry?
- The increasing prevalence of smartphones and the internet is the primary catalyst fueling market growth. The market is experiencing significant growth due to the increasing use of the Internet and smartphones, enabling consumers to access a wider range of automotive products and services online. This trend is particularly noticeable in emerging economies where Internet penetration and smartphone usage are on the rise, providing consumers in these regions with greater access to offerings previously limited by physical dealerships and showrooms. E-commerce platforms also integrate with online payment gateways, order management systems, and logistics and delivery services to ensure a seamless transaction experience.
- As the market evolves, businesses must adapt to meet the changing needs of consumers. This includes offering seamless online shopping experiences, secure payment processing, and efficient order fulfillment. By leveraging advanced technologies and data-driven insights, automotive e-commerce businesses can enhance the customer experience, foster loyalty, and drive growth. Key market drivers include lease deals, data analytics, payment gateways, and customer retention strategies such as special offers and affiliate marketing. Service scheduling tools, vehicle financing platforms, order fulfillment, marketing automation, inventory management systems, and sales forecasting are also essential components of the automotive e-commerce landscape.
What are the market trends shaping the Automotive E-Commerce Industry?
- The use of multiple payment modes is increasingly becoming a market trend. It is essential for businesses to offer flexibility in payment options to cater to diverse customer preferences. The market is experiencing significant growth, driven by the adoption of advanced payment technology. This technology enables seamless digital transactions, including credit card payments and payments via digital wallets, making online car shopping more accessible to customers. In fact, the global volume of e-payments reached nearly USD 1 trillion in India in 2023, and US digital transactions were valued at USD 1,362 billion in 2024. To remain competitive in this market, retailers must establish partnerships and invest in advanced technology to support e-commerce. Data-driven insights, such as performance metrics, recommendation algorithms, and personalization engines, are also essential for automotive e-commerce players.
- These tools help retailers understand customer behavior and preferences, enabling them to offer targeted promotions and enhance the overall shopping experience. Furthermore, content marketing, virtual test drives, and customer support are crucial elements of a successful e-commerce strategy. Moreover, the integration of hybrid vehicles into the market is a significant trend. As consumers become increasingly environmentally conscious, retailers must adapt to meet their needs. This may involve optimizing supply chain processes and implementing pricing strategies that cater to the unique demands of hybrid vehicles. In summary, the market is dynamic and competitive. Retailers must invest in advanced payment technology, data-driven insights, and customer-focused strategies to succeed. The integration of hybrid vehicles and the continued growth of mobile commerce are key trends to watch.
What challenges does the Automotive E-Commerce Industry face during its growth?
- The proliferation of counterfeit automotive parts poses a significant challenge to the industry's growth, as these substandard components can compromise vehicle safety, reduce performance, and erode consumer trust. The market is experiencing significant growth, driven by advancements in technology and changing consumer preferences. Parts ordering systems have streamlined the purchasing process, enabling customers to easily find and order components and accessories online. Customer reviews play a crucial role in the decision-making process, influencing purchasing decisions and building trust. To increase brand awareness and generate leads, companies utilize influencer marketing and promotional campaigns.
- However, the industry faces challenges, including the prevalence of counterfeit parts. These low-quality components, often sold at lower prices, can negatively impact the reputation of genuine companies and lead to customer dissatisfaction. Return processing is another area of focus for automotive e-commerce businesses, ensuring a smooth and hassle-free experience for customers. By prioritizing user experience, website usability, and addressing industry challenges, companies can build trust and drive sales in the market. Retargeting campaigns help bring back potential customers who have abandoned their shopping carts. Lead generation and sales process automation have become essential for e-commerce businesses to improve efficiency and stay competitive.
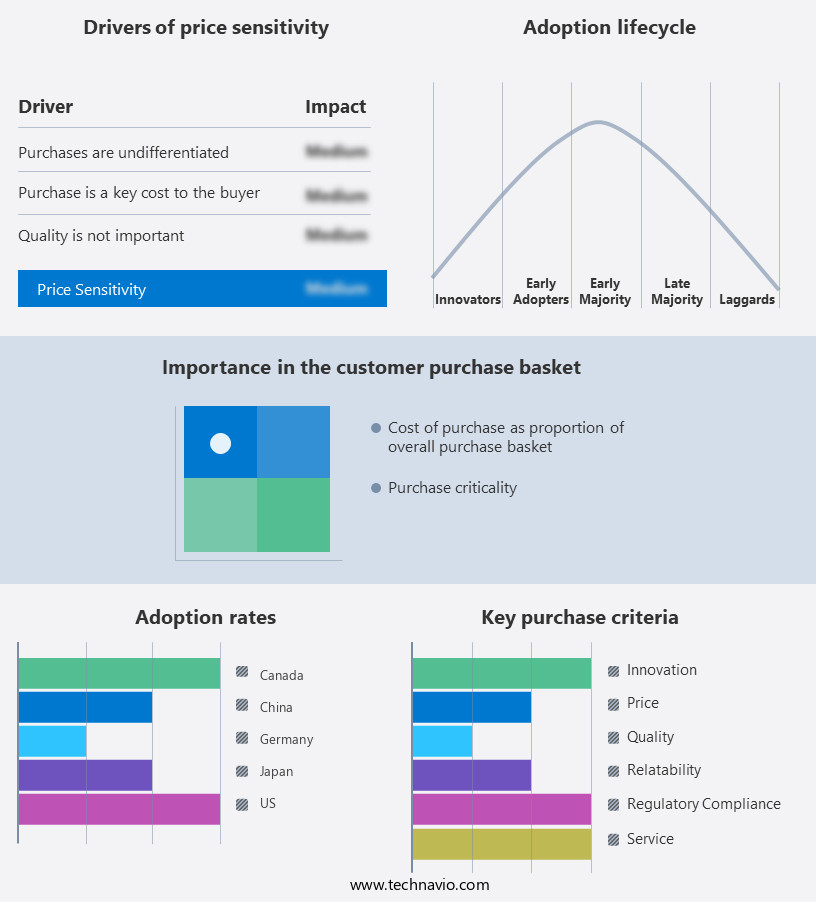
Exclusive Customer Landscape
The automotive e-commerce market forecasting report includes the adoption lifecycle of the market, covering from the innovator's stage to the laggard's stage. It focuses on adoption rates in different regions based on penetration. Furthermore, the automotive e-commerce market report also includes key purchase criteria and drivers of price sensitivity to help companies evaluate and develop their market growth analysis strategies.
Customer Landscape
Key Companies & Market Insights
Companies are implementing various strategies, such as strategic alliances, automotive e-commerce market forecast, partnerships, mergers and acquisitions, geographical expansion, and product/service launches, to enhance their presence in the industry.
Advance Auto Parts Inc. - This company specializes in automotive e-commerce, providing a wide range of offerings including auto parts, brakes, and accessories, enhancing online shopping experiences for customers.
The industry research and growth report includes detailed analyses of the competitive landscape of the market and information about key companies, including:
- Advance Auto Parts Inc.
- Alibaba Group Holding Ltd.
- Amazon.com Inc.
- Arch Auto Parts
- AutoAnything Inc.
- AutoZone Inc.
- CarParts.com Inc.
- CATI S.p.A.
- Delticom AG
- eBay Inc.
- Flipkart Internet Pvt. Ltd.
- Genuine Parts Co.
- Icahn Automotive Group LLC
- ID Auto Inc.
- LKQ Corp.
- O Reilly Automotive Inc.
- Robert Bosch GmbH
- RockAuto LLC
- The Reinalt Thomas Corp.
- Walmart Inc.
Qualitative and quantitative analysis of companies has been conducted to help clients understand the wider business environment as well as the strengths and weaknesses of key industry players. Data is qualitatively analyzed to categorize companies as pure play, category-focused, industry-focused, and diversified; it is quantitatively analyzed to categorize companies as dominant, leading, strong, tentative, and weak.
Recent Development and News in Automotive E-Commerce Market
- In January 2024, Amazon announced the acquisition of Autobytel, a leading automotive marketing and shopping company, for an undisclosed sum. This move aimed to strengthen Amazon's presence in the automotive e-commerce sector (Reuters).
- In March 2024, Carvana, a leading online car buying platform, launched its new home delivery service in Europe, marking its first significant geographic expansion outside the United States (Carvana Press Release).
- In April 2025, Alibaba's auto e-commerce platform, UCAR, raised USD 2 billion in a funding round, led by SoftBank's Vision Fund 2, to expand its offerings and enhance its user experience (Bloomberg).
- In May 2025, Tesla unveiled its new 'Tesla Shop' platform, allowing customers to purchase Tesla-branded merchandise and vehicle accessories directly from the company's website, marking a significant technological advancement in the automotive e-commerce sector (Tesla Press Release).
Research Analyst Overview
The market is witnessing significant advancements, driven by the integration of digital marketing analytics and automated marketing. Dealer ratings and online reviews play a pivotal role in shaping customer perceptions, with fleet management companies leveraging predictive analytics for optimized operations. Autonomous driving features and safety mechanisms are reshaping consumer preferences, leading to an increased focus on maintenance reminders and warranty claims management. AI-powered chatbots and customer journey mapping enable personalized offers and voice commerce, enhancing brand awareness and loyalty. Fuel efficiency and battery technology are key considerations for e-commerce platforms, as consumers seek sustainable and cost-effective solutions. Social listening and reputation management are essential components of an omnichannel strategy, allowing businesses to address customer concerns and improve overall customer experience.
Subscription models and vehicle tracking systems offer flexibility and convenience, while infotainment systems and live chat support cater to evolving consumer demands. Blockchain technology is revolutionizing warranty claims management and parts availability, ensuring transparency and security in transactions. Customer feedback and vehicle connectivity are critical data points for businesses, informing strategic decision-making and driving continuous improvement.
Dive into Technavio's robust research methodology, blending expert interviews, extensive data synthesis, and validated models for unparalleled Automotive E-Commerce Market insights. See full methodology.
|
Market Scope |
|
|
Report Coverage |
Details |
|
Page number |
209 |
|
Base year |
2024 |
|
Historic period |
2019-2023 |
|
Forecast period |
2025-2029 |
|
Growth momentum & CAGR |
Accelerate at a CAGR of 21.5% |
|
Market growth 2025-2029 |
USD 165.65 billion |
|
Market structure |
Fragmented |
|
YoY growth 2024-2025(%) |
18.3 |
|
Key countries |
US, Japan, Canada, India, China, Brazil, Germany, South Korea, Mexico, and UK |
|
Competitive landscape |
Leading Companies, Market Positioning of Companies, Competitive Strategies, and Industry Risks |
What are the Key Data Covered in this Automotive E-Commerce Market Research and Growth Report?
- CAGR of the Automotive E-Commerce industry during the forecast period
- Detailed information on factors that will drive the growth and forecasting between 2025 and 2029
- Precise estimation of the size of the market and its contribution of the industry in focus to the parent market
- Accurate predictions about upcoming growth and trends and changes in consumer behaviour
- Growth of the market across North America, APAC, Europe, South America, and Middle East and Africa
- Thorough analysis of the market's competitive landscape and detailed information about companies
- Comprehensive analysis of factors that will challenge the automotive e-commerce market growth of industry companies
We can help! Our analysts can customize this automotive e-commerce market research report to meet your requirements.
 RIA -
RIA - 
