US Automotive Parts Aftermarket Market Size 2026-2030
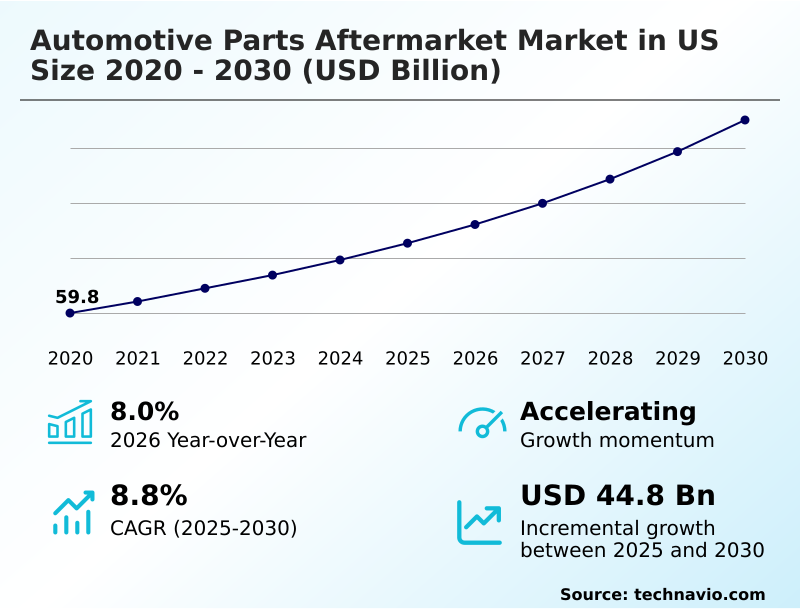
The us automotive parts aftermarket market size is valued to increase by USD 44.8 billion, at a CAGR of 8.8% from 2025 to 2030. Sustained increase in average vehicle age and annual miles traveled will drive the us automotive parts aftermarket market.
Major Market Trends & Insights
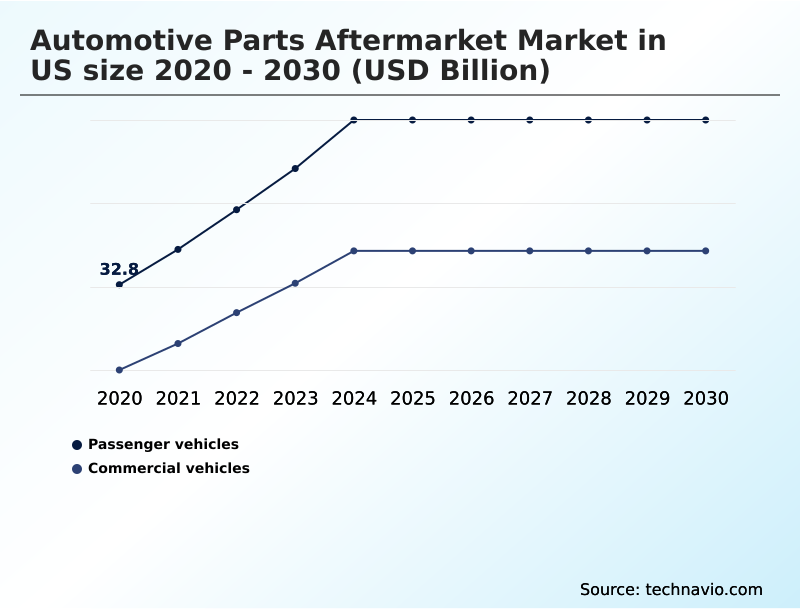
- By Type - Passenger vehicles segment was valued at USD 44 billion in 2024
- By Distribution Channel - Offline segment accounted for the largest market revenue share in 2024
Market Size & Forecast
- Market Opportunities: USD 70.2 billion
- Market Future Opportunities: USD 44.8 billion
- CAGR from 2025 to 2030 : 8.8%
Market Summary
- The automotive parts aftermarket market in us is undergoing a significant transformation, driven by the dual forces of an aging vehicle fleet and rapid technological advancement. The increasing average age of vehicles creates a consistent demand for replacement parts and repair services, particularly as cars exit their warranty periods.
- This dynamic provides a stable foundation for growth across both the do-it-for-me and do-it-yourself channels. Simultaneously, the proliferation of advanced driver-assistance systems, complex electronic control units, and hybrid powertrains introduces new revenue streams and significant challenges.
- For instance, a distributor must now balance inventory between traditional drivetrain components for the existing vehicle parc and high-voltage battery packs for the emerging electric vehicle aftermarket. This requires sophisticated inventory management systems and predictive analytics to forecast demand accurately.
- The rise of e-commerce platforms has further disrupted the market, increasing price transparency and compelling traditional retailers to adopt omnichannel strategies. Navigating this landscape requires a focus on technical training for modern vehicle repair, strategic supply chain logistics, and adapting to the evolving consumer purchasing behavior to maintain a competitive edge and ensure long-term viability in this dynamic sector.
What will be the Size of the US Automotive Parts Aftermarket Market during the forecast period?
Get Key Insights on Market Forecast (PDF) Get Free Sample
How is the US Automotive Parts Aftermarket Market Segmented?
The us automotive parts aftermarket industry research report provides comprehensive data (region-wise segment analysis), with forecasts and estimates in "USD billion" for the period 2026-2030, as well as historical data from 2020-2024 for the following segments.
- Type
- Passenger vehicles
- Commercial vehicles
- Distribution channel
- Offline
- Online
- Channel
- DIFM independent garages
- DIY
- Fleet or commercial service providers
- Geography
- North America
- US
- North America
By Type Insights
The passenger vehicles segment is estimated to witness significant growth during the forecast period.
The passenger vehicles segment, which includes cars, SUVs, and light trucks, constitutes the largest portion of the automotive parts aftermarket market in us.
This dominance is sustained by the sheer size of the light vehicle fleet and the predictable service needs of the aging vehicle parc. Demand is driven by preventative maintenance schedules and the inevitable failure of wear-and-tear components.
The market is bifurcated into the do-it-for-me channel, where professional technicians prioritize parts availability and quality, and the do-it-yourself channel, where cost is a primary motivator, accounting for over 20% of consumer purchases.
The increasing integration of complex electronic control units and in-vehicle infotainment systems is elevating repair costs and steering more work toward professional shops capable of handling advanced diagnostics and sensor calibration.
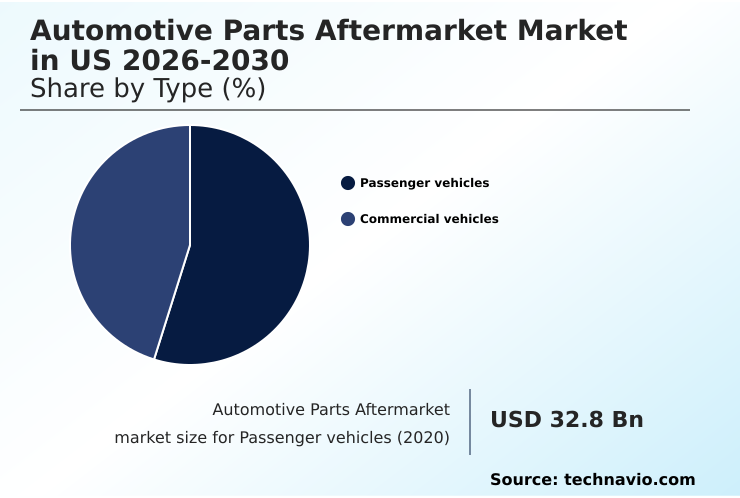
The Passenger vehicles segment was valued at USD 44 billion in 2024 and showed a gradual increase during the forecast period.
Market Dynamics
Our researchers analyzed the data with 2025 as the base year, along with the key drivers, trends, and challenges. A holistic analysis of drivers will help companies refine their marketing strategies to gain a competitive advantage.
- Strategic planning in the automotive parts aftermarket requires a multifaceted approach to address concurrent and often conflicting market forces. Executives are increasingly focused on aftermarket solutions for adas calibration, recognizing it as a high-growth service area, while simultaneously managing inventory for older vehicle models to serve the profitable, high-volume segment of the existing vehicle parc.
- The long-term impact of ev transition on aftermarket demand necessitates a careful pivot in product development and supply chain focus. Companies are evaluating the role of private labels in auto parts retail to improve margins and compete with online players. This is compounded by supply chain challenges for imported auto parts, which are being scrutinized for both cost and resilience.
- Understanding difm channel growth in complex vehicle repair is critical, as it requires investment in technician training and support. At the same time, catering to diy consumer trends for routine maintenance parts remains essential for volume. Success hinges on integrating digital tools for aftermarket part fitment, which can significantly reduce return rates.
- Firms leveraging predictive analytics for aftermarket demand forecasting have reported up to a 25% higher accuracy in stock levels compared to those using traditional methods. This data-driven approach is vital for optimizing logistics for commercial vehicle parts, ensuring compliance with regulatory standards for emission control parts, and exploring aftermarket parts for hybrid vehicle systems.
- The intense price competition between online and offline retailers underscores the need for efficient operations. Addressing training needs for modern vehicle technicians and understanding the impact of right to repair on independent shops are key to building partnerships. Finally, tackling sustainability practices in parts remanufacturing and exploring aftermarket opportunities in battery management systems will define future leaders.
- The challenges of sourcing electronic control units and managing total cost of ownership for fleets represent ongoing strategic imperatives.
What are the key market drivers leading to the rise in the adoption of US Automotive Parts Aftermarket Industry?
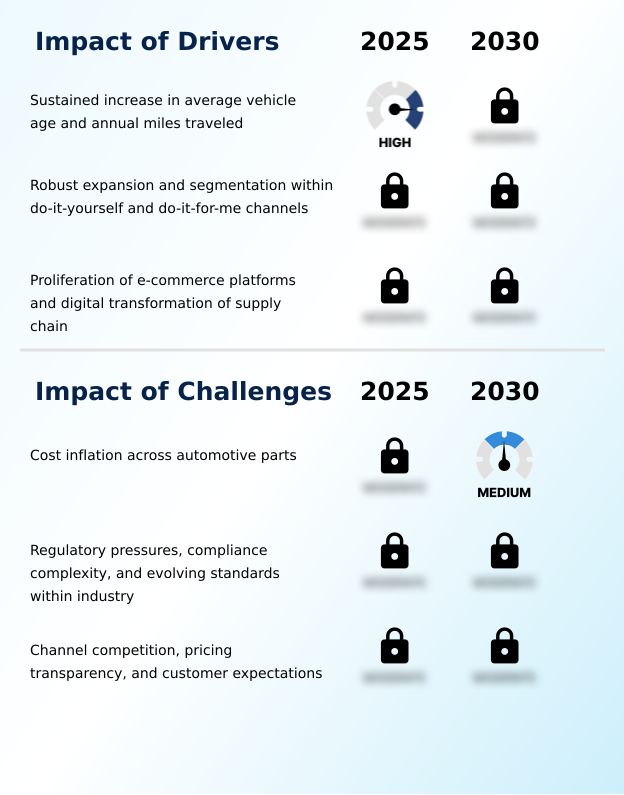
- The market's growth is fundamentally driven by a sustained increase in the average vehicle age and the annual miles traveled by the national fleet.
- The automotive parts aftermarket is primarily propelled by the persistent aging of the vehicle parc and the transformative impact of digitalization.
- Vehicles older than ten years now constitute over half of the active fleet, creating a resilient demand base for replacement parts as these vehicles are well beyond their original warranty periods.
- This dynamic fuels both the do-it-yourself channel and the professional service providers.
- Simultaneously, the rise of e-commerce platforms is a powerful driver of digital transformation, enhancing price transparency for consumers, who report average savings of 15% on common maintenance items purchased online.
- This shift in consumer purchasing behavior is compelling all market participants to adopt robust online strategies and focus on supply chain optimization to ensure rapid parts availability and compete effectively in an increasingly digital marketplace.
What are the market trends shaping the US Automotive Parts Aftermarket Industry?
- The increasing complexity of modern vehicles, alongside the emergence of a specialized aftermarket for advanced systems, is reshaping service and repair landscapes.
- Key trends are reshaping the automotive parts aftermarket, driven by technological evolution and a growing emphasis on sustainability. The proliferation of advanced driver-assistance systems is creating a new, high-growth service category. Post-collision repairs now require complex sensor calibration in over 70% of cases, demanding significant investment in new diagnostic equipment and technical training.
- This trend challenges the capabilities of many independent repair shops. Concurrently, sustainability trends are elevating the importance of the circular economy, with the use of remanufactured parts gaining traction. This practice can reduce raw material consumption by up to 85% for certain powertrain components.
- The gradual shift toward vehicle electrification introduces another layer of change, creating future demand for high-voltage battery packs while threatening the long-term viability of parts related to internal combustion engines, a major powertrain evolution.
What challenges does the US Automotive Parts Aftermarket Industry face during its growth?
- Persistent cost inflation across the automotive parts supply chain presents a key challenge to industry growth and profitability.
- The automotive parts aftermarket confronts significant operational and competitive headwinds, primarily stemming from supply chain volatility and intense channel competition. Global disruptions have led to unpredictable cost inflation and extended lead times, with some critical electronic components seeing availability delays increase by up to 30%. This instability pressures margins and complicates inventory management for distributors and retailers alike.
- Furthermore, navigating complex regulatory compliance standards adds another layer of cost and risk. Companies report dedicating nearly 10% more administrative resources to manage evolving environmental and safety documentation.
- These internal pressures are magnified by external channel competition, where heightened customer expectations for price, speed, and availability require continuous investment in technology and logistics to maintain market share against agile online competitors and traditional brand recognition.
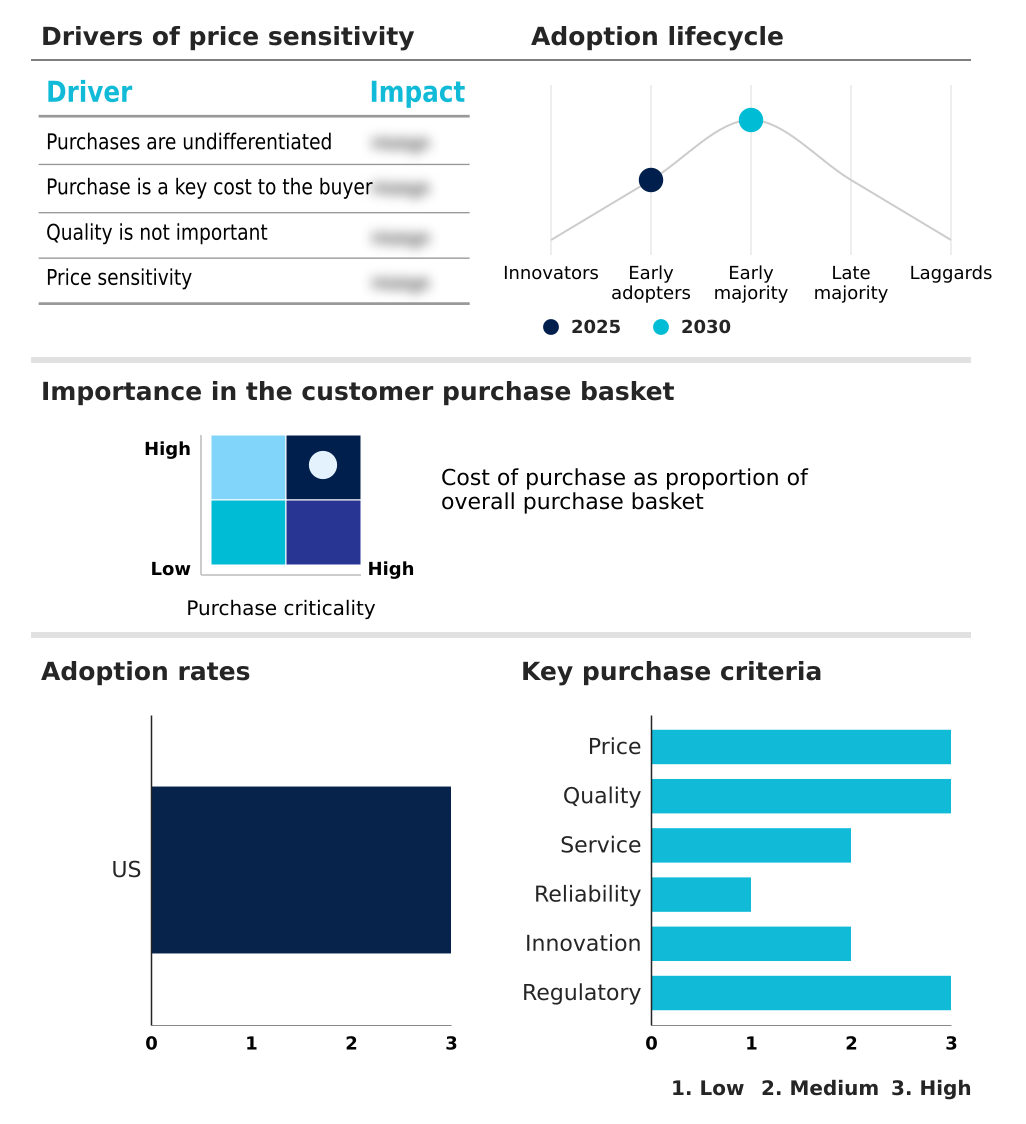
Exclusive Technavio Analysis on Customer Landscape
The us automotive parts aftermarket market forecasting report includes the adoption lifecycle of the market, covering from the innovator’s stage to the laggard’s stage. It focuses on adoption rates in different regions based on penetration. Furthermore, the us automotive parts aftermarket market report also includes key purchase criteria and drivers of price sensitivity to help companies evaluate and develop their market growth analysis strategies.
Customer Landscape of US Automotive Parts Aftermarket Industry
Competitive Landscape
Companies are implementing various strategies, such as strategic alliances, us automotive parts aftermarket market forecast, partnerships, mergers and acquisitions, geographical expansion, and product/service launches, to enhance their presence in the industry.
AISIN Corp. - Key offerings include diverse powertrain and chassis components, spanning remanufactured parts and advanced electronic systems for comprehensive vehicle service and repair.
The industry research and growth report includes detailed analyses of the competitive landscape of the market and information about key companies, including:
- AISIN Corp.
- American Axle Manufacturing
- BorgWarner Inc.
- CARDONE Industries Inc.
- Continental AG
- Dana Inc.
- Dayco LLC
- DENSO Corp.
- Dorman Products Inc.
- First Brands Group LLC
- Gates Industrial Corp. plc
- MAHLE GmbH
- Marelli Holdings Co. Ltd.
- Robert Bosch GmbH
- Standard Motor Products Inc.
- Tenneco Inc.
- TerrePower
- Valeo SA
- Walker Products Inc.
- ZF Friedrichshafen AG
Qualitative and quantitative analysis of companies has been conducted to help clients understand the wider business environment as well as the strengths and weaknesses of key industry players. Data is qualitatively analyzed to categorize companies as pure play, category-focused, industry-focused, and diversified; it is quantitatively analyzed to categorize companies as dominant, leading, strong, tentative, and weak.
Recent Development and News in Us automotive parts aftermarket market
- In August 2024, ZF Friedrichshafen AG launched its Electric Axle Drive Repair Kits in the United States and Canada, enabling independent workshops to service electric vehicles without removing the entire drive unit.
- In February 2025, Advance Auto Parts announced a major network optimization strategy, involving the closure of over 700 store locations and the opening of 100 new stores to better align with evolving consumer purchasing habits.
- In May 2025, AutoZone continued its strategic expansion of the Mega Hub store concept, developing large-format inventory centers to improve parts availability for both DIY customers and professional repair shops.
- In May 2025, BorgWarner Inc. confirmed strong, sustained demand for its traditional engine components, including exhaust and emission control systems, reflecting the continued service needs of the existing internal combustion engine vehicle parc.
Dive into Technavio’s robust research methodology, blending expert interviews, extensive data synthesis, and validated models for unparalleled US Automotive Parts Aftermarket Market insights. See full methodology.
| Market Scope | |
|---|---|
| Page number | 189 |
| Base year | 2025 |
| Historic period | 2020-2024 |
| Forecast period | 2026-2030 |
| Growth momentum & CAGR | Accelerate at a CAGR of 8.8% |
| Market growth 2026-2030 | USD 44.8 billion |
| Market structure | Fragmented |
| YoY growth 2025-2026(%) | 8.0% |
| Key countries | US |
| Competitive landscape | Leading Companies, Market Positioning of Companies, Competitive Strategies, and Industry Risks |
Research Analyst Overview
- The automotive parts aftermarket is a complex ecosystem defined by the dual needs of servicing a vast, aging vehicle parc while adapting to the sophisticated requirements of modern automobiles. Boardroom-level strategy is increasingly focused on the significant capital investment required for diagnostic equipment and technician training to service advanced driver-assistance systems and their intricate sensor calibration needs.
- Workshops investing in this area report up to 40% fewer repair comebacks, a critical metric for profitability. This technological shift affects the entire aftermarket parts catalog, from traditional drivetrain components and powertrain components to emerging categories in the electric vehicle aftermarket like high-voltage battery packs and thermal management systems.
- The market supports a robust trade in remanufactured parts, driven by both cost and sustainability. Key components like ride control products, suspension elements, advanced braking systems, and emission control systems remain staples for both the do-it-for-me channel and do-it-yourself channel.
- Managing stock keeping units across this diverse range, including parts for diesel particulate filtration and selective catalytic reduction, demands highly efficient inventory management systems to ensure parts availability for both light vehicle fleet and commercial vehicle components, influencing everything from tire pressure monitoring to in-vehicle infotainment repairs.
What are the Key Data Covered in this US Automotive Parts Aftermarket Market Research and Growth Report?
-
What is the expected growth of the US Automotive Parts Aftermarket Market between 2026 and 2030?
-
USD 44.8 billion, at a CAGR of 8.8%
-
-
What segmentation does the market report cover?
-
The report is segmented by Type (Passenger vehicles, and Commercial vehicles), Distribution Channel (Offline, and Online), Channel (DIFM independent garages, DIY, and Fleet or commercial service providers) and Geography (North America)
-
-
Which regions are analyzed in the report?
-
North America
-
-
What are the key growth drivers and market challenges?
-
Sustained increase in average vehicle age and annual miles traveled, Cost inflation across automotive parts
-
-
Who are the major players in the US Automotive Parts Aftermarket Market?
-
AISIN Corp., American Axle Manufacturing, BorgWarner Inc., CARDONE Industries Inc., Continental AG, Dana Inc., Dayco LLC, DENSO Corp., Dorman Products Inc., First Brands Group LLC, Gates Industrial Corp. plc, MAHLE GmbH, Marelli Holdings Co. Ltd., Robert Bosch GmbH, Standard Motor Products Inc., Tenneco Inc., TerrePower, Valeo SA, Walker Products Inc. and ZF Friedrichshafen AG
-
Market Research Insights
- The dynamics of the automotive parts aftermarket market in us are increasingly influenced by digital transformation and evolving customer expectations. The growth of e-commerce platforms has intensified price transparency, with studies showing that savvy consumers can find price variances of up to 15% for identical replacement parts by comparing online retailers.
- This forces all players to refine their pricing and value propositions. In response, leading firms are implementing omnichannel retail strategies that have proven to reduce order fulfillment times for professional service providers by over 20% in key urban markets. Meeting heightened customer expectations now depends on a blend of competitive pricing, rapid last-mile delivery, and deep inventory.
- Success hinges on leveraging data for supply chain optimization and aligning service models with the distinct needs of both DIY enthusiasts and time-sensitive independent repair shops.
We can help! Our analysts can customize this us automotive parts aftermarket market research report to meet your requirements.
 RIA -
RIA - 
