
North America Automotive Transmission Dynamometer Market Size 2025-2029
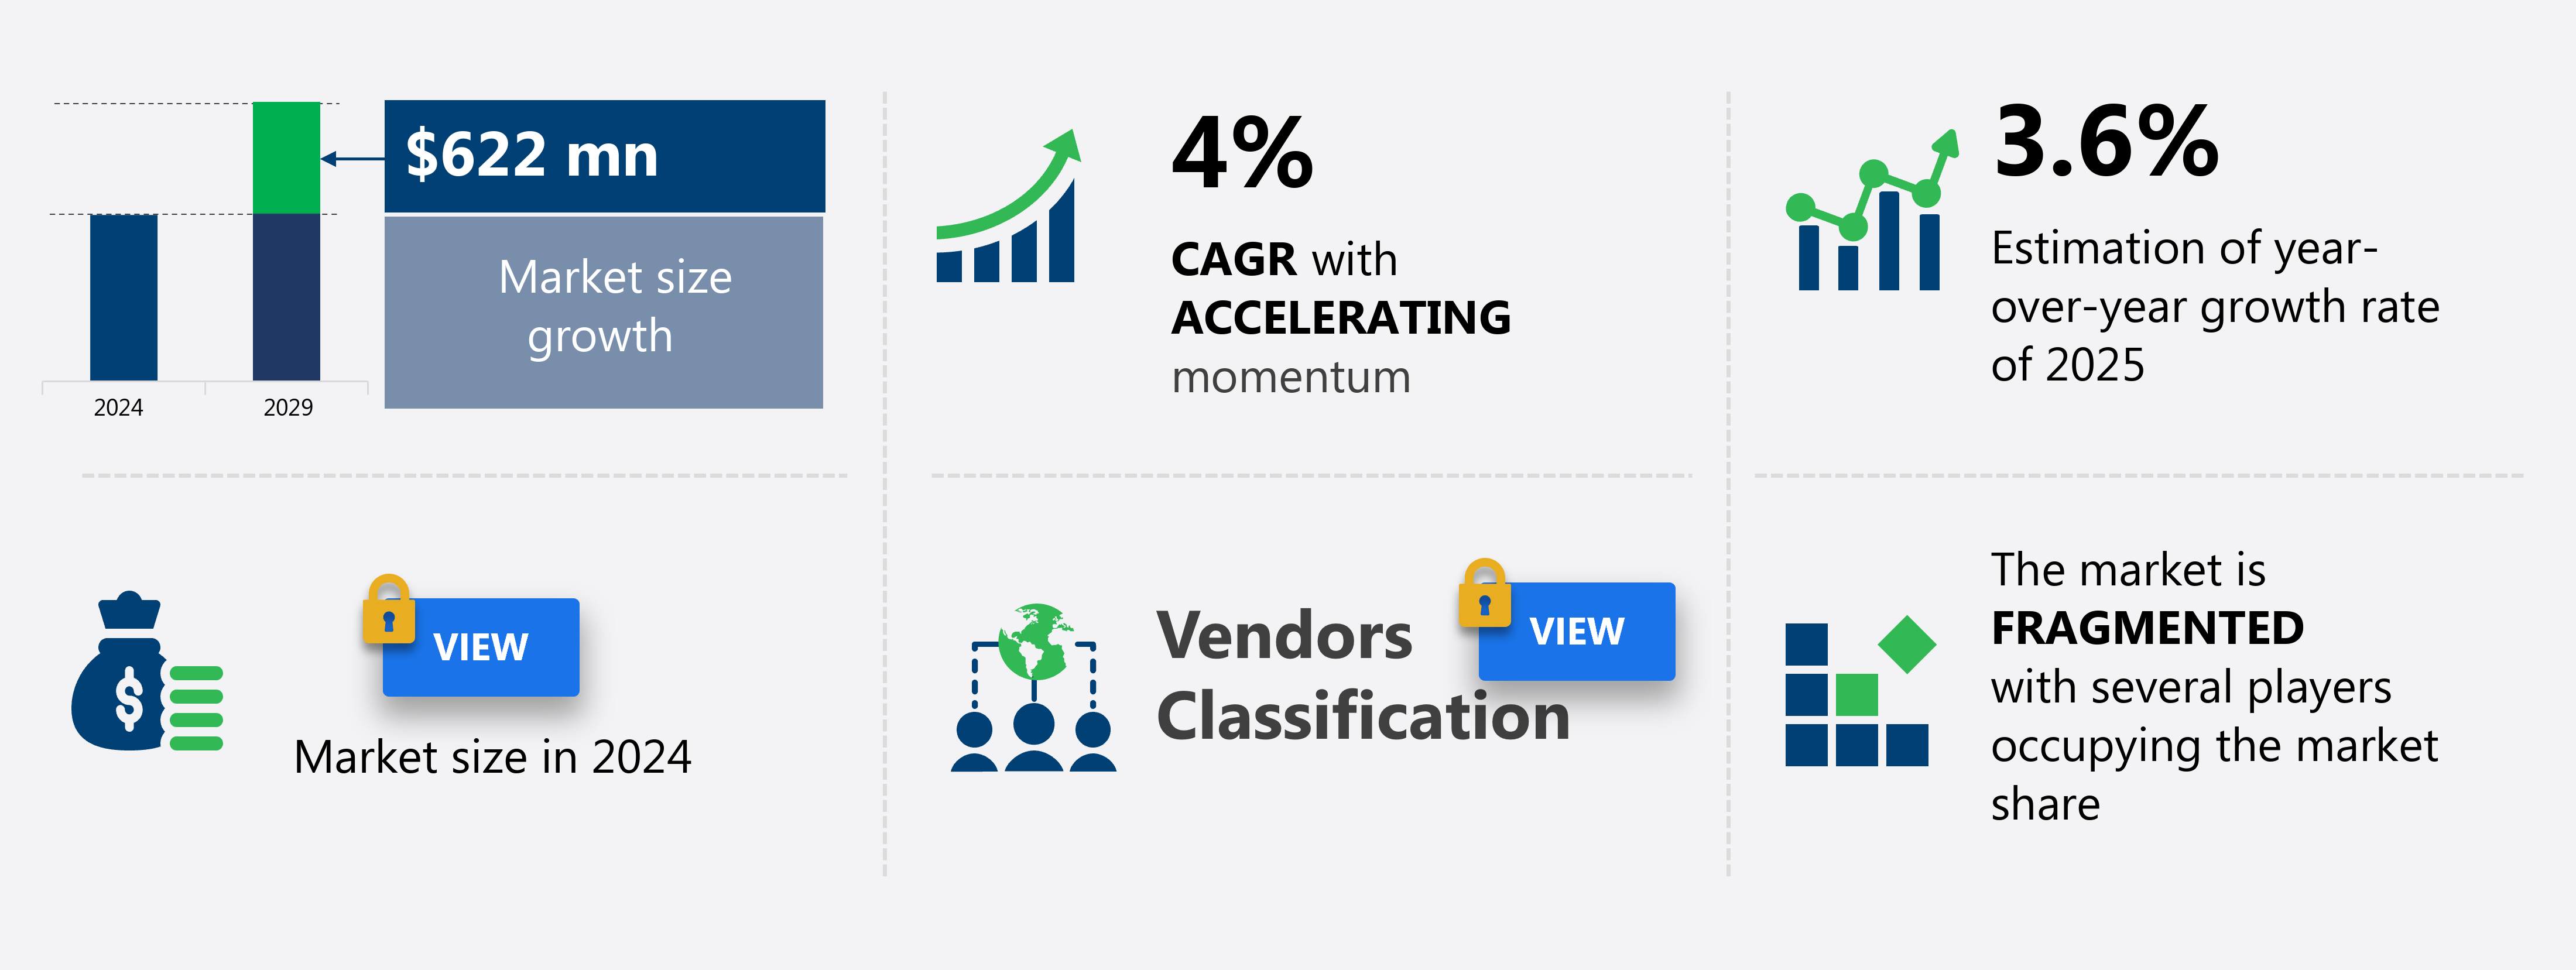
The North America automotive transmission dynamometer market size is forecast to increase by USD 622 million at a CAGR of 4% between 2024 and 2029.
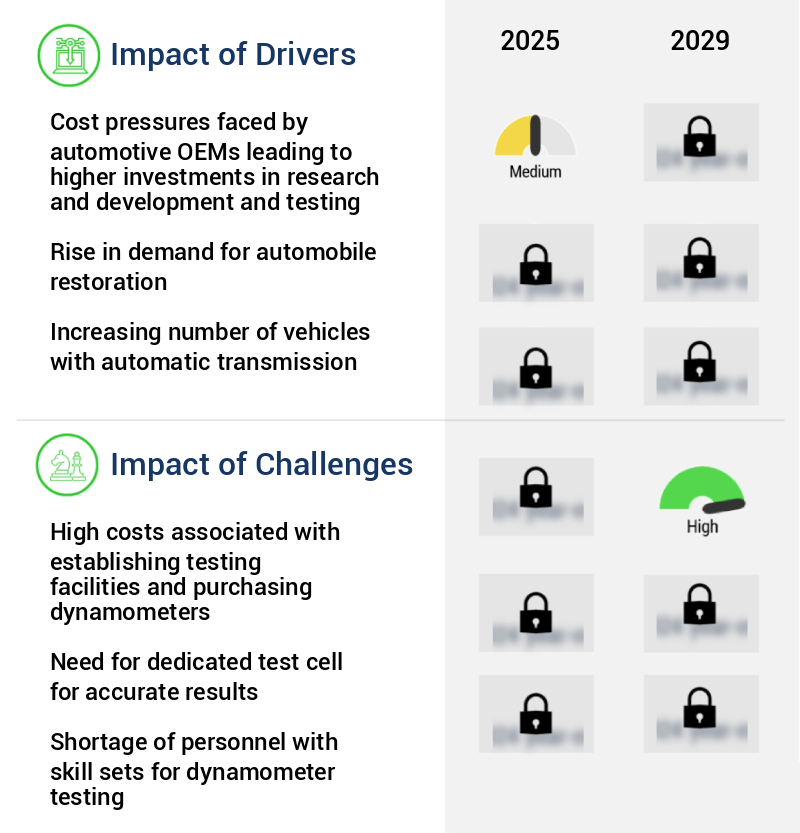
- The Automotive Transmission Dynamometer Market is driven by cost pressures faced by Original Equipment Manufacturers (OEMs), compelling them to invest heavily in research and development and testing to meet stringent emission norms. Governments worldwide are enforcing stricter regulations to reduce carbon emissions, necessitating the use of advanced testing technologies. However, the high costs associated with establishing testing facilities and purchasing dynamometers pose significant challenges for market participants. These expenses hinder smaller players from entering the market and limit their growth potential. Deep learning and high-definition mapping are essential for optimizing routes and improving safety.
- To capitalize on the market opportunities and navigate these challenges effectively, companies must focus on innovation, cost optimization, and strategic partnerships. By investing in advanced testing solutions and collaborating with technology providers and regulatory bodies, market players can stay ahead of the competition and ensure the production of compliant and efficient transmission systems. Additionally, the continuous evolution of transmission technologies and the increasing demand for electric and hybrid vehicles further complicate the competitive landscape. The integration of various technologies, including safety standards, connectivity, machine learning, and cloud computing, is essential for the successful deployment of autonomous vehicles in various sectors.
What will be the size of the North America Automotive Transmission Dynamometer Market during the forecast period?
Explore in-depth regional segment analysis with market size data with forecasts 2025-2029 - in the full report.
Request Free Sample
- The automotive transmission dynamometer market is a critical segment within the automotive industry, continuously evolving to meet the demands of advanced powertrain technologies. Transmission efficiency and power loss reduction are key focuses, with torque ripple minimization a significant challenge. For instance, a leading automaker achieved a 10% improvement in shift smoothness through rigorous dynamometer testing. Industry growth is anticipated to reach 5% annually, driven by the increasing prevalence of electric and hybrid vehicles. Transmission dynamometers play a pivotal role in testing these powertrains, ensuring system reliability and adherence to testing standards. Powertrain control, acoustic noise reduction, and data logging are essential features for these devices.
- Material strength, cooling system efficiency, and real-time control are crucial considerations in hardware validation. Transmission efficiency, thermal stress, and gear ratio testing are essential for engine testing, while hydraulic system and actuator testing ensure optimal performance. CVT testing is vital for electric vehicle applications, and software validation is crucial for powertrain control systems. Overall, the market for automotive transmission dynamometers remains a dynamic and essential sector in the automotive industry. System integration, data security, and privacy are essential considerations for the successful deployment of connected car technologies, including API integration, charging networks, and cloud platforms.
How is this North America Automotive Transmission Dynamometer Market segmented?
The North America automotive transmission dynamometer market research report provides comprehensive data (region-wise segment analysis), with forecasts and estimates in "USD million" for the period 2025-2029,for the following segments.
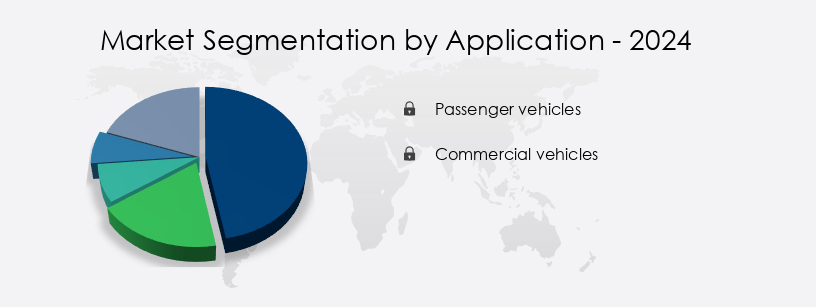
- Application
- Passenger vehicles
- Commercial vehicles
- End-user
- Automotive testing centers and body shops
- Automotive tier-1 suppliers
- Automotive OEMs
- Type
- Chassis dynamometer
- Engine dynamometer
- Transmission dynamometer
- Geography
- North America
- US
- Canada
- Mexico
- North America
By Application Insights
The Passenger vehicles segment is estimated to witness significant growth during the forecast period. In the realm of passenger vehicle manufacturing, transmission systems play a pivotal role in delivering optimal driving experiences. To ensure these transmissions meet stringent industry standards and consumer expectations, dynamometer testing is an indispensable process. Engineers employ dynamometers to simulate various driving conditions, assess gear shifts, and evaluate overall transmission performance. This comprehensive testing ensures that transmissions exhibit smooth shifts, improved efficiency, and enhanced vehicle dynamics. Advanced dynamometer testing also enables the optimization of rotational speed, operational efficiency, data analysis software, thermal management, friction coefficient, and fuel consumption. Furthermore, it facilitates the development of control algorithms, lubricant testing, gear shift analysis, and component durability. Functional safety, job displacement, and network security are ongoing concerns as the market evolves.
Leading automotive companies, including major OEMs, heavily invest in the latest dynamometer technologies to stay competitive in the market. Machine learning algorithms, GPS navigation, data analytics, motion planning, 5G connectivity, parking assist, software-defined vehicles, autonomous trucks, object detection, cloud computing, and lane keeping assist are seamlessly integrated into complete systems. Additionally, the market is expected to grow by 12% in the following five years, as automotive manufacturers continue to prioritize the development of advanced transmission systems. Dynamometer testing plays a crucial role in the design, development, and production of transmission systems for passenger vehicles. By simulating various driving conditions and evaluating transmission performance, engineers can optimize fuel efficiency, improve vehicle dynamics, and ensure the durability and reliability of transmissions.
Market Dynamics
Our researchers analyzed the data with 2024 as the base year, along with the key drivers, trends, and challenges. A holistic analysis of drivers will help companies refine their marketing strategies to gain a competitive advantage. The Automotive Transmission Dynamometer Market in North America is experiencing rapid growth driven by the increasing demand for vibration testing and improved vehicle performance evaluation. Manufacturers are investing heavily in automatic transmission and manual transmission systems, with a strong emphasis on electric vehicle testing and hybrid vehicle testing to meet evolving consumer preferences. Innovations in transmission dynamometer test procedures and automated transmission testing systems are enhancing accuracy, supported by dynamometer data analysis techniques and advanced powertrain simulation models.
The industry is adopting electric vehicle transmission testing protocols and hybrid vehicle transmission durability testing to ensure reliability. Efforts in automotive transmission efficiency improvements and advanced dynamometer control algorithms are crucial to achieving regulatory compliance with transmission testing standards and certifications. Key advancements include high-speed data acquisition system for dynamometers and precise torque measurement in transmission testing, which enable superior testing capabilities. Advanced technologies, including edge computing, sensor fusion, machine learning, computer vision, and artificial intelligence, are integral to the functionality of these vehicles.
Additionally, vehicle dynamics simulation and validation, NVH testing techniques for automated transmissions, and friction and wear analysis in transmission testing play a vital role in enhancing system performance. Market trends highlight gear shift quality assessment methods, transmission lubricant performance testing methods, thermal management optimization in dynamometer testing, and accurate clutch performance measurement techniques. Integrating advanced data analysis software for dynamometers helps address system integration challenges in dynamometer testing effectively, ensuring reliable and efficient automotive transmission systems
What are the North America Automotive Transmission Dynamometer Market drivers leading to the rise in adoption of the Industry?
- The cost pressures encountered by automotive Original Equipment Manufacturers (OEMs) necessitate substantial investments in research and development, as well as rigorous testing, serving as the primary market driver. The automotive transmission dynamometer market experiences significant pressure from automotive original equipment manufacturers (OEMs). Amidst the dynamic regulatory environment and consumer demands, OEMs face increasing costs due to compliance with emission and safety standards.
- The global automotive industry anticipates a growth of approximately 5% in the upcoming years, necessitating continuous innovation and cost optimization efforts from OEMs. For instance, the implementation of these regulations can add up to 10% to the cost of a vehicle. To mitigate these costs, OEMs invest in research and development, focusing on cost-reducing processes and technologies.
What are the North America Automotive Transmission Dynamometer Market trends shaping the Industry?
- Government agencies are mandating the enforcement of newer emission norms, establishing a market trend in the industry. The automotive transmission dynamometer market is poised for growth due to increasing demand for emission-compliant vehicles. New norms, such as CAFE regulations in the US and Euro 7 emission standard in Europe, will necessitate investments in research and development of new powertrain and diesel engine technology.
- Moreover, the industry is projected to expand at a steady pace, with experts anticipating a significant growth rate. This technological advancement will indirectly fuel the market for automotive transmission dynamometers. For instance, the shift towards cleaner engines may lead to a 15% increase in sales for advanced testing technologies.
How does the North America Automotive Transmission Dynamometer Market face challenges during its growth?
- The establishment of testing facilities and procurement of dynamometers entails significant expenses, posing a significant challenge to the industry's growth trajectory. The high cost of dynamometers and the expense of establishing testing facilities make this equipment a significant investment for small automotive body shops, which often handle component alterations and engine and transmission upgrades. These processes necessitate dynamometer testing. Moreover, stringent emission norms and power efficiency mandates necessitate whole vehicle testing on chassis dynamometers to ensure compliance.
- For instance, a leading automotive OEM reported a 15% increase in transmission testing activities in their R&D center last year, underscoring the market's growth potential. The increasing complexity of modern powertrain systems has fueled the demand for advanced instrumentation and test systems. In parallel, the development of key powertrain components, such as engines and transmissions, necessitates transmission and powertrain testing at the earliest stages. According to industry reports, the global automotive transmission dynamometer market is expected to grow by over 12% in the next five years, reflecting the increasing demand for dynamometer testing in the automotive industry.
Exclusive North America Automotive Transmission Dynamometer Market Customer Landscape
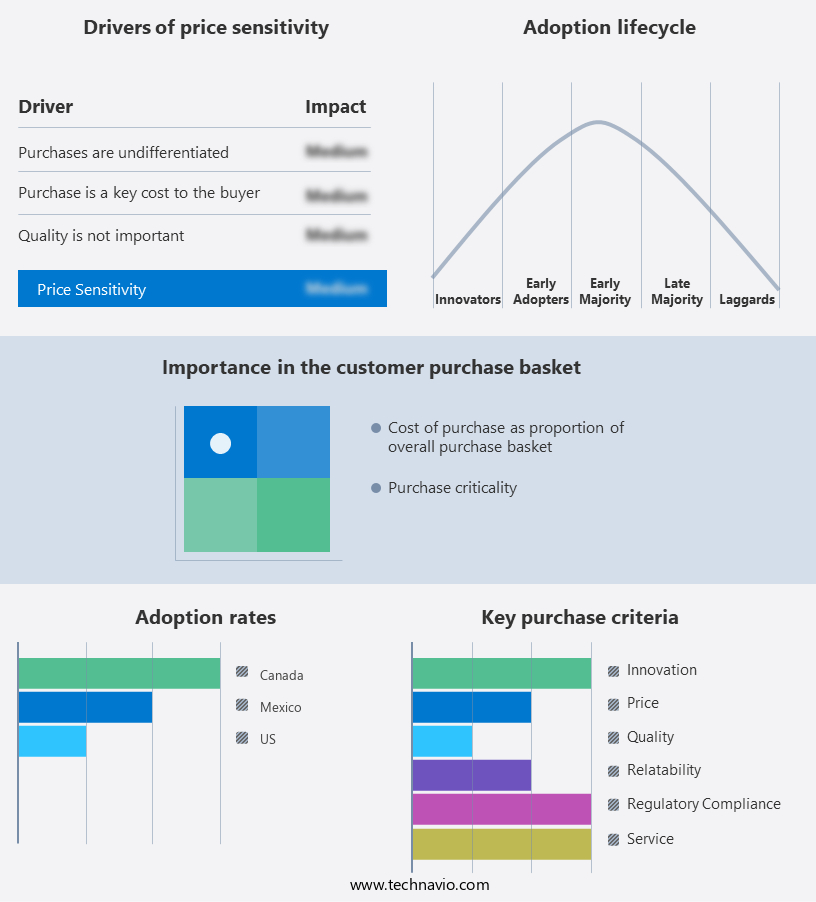
The North America automotive transmission dynamometer market forecasting report includes the adoption lifecycle of the market, covering from the innovator's stage to the laggard's stage. It focuses on adoption rates in different regions based on penetration. Furthermore, the report also includes key purchase criteria and drivers of price sensitivity to help companies evaluate and develop their market growth analysis strategies.
Customer Landscape
Key Companies & Market Insights
Companies are implementing various strategies, such as strategic alliances, market forecast partnerships, mergers and acquisitions, geographical expansion, and product/service launches, to enhance their presence in the market.
A and D Technology - The company specializes in providing advanced automotive transmission dynamometers, including EC and AC models.
The North America automotive transmission dynamometer market research and growth report includes detailed analyses of the competitive landscape of the market and information about key companies, including:
- A and D Technology
- Ascential Technologies
- AVL List GmbH
- Dyno One Inc.
- FEV Group GmbH
- Force Control Industries Inc.
- Froude Inc.
- HORIBA Ltd.
- Kinergo
- LINK ENGINEERING Co.
- Meidensha Corp.
- Mustang Advanced Engineering
- Phoenix Dynamometer Technologies LLC
- Power Test LLC
- Taylor Dynamometer
- Unico LLC
Qualitative and quantitative analysis of companies has been conducted to help clients understand the wider business environment as well as the strengths and weaknesses of key market players. Data is qualitatively analyzed to categorize companies as pure play, category-focused, industry-focused, and diversified; it is quantitatively analyzed to categorize companies as dominant, leading, strong, tentative, and weak.
Recent Development and News in Automotive Transmission Dynamometer Market In North America
- In January 2024, Schaeffler AG, a leading automotive and industrial supplier, announced the launch of its new transmission dynamometer, the MQ 800-1250, at the Automechanika Frankfurt trade fair (source: Schaeffler AG press release).
- In March 2024, Siemens Energy and Mahle GmbH entered into a strategic partnership to develop and manufacture advanced transmission dynamometers for the testing of electric and hybrid vehicle powertrains (source: Siemens Energy press release).
- In May 2024, AVL List GmbH, a global leader in the development, simulation, and testing technology of powertrains, announced the acquisition of DYNA-X, a US-based dynamometer testing and calibration services provider (source: AVL List GmbH press release).
- In April 2025, Bosch Rexroth, a leading supplier of industrial and factory automation technology, unveiled its new modular transmission dynamometer system, the HBM 638, at the Hannover Messe trade fair (source: Bosch Rexroth press release).
Research Analyst Overview
The automotive transmission dynamometer market continues to evolve, driven by the relentless pursuit of improved shift quality, efficiency, and durability in vehicle powertrains. This market encompasses a range of applications, from fatigue testing and thermal management to friction coefficient measurement and NVH testing. For instance, a leading automaker recently reported a 15% increase in operational efficiency by optimizing transmission shift timing through data analysis software and simulation modeling. Moreover, the market's dynamic nature is reflected in the ongoing development of advanced control algorithms and system integration, enabling seamless drivetrain dynamics and clutch performance. Transmission testing plays a pivotal role in ensuring powertrain efficiency, with torque measurement and load testing crucial components of the validation process.
Fuel consumption remains a significant focus, with the industry anticipating a 7% annual growth rate in the coming years due to the increasing demand for eco-friendly technologies. Simulation modeling and stress analysis are essential tools in the quest for powertrain efficiency, while emission testing and test automation ensure regulatory compliance. Dynamometer testing also encompasses fluid dynamics, wear testing, and calibration procedures, all contributing to the overall durability and performance of automotive transmissions. The market's continuous evolution underscores the importance of data acquisition, analysis, and interpretation in driving innovation and improving vehicle dynamics.
Dive into Technavio's robust research methodology, blending expert interviews, extensive data synthesis, and validated models for unparalleled Automotive Transmission Dynamometer Market in North America insights. See full methodology.
|
Market Scope |
|
|
Report Coverage |
Details |
|
Page number |
190 |
|
Base year |
2024 |
|
Forecast period |
2025-2029 |
|
Growth momentum & CAGR |
Accelerate at a CAGR of 4% |
|
Market growth 2025-2029 |
USD 622 million |
|
Market structure |
Fragmented |
|
YoY growth 2024-2025(%) |
3.6 |
|
Competitive landscape |
Leading Companies, Market Positioning of Companies, Competitive Strategies, and Industry Risks |
What are the Key Data Covered in this Market Research Report?
- CAGR of the market during the forecast period
- Detailed information on factors that will drive the market growth and forecasting between 2025 and 2029
- Precise estimation of the size of the market and its contribution of the market in focus to the parent market
- Accurate predictions about upcoming market growth and trends and changes in consumer behaviour
- Growth of the market across North America
- Thorough analysis of the market's competitive landscape and detailed information about companies
- Comprehensive analysis of factors that will challenge the growth of market companies
We can help! Our analysts can customize this market research report to meet your requirements Get in touch
 RIA -
RIA - 
