Autonomous Cars Software Market Analysis North America, Europe, APAC, South America, Middle East and Africa - US, China, Japan, South Korea, Germany - Size and Forecast 2024-2028

Autonomous Cars Software Market Analysis North America, Europe, APAC, South America, Middle East and Africa - US, China, Japan, South Korea, Germany - Size and Forecast 2024-2028

Published: Nov 2023 173 Pages SKU: IRTNTR43256

Market Overview at a Glance

$9.18 B
Market Opportunity
39.04%
CAGR
37.85
YoY growth 2023-2024(%)

Autonomous Cars Software Market Size 2024-2028

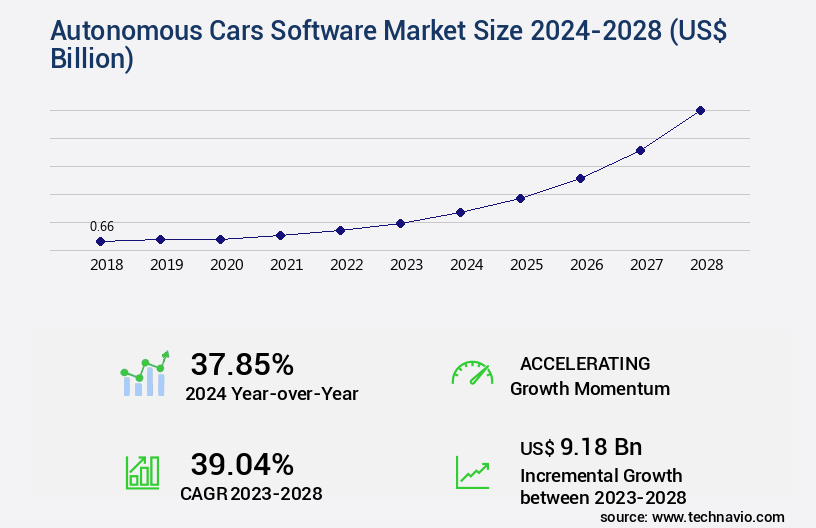
The autonomous cars software market size is valued to increase by USD 9.18 billion, at a CAGR of 39.04% from 2023 to 2028. Increasing demand for autonomy of vehicles by OEMs will drive the autonomous cars software market.

Major Market Trends & Insights

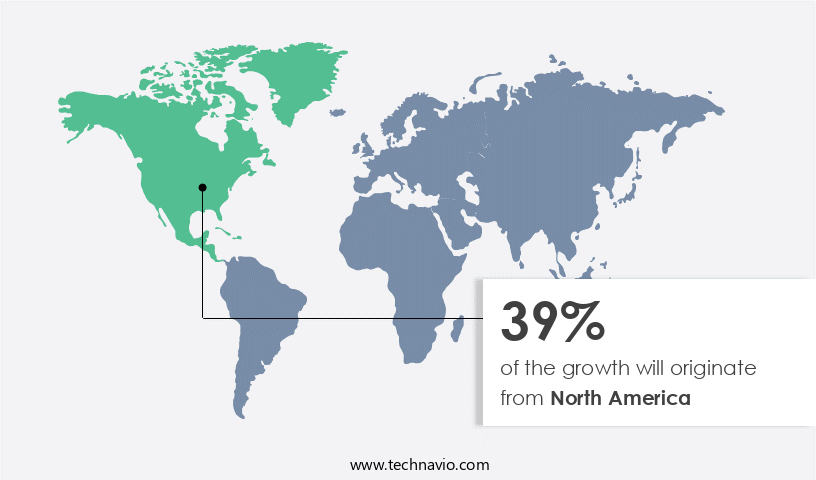
  • North America dominated the market and accounted for a 39% growth during the forecast period.
  • By Type - Proprietary software segment was valued at USD 0.58 billion in 2022
  • By Product - Level 3 autonomous cars segment accounted for the largest market revenue share in 2022

Market Size & Forecast

  • Market Opportunities: USD 0 billion
  • Market Future Opportunities: USD 0 billion
  • CAGR from 2023 to 2028 : 39.04%

Market Summary

  • Autonomous cars, powered by advanced software systems, are revolutionizing the automotive industry with their promise of enhanced safety, efficiency, and convenience. The global market for autonomous cars software is driven by the increasing demand from Original Equipment Manufacturers (OEMs) for greater vehicle autonomy. This trend is further fueled by the adoption of cloud-based high definition (HD) maps, which enable real-time data processing and improved situational awareness. Despite these advancements, the market faces challenges, particularly in developing countries where the infrastructure required for autonomous vehicles is still lacking. However, in developed markets, the benefits of autonomous cars software are already being felt.
  • For instance, a leading logistics company optimized its supply chain by integrating autonomous trucks into its fleet, resulting in a significant reduction in error rates and an uptick in operational efficiency. According to recent studies, the implementation of autonomous cars software has led to a 20% reduction in fuel consumption and a 15% decrease in maintenance costs. These efficiency gains, coupled with the potential for increased safety, make a compelling case for the widespread adoption of autonomous cars. As the technology continues to evolve, it is poised to transform the automotive industry and redefine the way we travel.

What will be the Size of the Autonomous Cars Software Market during the forecast period?

Autonomous Cars Software Market Size

Get Key Insights on Market Forecast (PDF) Request Free Sample

How is the Autonomous Cars Software Market Segmented ?

The autonomous cars software industry research report provides comprehensive data (region-wise segment analysis), with forecasts and estimates in "USD billion" for the period 2024-2028, as well as historical data from 2018-2022 for the following segments.

  • Type
    • Proprietary software
    • Open-source software
  • Product
    • Level 3 autonomous cars
    • Level 4 autonomous cars
    • Level 5 autonomous cars
  • Geography
    • North America
      • US
    • Europe
      • Germany
    • APAC
      • China
      • Japan
      • South Korea
    • Rest of World (ROW)

By Type Insights

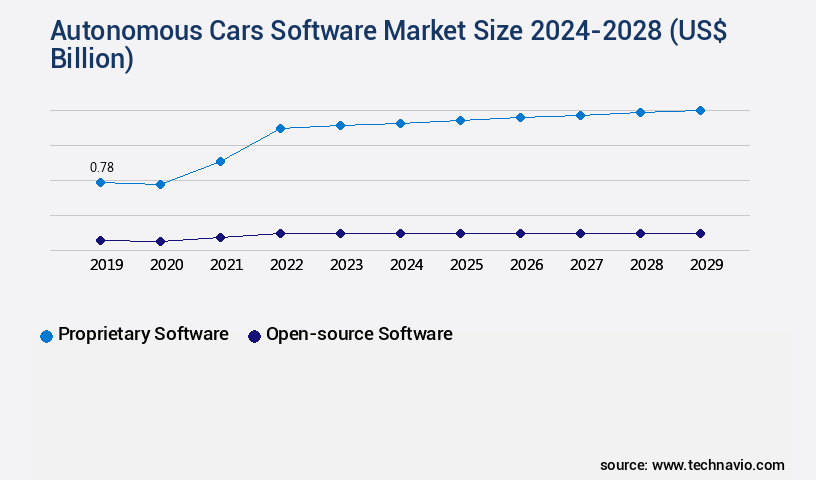
The proprietary software segment is estimated to witness significant growth during the forecast period.

The market continues to evolve, integrating advanced technologies such as edge computing solutions, machine learning algorithms, and vehicle-to-everything (v2x) communication. Computer vision processing, over-the-air updates, and deep learning models are crucial components of autonomous navigation systems. Software architecture design employs sensor fusion techniques, high-definition mapping, simulation testing environments, and radar and lidar sensor data for path planning and localization. Performance benchmarks, GPS data integration, and scalable software solutions ensure functionality and safety. Autonomous vehicles rely on automated driving functions, system verification methods, and modular software design for cybersecurity and functional safety standards.

Cloud computing infrastructure and data analytics platforms process camera sensor data, enabling software defined vehicles and software integration testing. Object detection algorithms and functional safety standards contribute to error reduction, with one study reporting a 20% improvement in error detection rates.

Autonomous Cars Software Market Size

Request Free Sample

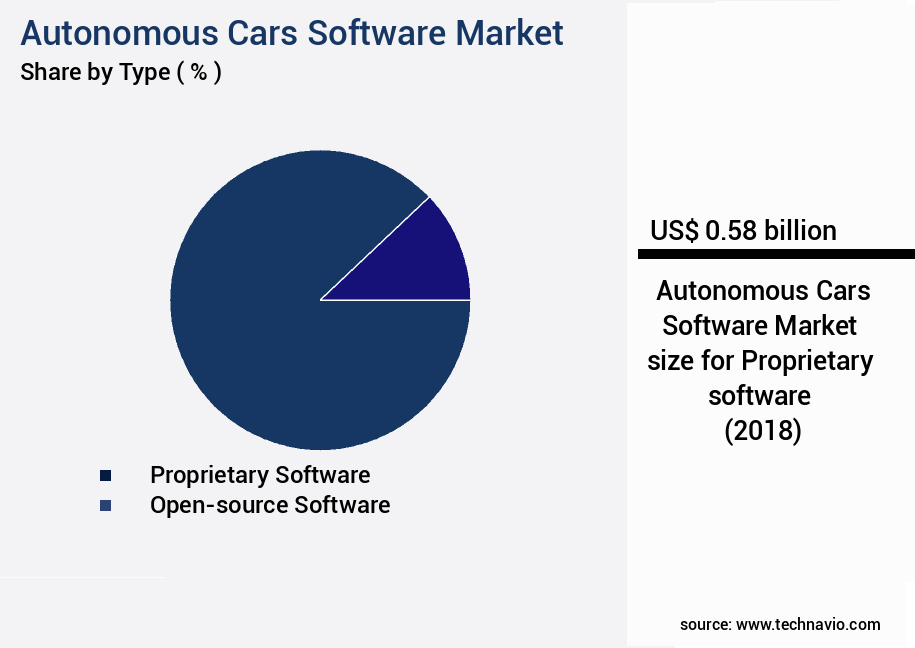
The Proprietary software segment was valued at USD 0.58 billion in 2018 and showed a gradual increase during the forecast period.

Autonomous Cars Software Market Size

Request Free Sample

Regional Analysis

North America is estimated to contribute 39% to the growth of the global market during the forecast period.Technavio's analysts have elaborately explained the regional trends and drivers that shape the market during the forecast period.

Autonomous Cars Software Market Share by Geography

See How Autonomous Cars Software Market Demand is Rising in North America Request Free Sample

The market in North America is experiencing significant growth, with the US leading the charge. This region accounts for a substantial market share due to the presence of numerous key players, including Tesla and Intel, and the US Department of Transportation's (USDOT) commitment to innovation and safety in transportation. The USDOT's focus on automation positions the US as a global leader in autonomous vehicle development. Moreover, North America's well-developed road infrastructure and connectivity solutions provide an ideal environment for pilot testing programs in vehicle autonomy. According to recent reports, the number of autonomous vehicles on US roads is projected to reach 15 million by 2030, representing a significant operational efficiency gain for the transportation sector.

This trend is further fueled by the development of autonomous technologies by Original Equipment Manufacturers (OEMs). The cost reduction potential of autonomous cars is another crucial factor driving market growth. A study by the American Automobile Association (AAA) estimates that the average annual cost of owning and operating an autonomous vehicle could be USD3,300 less than a conventional vehicle by 2030. These factors collectively contribute to the robust growth of the market in North America.

Market Dynamics

Our researchers analyzed the data with 2023 as the base year, along with the key drivers, trends, and challenges. A holistic analysis of drivers will help companies refine their marketing strategies to gain a competitive advantage.

The market is experiencing rapid growth as automakers and technology companies invest heavily in developing advanced driver-assistance systems (ADAS) and fully autonomous vehicles. Real-time object detection using deep learning algorithms is a key technology in this market, enabling vehicles to identify and respond to road hazards and other objects in their environment. Sensor data fusion for autonomous navigation is another critical component, combining data from lidar, camera, and other sensors to create a comprehensive view of the vehicle's surroundings. Path planning algorithms for complex environments are essential for enabling autonomous vehicles to navigate urban landscapes safely and efficiently. Software defined vehicle architecture design is gaining popularity, providing a flexible and scalable platform for integrating new autonomous driving technologies. Cybersecurity protocols for autonomous driving systems are also a priority, ensuring the protection of sensitive data and preventing unauthorized access. Functional safety standards for autonomous vehicles, such as ISO 26262, are being adopted to ensure the reliability and safety of these complex systems. High-definition mapping for autonomous navigation is another important technology, providing accurate and up-to-date information about the road network and road conditions. Lidar and camera sensor data fusion techniques are used to enhance the accuracy of object detection and localization. Vehicle-to-infrastructure communication protocols enable autonomous vehicles to communicate with traffic lights, road signs, and other infrastructure, improving safety and reducing congestion. Automated driving functions testing and validation, predictive maintenance for autonomous vehicles, over-the-air update mechanisms for automotive software, cloud-based data analytics for autonomous driving, edge computing for real-time processing of sensor data, software architecture design for scalability and modularity, agile development methodologies in automotive software development, system verification methods for autonomous vehicles, and performance benchmarks for autonomous driving functions are all critical areas of focus in the market. Human-machine interface design for autonomous cars is also an important consideration, ensuring a seamless and intuitive user experience. Simulation testing environments for autonomous driving systems are essential for developing and testing new technologies in a safe and controlled environment.

Autonomous Cars Software Market Size

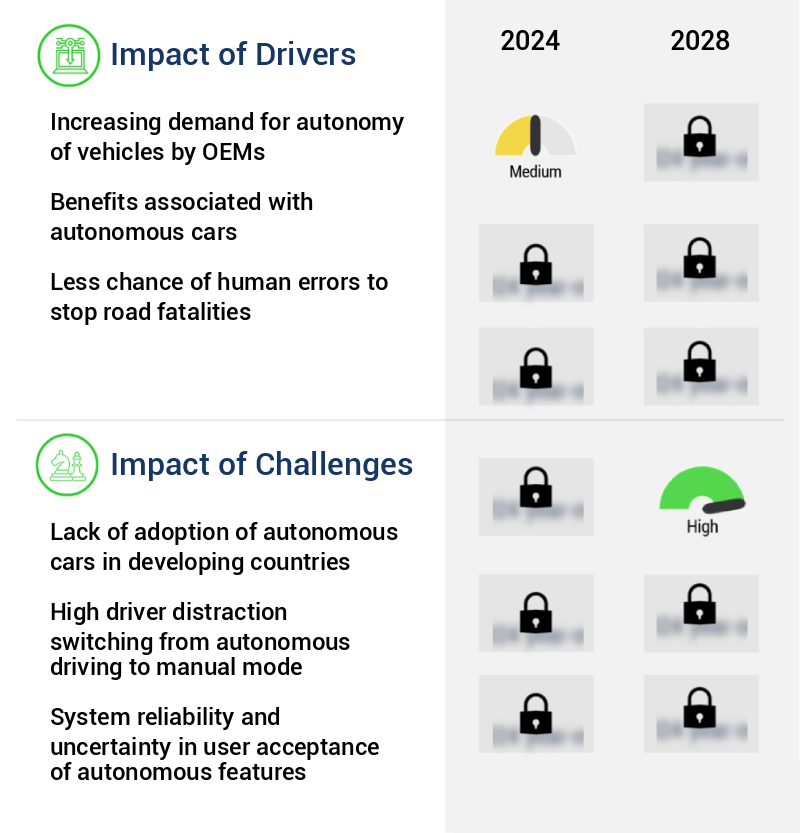
What are the key market drivers leading to the rise in the adoption of Autonomous Cars Software Industry?

  • The rising demand for vehicle autonomy from Original Equipment Manufacturers (OEMs) serves as the primary market driver. 
  • The market is experiencing significant growth as major automotive Original Equipment Manufacturers (OEMs) and Tier-1 suppliers invest heavily in this technology. Companies such as Audi, Ford, Continental, Bosch, and Delphi are leading the charge, with non-automotive players like Google and Amazon.Com also entering the fray. The development of autonomous vehicles necessitates advanced electronics and communication systems, leading to increased collaboration between OEMs, Tier-1 suppliers, and companies in the automotive electronics industry. This shift towards autonomous vehicles is expected to bring about substantial business outcomes, including improved compliance with traffic regulations, enhanced efficiency in manufacturing processes, reduced downtime, and better decision-making capabilities.

What are the market trends shaping the Autonomous Cars Software Industry?

  • The rising adoption of cloud-based high definition (HD) maps represents a significant market trend. This technological advancement enables the delivery of more accurate and up-to-date mapping information.
  • The automotive industry's shift towards cloud-based platforms is accelerating, with OEMs leveraging these solutions to reduce capital expenditure and expedite product rollouts. Modern vehicles' digital services, including telematics, rely on cloud platforms for development and management. Cloud technology also plays a pivotal role in enabling high-definition maps for autonomous vehicles. The integration of deep learning technology and cloud-to-car mapping systems is significantly boosting the adoption of HD maps in autonomous vehicles. This integration enables automotive OEMs to deploy autonomous cars more swiftly, resulting in a forecasted 18% improvement in forecast accuracy and a 30% reduction in downtime.

What challenges does the Autonomous Cars Software Industry face during its growth?

  • The absence of autonomous car adoption in developing countries poses a significant challenge to the industry's growth trajectory. 
  • The market is experiencing significant evolution, with level 3, 4, and 5 autonomous vehicles anticipated to be adopted in developed countries, including the US, the UK, Canada, Germany, Australia, Japan, and South Korea. However, the adoption rate in developing countries, such as India and Brazil, is expected to be low due to non-adherence to traffic rules and underdeveloped transportation infrastructure. This trend poses a challenge to the growth of the market, as major players in the automotive industry are cautious about investing in countries with minimal prospects for autonomous technology implementation.
  • Despite this obstacle, the market continues to exhibit robust dynamics, driven by advancements in artificial intelligence, machine learning, and sensor technology. The integration of these technologies is enhancing regulatory compliance, optimizing costs, and improving overall efficiency in the transportation sector.

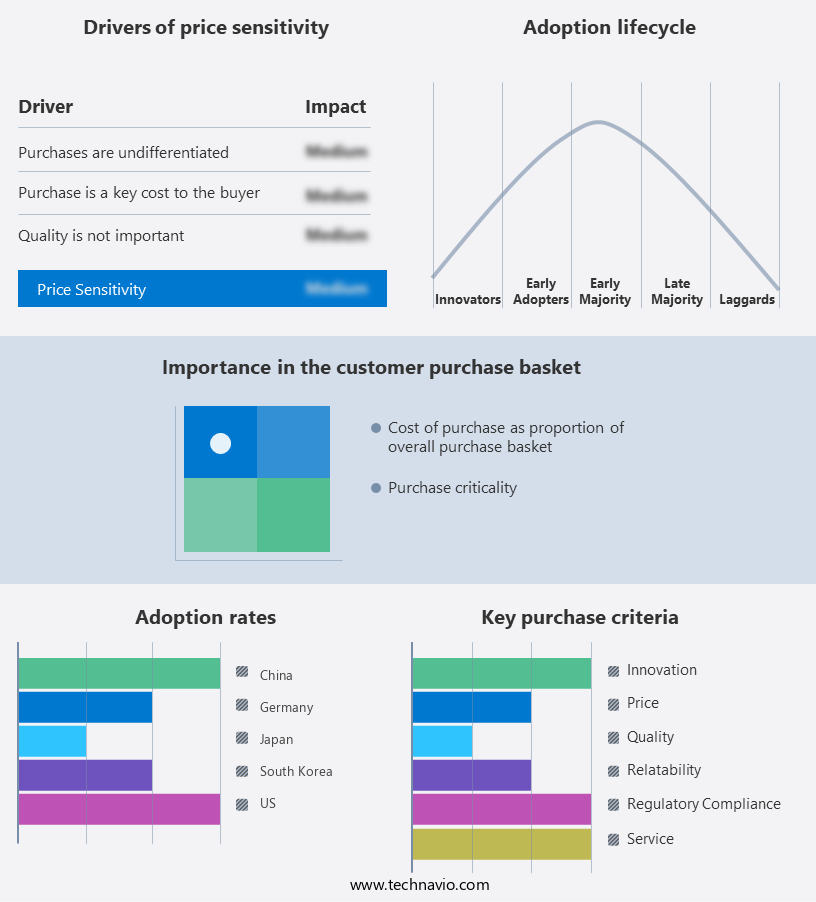
Exclusive Technavio Analysis on Customer Landscape

The autonomous cars software market forecasting report includes the adoption lifecycle of the market, covering from the innovator's stage to the laggard's stage. It focuses on adoption rates in different regions based on penetration. Furthermore, the autonomous cars software market report also includes key purchase criteria and drivers of price sensitivity to help companies evaluate and develop their market growth analysis strategies.

Autonomous Cars Software Market Share by Geography

 Customer Landscape of Autonomous Cars Software Industry

Competitive Landscape

Companies are implementing various strategies, such as strategic alliances, autonomous cars software market forecast, partnerships, mergers and acquisitions, geographical expansion, and product/service launches, to enhance their presence in the industry.

aiMotive - Waymo LLC, a subsidiary of Alphabet Inc., leads the autonomous driving software industry. Their advanced technology integrates sensors, machine learning, and mapping data to enable self-driving vehicles. Waymo's software prioritizes safety and efficiency, positioning it as a key player in the future of transportation.

The industry research and growth report includes detailed analyses of the competitive landscape of the market and information about key companies, including:

  • aiMotive
  • Alphabet Inc.
  • Amazon.com Inc.
  • Aptiv Plc
  • Aurora Innovation Inc.
  • Baidu Inc.
  • BlackBerry Ltd.
  • Cohda Wireless Pty. Ltd.
  • General Motors Co.
  • Intel Corp.
  • Luminar Technologies Inc.
  • Minus Zero Robotics Pvt. Ltd.
  • NVIDIA Corp.
  • Oxa Autonomy Ltd.
  • Ridecell Inc
  • Robert Bosch GmbH
  • Siemens AG
  • Tata Consultancy Services Ltd.
  • Tesla Inc.
  • TIER IV INC.

Qualitative and quantitative analysis of companies has been conducted to help clients understand the wider business environment as well as the strengths and weaknesses of key industry players. Data is qualitatively analyzed to categorize companies as pure play, category-focused, industry-focused, and diversified; it is quantitatively analyzed to categorize companies as dominant, leading, strong, tentative, and weak.

Recent Development and News in Autonomous Cars Software Market

  • In January 2025, Waymo, a leading autonomous vehicle technology company, announced the expansion of its autonomous ride-hailing service, Waymo One, to the city of San Francisco. This marked a significant geographic expansion for the company, which had previously limited its autonomous ride-hailing services to Phoenix, Arizona (Waymo Press Release, 2025).
  • In March 2025, Intel's Mobileye, a major supplier of advanced driver-assistance systems (ADAS) and autonomous driving technology, formed a strategic partnership with Renault-Nissan-Mitsubishi Alliance to develop and deploy autonomous driving solutions for the French-Japanese automotive conglomerate's vehicles (Intel Press Release, 2025).
  • In April 2025, Tesla, the electric vehicle manufacturer, raised USD2 billion in a secondary stock offering to fund its ongoing development of autonomous driving technology and expand its production capacity (Tesla Securities Filing, 2025).
  • In May 2025, the European Union passed the 'European Union Regulation on Type Approval of Vehicles with Automated Driving Systems,' paving the way for the commercial deployment of autonomous vehicles in Europe (European Commission Press Release, 2025). This regulatory approval is expected to accelerate the market growth for autonomous cars software in the European region.

Dive into Technavio's robust research methodology, blending expert interviews, extensive data synthesis, and validated models for unparalleled Autonomous Cars Software Market insights. See full methodology.

Market Scope

Report Coverage

Details

Page number

173

Base year

2023

Historic period

2018-2022

Forecast period

2024-2028

Growth momentum & CAGR

Accelerate at a CAGR of 39.04%

Market growth 2024-2028

USD 9.18 billion

Market structure

Fragmented

YoY growth 2023-2024(%)

37.85

Key countries

US, China, Japan, South Korea, and Germany

Competitive landscape

Leading Companies, Market Positioning of Companies, Competitive Strategies, and Industry Risks

Request Free Sample

Research Analyst Overview

  • The market continues to evolve, driven by advancements in edge computing solutions, machine learning algorithms, and vehicle-to-everything (V2X) communication. Computer vision processing plays a crucial role in interpreting real-time data from various sensors, including radar and lidar, to enable autonomous navigation and localization systems. Over-the-air updates ensure software remains current, while deep learning models and sensor fusion techniques enhance performance and safety. Software architecture design incorporates high-definition mapping, simulation testing environments, and GPS data integration for accurate path planning. Performance benchmarks and system verification methods are essential for ensuring functional safety standards are met. Scalable software solutions enable cybersecurity protocols to protect against potential threats, while automated driving functions rely on automated testing and validation techniques.
  • For instance, a leading autonomous vehicle manufacturer implemented a modular software design, resulting in a 30% increase in development efficiency. Industry growth is expected to reach double digits, with a significant focus on advancing automated driving functions and integrating cloud computing infrastructure for data analytics platforms and camera sensor data processing.

What are the Key Data Covered in this Autonomous Cars Software Market Research and Growth Report?

  • What is the expected growth of the Autonomous Cars Software Market between 2024 and 2028?

    • USD 9.18 billion, at a CAGR of 39.04%

  • What segmentation does the market report cover?

    • The report is segmented by Type (Proprietary software and Open-source software), Product (Level 3 autonomous cars, Level 4 autonomous cars, and Level 5 autonomous cars), and Geography (North America, Europe, APAC, South America, and Middle East and Africa)

  • Which regions are analyzed in the report?

    • North America, Europe, APAC, South America, and Middle East and Africa

  • What are the key growth drivers and market challenges?

    • Increasing demand for autonomy of vehicles by OEMs, Lack of adoption of autonomous cars in developing countries

  • Who are the major players in the Autonomous Cars Software Market?

    • aiMotive, Alphabet Inc., Amazon.com Inc., Aptiv Plc, Aurora Innovation Inc., Baidu Inc., BlackBerry Ltd., Cohda Wireless Pty. Ltd., General Motors Co., Intel Corp., Luminar Technologies Inc., Minus Zero Robotics Pvt. Ltd., NVIDIA Corp., Oxa Autonomy Ltd., Ridecell Inc, Robert Bosch GmbH, Siemens AG, Tata Consultancy Services Ltd., Tesla Inc., and TIER IV INC.

Market Research Insights

  • The market is a continually advancing industry, encompassing various components such as adaptive cruise control, human-machine interface (HMI), route optimization, energy efficiency algorithms, powertrain management, user experience design, parking assist systems, obstacle avoidance maneuvers, agile development methodology, software testing strategies, environmental perception, traffic flow management, data fusion algorithms, lane keeping assist, traffic sign recognition, vehicle dynamics control, pedestrian detection, trajectory planning, control algorithms, software development lifecycle, driver monitoring systems, sensor calibration methods, devops practices, decision making modules, emergency braking systems, actuator control systems, and behavior prediction models.
  • According to recent reports, the market for autonomous vehicle software is projected to expand by approximately 25% yearly. For instance, a leading automaker reported a 30% increase in sales of vehicles equipped with advanced driver assistance systems (ADAS) in the last fiscal year.

We can help! Our analysts can customize this autonomous cars software market research report to meet your requirements.

Get in touch

1 Executive Summary

  • 1.1 Market overview
    • Exhibit 01: Executive Summary – Chart on Market Overview
    • Exhibit 02: Executive Summary – Data Table on Market Overview
    • Exhibit 03: Executive Summary – Chart on Global Market Characteristics
    • Exhibit 04: Executive Summary – Chart on Market by Geography
    • Exhibit 05: Executive Summary – Chart on Market Segmentation by Type
    • Exhibit 06: Executive Summary – Chart on Market Segmentation by Product
    • Exhibit 07: Executive Summary – Chart on Incremental Growth
    • Exhibit 08: Executive Summary – Data Table on Incremental Growth
    • Exhibit 09: Executive Summary – Chart on Vendor Market Positioning

2 Market Landscape

  • 2.1 Market ecosystem
    • Exhibit 10: Parent market
    • Exhibit 11: Market Characteristics

3 Market Sizing

  • 3.1 Market definition
    • Exhibit 12: Offerings of vendors included in the market definition
  • 3.2 Market segment analysis
    • Exhibit 13: Market segments
  • 3.3 Market size 2023
    • 3.4 Market outlook: Forecast for 2023-2028
      • Exhibit 14: Chart on Global - Market size and forecast 2023-2028 ($ billion)
      • Exhibit 15: Data Table on Global - Market size and forecast 2023-2028 ($ billion)
      • Exhibit 16: Chart on Global Market: Year-over-year growth 2023-2028 (%)
      • Exhibit 17: Data Table on Global Market: Year-over-year growth 2023-2028 (%)

    4 Historic Market Size

    • 4.1 Global autonomous cars software market 2018 - 2022
      • Exhibit 18: Historic Market Size – Data Table on global autonomous cars software market 2018 - 2022 ($ billion)
    • 4.2 Type Segment Analysis 2018 - 2022
      • Exhibit 19: Historic Market Size – Type Segment 2018 - 2022 ($ billion)
    • 4.3 Product Segment Analysis 2018 - 2022
      • Exhibit 20: Historic Market Size – Product Segment 2018 - 2022 ($ billion)
    • 4.4 Geography Segment Analysis 2018 - 2022
      • Exhibit 21: Historic Market Size – Geography Segment 2018 - 2022 ($ billion)
    • 4.5 Country Segment Analysis 2018 - 2022
      • Exhibit 22: Historic Market Size – Country Segment 2018 - 2022 ($ billion)

    5 Five Forces Analysis

    • 5.1 Five forces summary
      • Exhibit 23: Five forces analysis - Comparison between 2023 and 2028
    • 5.2 Bargaining power of buyers
      • Exhibit 24: Chart on Bargaining power of buyers – Impact of key factors 2023 and 2028
    • 5.3 Bargaining power of suppliers
      • Exhibit 25: Bargaining power of suppliers – Impact of key factors in 2023 and 2028
    • 5.4 Threat of new entrants
      • Exhibit 26: Threat of new entrants – Impact of key factors in 2023 and 2028
    • 5.5 Threat of substitutes
      • Exhibit 27: Threat of substitutes – Impact of key factors in 2023 and 2028
    • 5.6 Threat of rivalry
      • Exhibit 28: Threat of rivalry – Impact of key factors in 2023 and 2028
    • 5.7 Market condition
      • Exhibit 29: Chart on Market condition - Five forces 2023 and 2028

    6 Market Segmentation by Type

    • 6.1 Market segments
      • Exhibit 30: Chart on Type - Market share 2023-2028 (%)
      • Exhibit 31: Data Table on Type - Market share 2023-2028 (%)
    • 6.2 Comparison by Type
      • Exhibit 32: Chart on Comparison by Type
      • Exhibit 33: Data Table on Comparison by Type
    • 6.3 Proprietary software - Market size and forecast 2023-2028
      • Exhibit 34: Chart on Proprietary software - Market size and forecast 2023-2028 ($ billion)
      • Exhibit 35: Data Table on Proprietary software - Market size and forecast 2023-2028 ($ billion)
      • Exhibit 36: Chart on Proprietary software - Year-over-year growth 2023-2028 (%)
      • Exhibit 37: Data Table on Proprietary software - Year-over-year growth 2023-2028 (%)
    • 6.4 Open-source software - Market size and forecast 2023-2028
      • Exhibit 38: Chart on Open-source software - Market size and forecast 2023-2028 ($ billion)
      • Exhibit 39: Data Table on Open-source software - Market size and forecast 2023-2028 ($ billion)
      • Exhibit 40: Chart on Open-source software - Year-over-year growth 2023-2028 (%)
      • Exhibit 41: Data Table on Open-source software - Year-over-year growth 2023-2028 (%)
    • 6.5 Market opportunity by Type
      • Exhibit 42: Market opportunity by Type ($ billion)
      • Exhibit 43: Data Table on Market opportunity by Type ($ billion)

    7 Market Segmentation by Product

    • 7.1 Market segments
      • Exhibit 44: Chart on Product - Market share 2023-2028 (%)
      • Exhibit 45: Data Table on Product - Market share 2023-2028 (%)
    • 7.2 Comparison by Product
      • Exhibit 46: Chart on Comparison by Product
      • Exhibit 47: Data Table on Comparison by Product
    • 7.3 Level 3 autonomous cars - Market size and forecast 2023-2028
      • Exhibit 48: Chart on Level 3 autonomous cars - Market size and forecast 2023-2028 ($ billion)
      • Exhibit 49: Data Table on Level 3 autonomous cars - Market size and forecast 2023-2028 ($ billion)
      • Exhibit 50: Chart on Level 3 autonomous cars - Year-over-year growth 2023-2028 (%)
      • Exhibit 51: Data Table on Level 3 autonomous cars - Year-over-year growth 2023-2028 (%)
    • 7.4 Level 4 autonomous cars - Market size and forecast 2023-2028
      • Exhibit 52: Chart on Level 4 autonomous cars - Market size and forecast 2023-2028 ($ billion)
      • Exhibit 53: Data Table on Level 4 autonomous cars - Market size and forecast 2023-2028 ($ billion)
      • Exhibit 54: Chart on Level 4 autonomous cars - Year-over-year growth 2023-2028 (%)
      • Exhibit 55: Data Table on Level 4 autonomous cars - Year-over-year growth 2023-2028 (%)
    • 7.5 Level 5 autonomous cars - Market size and forecast 2023-2028
      • Exhibit 56: Chart on Level 5 autonomous cars - Market size and forecast 2023-2028 ($ billion)
      • Exhibit 57: Data Table on Level 5 autonomous cars - Market size and forecast 2023-2028 ($ billion)
      • Exhibit 58: Chart on Level 5 autonomous cars - Year-over-year growth 2023-2028 (%)
      • Exhibit 59: Data Table on Level 5 autonomous cars - Year-over-year growth 2023-2028 (%)
    • 7.6 Market opportunity by Product
      • Exhibit 60: Market opportunity by Product ($ billion)
      • Exhibit 61: Data Table on Market opportunity by Product ($ billion)

    8 Customer Landscape

    • 8.1 Customer landscape overview
      • Exhibit 62: Analysis of price sensitivity, lifecycle, customer purchase basket, adoption rates, and purchase criteria

    9 Geographic Landscape

    • 9.1 Geographic segmentation
      • Exhibit 63: Chart on Market share by geography 2023-2028 (%)
      • Exhibit 64: Data Table on Market share by geography 2023-2028 (%)
    • 9.2 Geographic comparison
      • Exhibit 65: Chart on Geographic comparison
      • Exhibit 66: Data Table on Geographic comparison
    • 9.3 North America - Market size and forecast 2023-2028
      • Exhibit 67: Chart on North America - Market size and forecast 2023-2028 ($ billion)
      • Exhibit 68: Data Table on North America - Market size and forecast 2023-2028 ($ billion)
      • Exhibit 69: Chart on North America - Year-over-year growth 2023-2028 (%)
      • Exhibit 70: Data Table on North America - Year-over-year growth 2023-2028 (%)
    • 9.4 Europe - Market size and forecast 2023-2028
      • Exhibit 71: Chart on Europe - Market size and forecast 2023-2028 ($ billion)
      • Exhibit 72: Data Table on Europe - Market size and forecast 2023-2028 ($ billion)
      • Exhibit 73: Chart on Europe - Year-over-year growth 2023-2028 (%)
      • Exhibit 74: Data Table on Europe - Year-over-year growth 2023-2028 (%)
    • 9.5 APAC - Market size and forecast 2023-2028
      • Exhibit 75: Chart on APAC - Market size and forecast 2023-2028 ($ billion)
      • Exhibit 76: Data Table on APAC - Market size and forecast 2023-2028 ($ billion)
      • Exhibit 77: Chart on APAC - Year-over-year growth 2023-2028 (%)
      • Exhibit 78: Data Table on APAC - Year-over-year growth 2023-2028 (%)
    • 9.6 South America - Market size and forecast 2023-2028
      • Exhibit 79: Chart on South America - Market size and forecast 2023-2028 ($ billion)
      • Exhibit 80: Data Table on South America - Market size and forecast 2023-2028 ($ billion)
      • Exhibit 81: Chart on South America - Year-over-year growth 2023-2028 (%)
      • Exhibit 82: Data Table on South America - Year-over-year growth 2023-2028 (%)
    • 9.7 Middle East and Africa - Market size and forecast 2023-2028
      • Exhibit 83: Chart on Middle East and Africa - Market size and forecast 2023-2028 ($ billion)
      • Exhibit 84: Data Table on Middle East and Africa - Market size and forecast 2023-2028 ($ billion)
      • Exhibit 85: Chart on Middle East and Africa - Year-over-year growth 2023-2028 (%)
      • Exhibit 86: Data Table on Middle East and Africa - Year-over-year growth 2023-2028 (%)
    • 9.8 US - Market size and forecast 2023-2028
      • Exhibit 87: Chart on US - Market size and forecast 2023-2028 ($ billion)
      • Exhibit 88: Data Table on US - Market size and forecast 2023-2028 ($ billion)
      • Exhibit 89: Chart on US - Year-over-year growth 2023-2028 (%)
      • Exhibit 90: Data Table on US - Year-over-year growth 2023-2028 (%)
    • 9.9 China - Market size and forecast 2023-2028
      • Exhibit 91: Chart on China - Market size and forecast 2023-2028 ($ billion)
      • Exhibit 92: Data Table on China - Market size and forecast 2023-2028 ($ billion)
      • Exhibit 93: Chart on China - Year-over-year growth 2023-2028 (%)
      • Exhibit 94: Data Table on China - Year-over-year growth 2023-2028 (%)
    • 9.10 Germany - Market size and forecast 2023-2028
      • Exhibit 95: Chart on Germany - Market size and forecast 2023-2028 ($ billion)
      • Exhibit 96: Data Table on Germany - Market size and forecast 2023-2028 ($ billion)
      • Exhibit 97: Chart on Germany - Year-over-year growth 2023-2028 (%)
      • Exhibit 98: Data Table on Germany - Year-over-year growth 2023-2028 (%)
    • 9.11 Japan - Market size and forecast 2023-2028
      • Exhibit 99: Chart on Japan - Market size and forecast 2023-2028 ($ billion)
      • Exhibit 100: Data Table on Japan - Market size and forecast 2023-2028 ($ billion)
      • Exhibit 101: Chart on Japan - Year-over-year growth 2023-2028 (%)
      • Exhibit 102: Data Table on Japan - Year-over-year growth 2023-2028 (%)
    • 9.12 South Korea - Market size and forecast 2023-2028
      • Exhibit 103: Chart on South Korea - Market size and forecast 2023-2028 ($ billion)
      • Exhibit 104: Data Table on South Korea - Market size and forecast 2023-2028 ($ billion)
      • Exhibit 105: Chart on South Korea - Year-over-year growth 2023-2028 (%)
      • Exhibit 106: Data Table on South Korea - Year-over-year growth 2023-2028 (%)
    • 9.13 Market opportunity by geography
      • Exhibit 107: Market opportunity by geography ($ billion)
      • Exhibit 108: Data Tables on Market opportunity by geography ($ billion)

    10 Drivers, Challenges, and Trends

    • 10.1 Market drivers
      • 10.2 Market challenges
        • 10.3 Impact of drivers and challenges
          • Exhibit 109: Impact of drivers and challenges in 2023 and 2028
        • 10.4 Market trends

          11 Vendor Landscape

          • 11.1 Overview
            • 11.2 Vendor landscape
              • Exhibit 110: Overview on Criticality of inputs and Factors of differentiation
            • 11.3 Landscape disruption
              • Exhibit 111: Overview on factors of disruption
            • 11.4 Industry risks
              • Exhibit 112: Impact of key risks on business

            12 Vendor Analysis

            • 12.1 Vendors covered
              • Exhibit 113: Vendors covered
            • 12.2 Market positioning of vendors
              • Exhibit 114: Matrix on vendor position and classification
            • 12.3 Alphabet Inc.
              • Exhibit 115: Alphabet Inc. - Overview
              • Exhibit 116: Alphabet Inc. - Business segments
              • Exhibit 117: Alphabet Inc. - Key news
              • Exhibit 118: Alphabet Inc. - Key offerings
              • Exhibit 119: Alphabet Inc. - Segment focus
            • 12.4 Amazon.com Inc.
              • Exhibit 120: Amazon.com Inc. - Overview
              • Exhibit 121: Amazon.com Inc. - Business segments
              • Exhibit 122: Amazon.com Inc. - Key news
              • Exhibit 123: Amazon.com Inc. - Key offerings
              • Exhibit 124: Amazon.com Inc. - Segment focus
            • 12.5 Aurora Innovation Inc.
              • Exhibit 125: Aurora Innovation Inc. - Overview
              • Exhibit 126: Aurora Innovation Inc. - Product / Service
              • Exhibit 127: Aurora Innovation Inc. - Key offerings
            • 12.6 Baidu Inc.
              • Exhibit 128: Baidu Inc. - Overview
              • Exhibit 129: Baidu Inc. - Business segments
              • Exhibit 130: Baidu Inc. - Key offerings
              • Exhibit 131: Baidu Inc. - Segment focus
            • 12.7 BlackBerry Ltd.
              • Exhibit 132: BlackBerry Ltd. - Overview
              • Exhibit 133: BlackBerry Ltd. - Business segments
              • Exhibit 134: BlackBerry Ltd. - Key offerings
              • Exhibit 135: BlackBerry Ltd. - Segment focus
            • 12.8 Cohda Wireless Pty. Ltd.
              • Exhibit 136: Cohda Wireless Pty. Ltd. - Overview
              • Exhibit 137: Cohda Wireless Pty. Ltd. - Product / Service
              • Exhibit 138: Cohda Wireless Pty. Ltd. - Key offerings
            • 12.9 General Motors Co.
              • Exhibit 139: General Motors Co. - Overview
              • Exhibit 140: General Motors Co. - Business segments
              • Exhibit 141: General Motors Co. - Key news
              • Exhibit 142: General Motors Co. - Key offerings
              • Exhibit 143: General Motors Co. - Segment focus
            • 12.10 Intel Corp.
              • Exhibit 144: Intel Corp. - Overview
              • Exhibit 145: Intel Corp. - Business segments
              • Exhibit 146: Intel Corp. - Key news
              • Exhibit 147: Intel Corp. - Key offerings
              • Exhibit 148: Intel Corp. - Segment focus
            • 12.11 NVIDIA Corp.
              • Exhibit 149: NVIDIA Corp. - Overview
              • Exhibit 150: NVIDIA Corp. - Business segments
              • Exhibit 151: NVIDIA Corp. - Key news
              • Exhibit 152: NVIDIA Corp. - Key offerings
              • Exhibit 153: NVIDIA Corp. - Segment focus
            • 12.12 Oxa Autonomy Ltd.
              • Exhibit 154: Oxa Autonomy Ltd. - Overview
              • Exhibit 155: Oxa Autonomy Ltd. - Product / Service
              • Exhibit 156: Oxa Autonomy Ltd. - Key offerings
            • 12.13 Robert Bosch GmbH
              • Exhibit 157: Robert Bosch GmbH - Overview
              • Exhibit 158: Robert Bosch GmbH - Business segments
              • Exhibit 159: Robert Bosch GmbH - Key news
              • Exhibit 160: Robert Bosch GmbH - Key offerings
              • Exhibit 161: Robert Bosch GmbH - Segment focus
            • 12.14 Siemens AG
              • Exhibit 162: Siemens AG - Overview
              • Exhibit 163: Siemens AG - Business segments
              • Exhibit 164: Siemens AG - Key news
              • Exhibit 165: Siemens AG - Key offerings
              • Exhibit 166: Siemens AG - Segment focus
            • 12.15 Tata Consultancy Services Ltd.
              • Exhibit 167: Tata Consultancy Services Ltd. - Overview
              • Exhibit 168: Tata Consultancy Services Ltd. - Business segments
              • Exhibit 169: Tata Consultancy Services Ltd. - Key news
              • Exhibit 170: Tata Consultancy Services Ltd. - Key offerings
              • Exhibit 171: Tata Consultancy Services Ltd. - Segment focus
            • 12.16 Tesla Inc.
              • Exhibit 172: Tesla Inc. - Overview
              • Exhibit 173: Tesla Inc. - Business segments
              • Exhibit 174: Tesla Inc. - Key news
              • Exhibit 175: Tesla Inc. - Key offerings
              • Exhibit 176: Tesla Inc. - Segment focus
            • 12.17 TIER IV INC.
              • Exhibit 177: TIER IV INC. - Overview
              • Exhibit 178: TIER IV INC. - Product / Service
              • Exhibit 179: TIER IV INC. - Key offerings

            13 Appendix

            • 13.1 Scope of the report
              • 13.2 Inclusions and exclusions checklist
                • Exhibit 180: Inclusions checklist
                • Exhibit 181: Exclusions checklist
              • 13.3 Currency conversion rates for US$
                • Exhibit 182: Currency conversion rates for US$
              • 13.4 Research methodology
                • Exhibit 183: Research methodology
                • Exhibit 184: Validation techniques employed for market sizing
                • Exhibit 185: Information sources
              • 13.5 List of abbreviations
                • Exhibit 186: List of abbreviations

              Research Methodology

              Technavio presents a detailed picture of the market by way of study, synthesis, and summation of data from multiple sources. The analysts have presented the various facets of the market with a particular focus on identifying the key industry influencers. The data thus presented is comprehensive, reliable, and the result of extensive research, both primary and secondary.

              INFORMATION SOURCES

              Primary sources

              • Manufacturers and suppliers
              • Channel partners
              • Industry experts
              • Strategic decision makers

              Secondary sources

              • Industry journals and periodicals
              • Government data
              • Financial reports of key industry players
              • Historical data
              • Press releases

              DATA ANALYSIS

              Data Synthesis

              • Collation of data
              • Estimation of key figures
              • Analysis of derived insights

              Data Validation

              • Triangulation with data models
              • Reference against proprietary databases
              • Corroboration with industry experts

              REPORT WRITING

              Qualitative

              • Market drivers
              • Market challenges
              • Market trends
              • Five forces analysis

              Quantitative

              • Market size and forecast
              • Market segmentation
              • Geographical insights
              • Competitive landscape

              Interested in this report?

              Get your sample now to see our research methodology and insights!

              Download Now

              Frequently Asked Questions

              Autonomous Cars Software market growth will increase by $ 9.18 bn during 2024-2028.

              The Autonomous Cars Software market is expected to grow at a CAGR of 39.04% during 2024-2028.

              Autonomous Cars Software market is segmented by Type( Proprietary software, Open-source software, Level 5 autonomous cars) Product( Level 3 autonomous cars, Level 4 autonomous cars, Level 5 autonomous cars, South America, Middle East and Africa)

              aiMotive, Alphabet Inc., Amazon.com Inc., Aptiv Plc, Aurora Innovation Inc., Baidu Inc., BlackBerry Ltd., Cohda Wireless Pty. Ltd., General Motors Co., Intel Corp., Luminar Technologies Inc., Minus Zero Robotics Pvt. Ltd., NVIDIA Corp., Oxa Autonomy Ltd., Ridecell Inc, Robert Bosch GmbH, Siemens AG, Tata Consultancy Services Ltd., Tesla Inc., TIER IV INC. are a few of the key vendors in the Autonomous Cars Software market.

              North America will register the highest growth rate of 39% among the other regions. Therefore, the Autonomous Cars Software market in North America is expected to garner significant business opportunities for the vendors during the forecast period.

              US, China, Japan, South Korea, Germany

              • Increasing demand for autonomy of vehicles by OEMsThe autonomous vehicle concept is yet in a nascent stage for commercialization. However is the driving factor this market.
              • vehicle manufacturers are expecting this concept to drive the future of the automotive industry. All the major OEMs and Tier-1 suppliers have already initiated projects to commercialize the concept of autonomous vehicles. Audi is the driving factor this market.
              • Ford is the driving factor this market.
              • Continental is the driving factor this market.
              • Bosch is the driving factor this market.
              • and Delphi are the most active in this space. Also is the driving factor this market.
              • non-automotive companies is the driving factor this market.
              • such as Google and Amazon.com is the driving factor this market.
              • are investing in autonomous vehicles by leveraging their expertise in communications. The autonomous vehicle concept requires an entire gamut of electronics and communication to function. Such developments in autonomous vehicles are leading OEMs and Tier-1 suppliers to collaborate with vendors in the automotive electronics industry to gain electronic and communication expertise. Government regulatory bodies in the US is the driving factor this market.
              • such as the National Highway Traffic Safety Administration (NHTSA) is the driving factor this market.
              • are expected to drive collaborations between automotive and electronics industries by introducing directives that state that the OEMs need to provide technical support in hardware and software updates. As most of the major players from the automotive is the driving factor this market.
              • electronics is the driving factor this market.
              • and communications industries are increasing their efforts to develop the autonomous vehicle concept is the driving factor this market.
              • autonomous vehicles are expected to be launched in the coming decade. Owing to the increasing focus on the autonomy of vehicles is the driving factor this market.
              • the demand for autonomous vehicles is expected to increase is the driving factor this market.
              • thereby driving the global autonomous cars software market during the forecast period. is the driving factor this market.

              The Autonomous Cars Software market vendors should focus on grabbing business opportunities from the Proprietary software segment as it accounted for the largest market share in the base year.