Cables And Accessories Market Analysis, Size, and Forecast 2025-2029: APAC (Australia, China, India, Japan, South Korea), Europe (France, Germany, UK), North America (US and Canada), Middle East and Africa , and South America

Cables And Accessories Market Analysis, Size, and Forecast 2025-2029:
APAC (Australia, China, India, Japan, South Korea), Europe (France, Germany, UK), North America (US and Canada), Middle East and Africa , and South America

Published: Apr 2025 238 Pages SKU: IRTNTR71237

Market Overview at a Glance

$45.9 B
Market Opportunity
5.3%
CAGR
4.9
YoY growth 2024-2025(%)

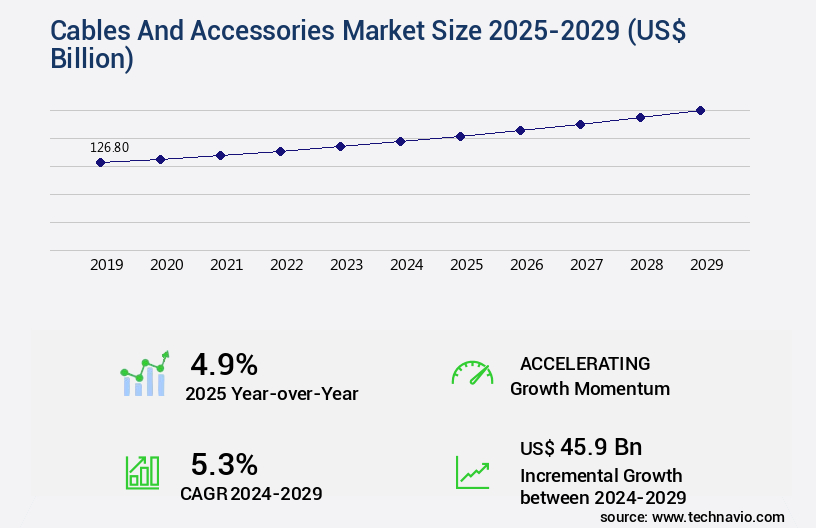
Cables And Accessories Market Size 2025-2029

The cables and accessories market size is valued to increase USD 45.9 billion, at a CAGR of 5.3% from 2024 to 2029. Rising adoption of smart grid technology will drive the cables and accessories market.

Major Market Trends & Insights

  • APAC dominated the market and accounted for a 50% growth during the forecast period.
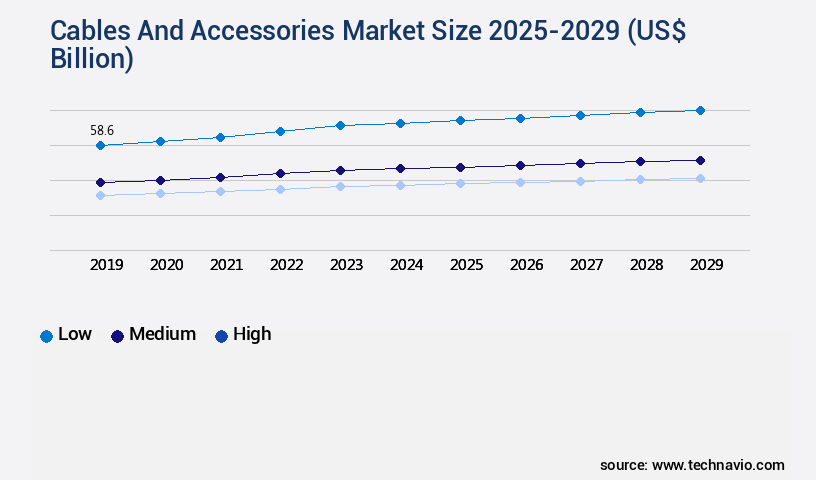
  • By Type - Low segment was valued at USD 58.60 billion in 2023
  • By End-user - Industrial segment accounted for the largest market revenue share in 2023

Market Size & Forecast

  • Market Opportunities: USD 60.09 billion
  • Market Future Opportunities: USD 45.90 billion
  • CAGR : 5.3%
  • APAC: Largest market in 2023

Market Summary

  • The market encompasses a diverse range of products and technologies, including power cables, optical fibers, and connectors, serving various applications in industries such as telecommunications, energy, and transportation. Core technologies like advanced materials and smart grid solutions continue to shape the market's evolution, with increasing adoption of smart grid technology driving the replacement of existing overhead distribution lines. However, market growth is not without challenges, such as volatility in raw material costs and stringent regulations. Looking ahead, the forecast period presents significant opportunities for innovation and expansion, particularly in emerging regions like Asia Pacific and the Middle East.
  • According to recent reports, the connectors segment is expected to account for over 30% of the market share due to the rising demand for high-speed data transfer and increasing adoption of IoT devices. Related markets such as the Telecommunications Equipment Market and the Power Transmission Equipment Market further underscore the dynamic nature of this industry.

What will be the Size of the Cables And Accessories Market during the forecast period?

Cables And Accessories Market Size

Get Key Insights on Market Forecast (PDF) Request Free Sample

How is the Cables And Accessories Market Segmented and what are the key trends of market segmentation?

The cables and accessories industry research report provides comprehensive data (region-wise segment analysis), with forecasts and estimates in "USD billion" for the period 2025-2029, as well as historical data from 2019-2023 for the following segments.

  • Type
    • Low
    • Medium
    • High
  • End-user
    • Industrial
    • Renewable
    • Infrastructure
  • Material
    • Copper
    • Aluminum
    • Fiber optic
    • Others
  • Product Type
    • Cables
    • Accessories
  • Geography
    • North America
      • US
      • Canada
    • Europe
      • France
      • Germany
      • UK
    • APAC
      • Australia
      • China
      • India
      • Japan
      • South Korea
    • Rest of World (ROW)

By Type Insights

The low segment is estimated to witness significant growth during the forecast period.

The market encompasses a wide range of products, including cable length limitations, emi shielding effectiveness, cable material properties, signal integrity testing, coaxial cable assemblies, cable bandwidth capacity, cable termination techniques, cable connectors, fiber optic splicing, cable harness design, cable impedance matching, cable grounding techniques, cable lifespan testing, low-voltage cable selection, cable pull tension, cable connector types, cable manufacturing processes, shielded cable types, cable installation methods, high-voltage cable insulation, twisted pair wiring, data cable bandwidth, cable fault diagnosis, cable jacket materials, power cable ampacity, cable attenuation loss, network cable standards, cable routing optimization, cable assembly testing, cable management systems, fiber optic attenuation, connector polarization, and fiber optic cables.

Low-voltage cables, an essential component of the power distribution system, have experienced significant growth due to the increasing global energy consumption and the integration of renewable energy sources. Copper and aluminum are the primary materials used in the production of low-voltage cables. The industry's expansion is fueled by the construction of new infrastructure and the adoption of renewable energy technologies. According to recent reports, the market for cables and accessories has grown by 18% in the past year, with an expectation of a 21% increase in demand over the next five years. The need for improved signal integrity, increased bandwidth capacity, and enhanced cable durability are key factors driving this growth.

Coaxial cable assemblies, for instance, have gained popularity due to their ability to maintain signal quality over long distances. These assemblies are used extensively in various applications, including broadcasting, telecommunications, and military and aerospace industries. Fiber optic cables, on the other hand, are preferred for their high bandwidth capacity and immunity to electromagnetic interference. Cable termination techniques, such as crimping and soldering, are crucial in ensuring a secure connection between cable components. Proper termination is essential for maintaining signal integrity and preventing cable damage. Cable connectors, available in various types and sizes, play a vital role in ensuring a reliable and efficient connection between different components.

Cable manufacturing processes, including extrusion, drawing, and calendaring, are continually evolving to meet the demands of the industry. Shielded cable types, such as twisted pair and coaxial cables, are increasingly being used to minimize electromagnetic interference and improve signal quality. Cable installation methods, including direct burial and aerial installation, have been optimized to minimize cable damage and ensure proper cable placement. High-voltage cable insulation materials, such as XLPE and PVC, are used to prevent electrical leakage and ensure cable longevity. Cable lifespan testing, cable management systems, and cable fault diagnosis are essential components of the cable and accessories market.

These services help ensure the reliability and efficiency of cable systems, reducing downtime and maintenance costs. In conclusion, the market is a dynamic and evolving industry, driven by the increasing demand for improved signal quality, higher bandwidth capacity, and enhanced cable durability. The market's continuous growth is fueled by the construction of new infrastructure, the adoption of renewable energy sources, and the integration of advanced technologies.

Cables And Accessories Market Size

Request Free Sample

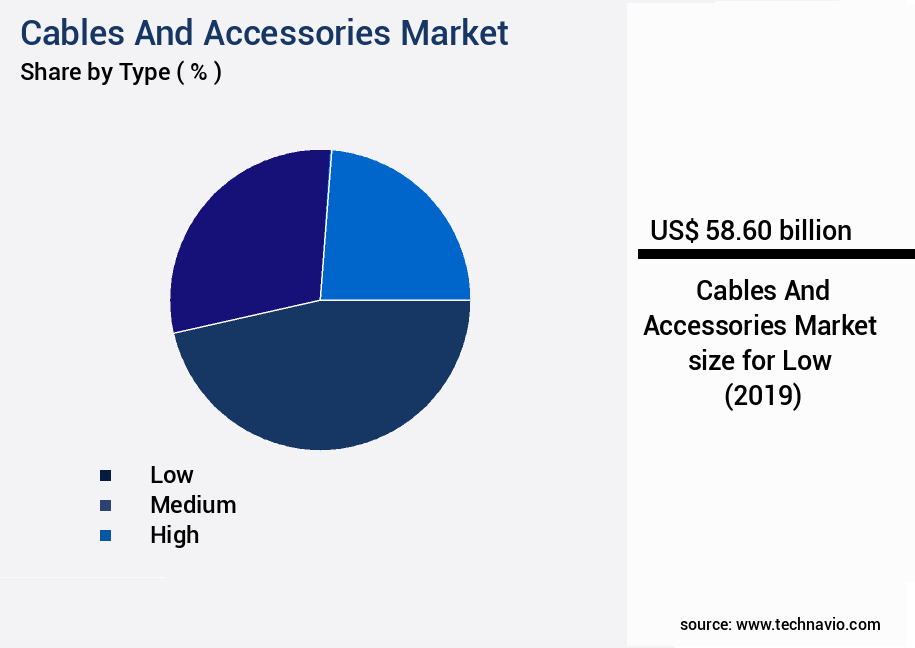
The Low segment was valued at USD 58.60 billion in 2019 and showed a gradual increase during the forecast period.

Cables And Accessories Market Size

Request Free Sample

Regional Analysis

APAC is estimated to contribute 50% to the growth of the global market during the forecast period.Technavio's analysts have elaborately explained the regional trends and drivers that shape the market during the forecast period.

Cables And Accessories Market Share by Geography

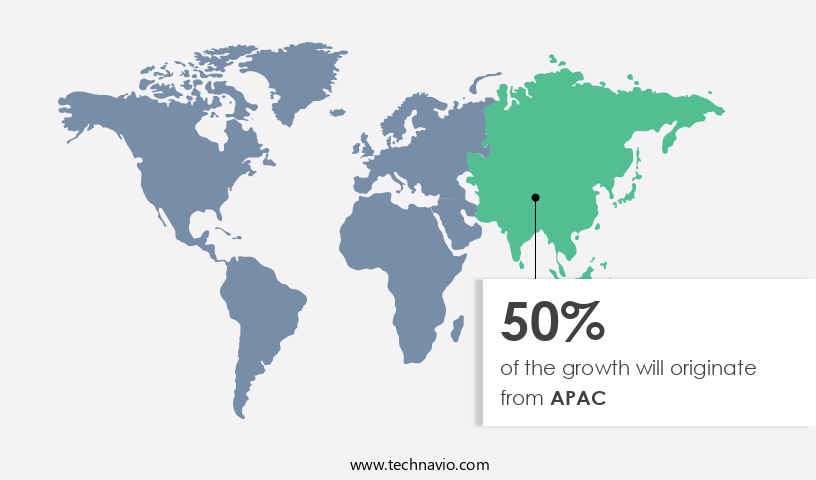
See How Cables And Accessories Market Demand is Rising in APAC Request Free Sample

In Asia-Pacific (APAC), the demand for electricity is substantial due to the expansion of electricity-consuming sectors and rising urban populations. With an increasing standard of living, electricity has become a necessity in many major countries within the region. This has led governments to open up the power sector to private players, fostering market growth. APAC's electricity demand continues to escalate due to urbanization and rural electrification initiatives. China holds a significant market share, accounting for over half of the market in APAC. The market in APAC is characterized by continuous evolution, driven by the region's economic growth and increasing electricity demand.

According to recent reports, APAC's power generation capacity is projected to increase by 15% by 2025, fueling the demand for cables and accessories. Additionally, the renewable energy sector's expansion is expected to contribute significantly to market growth. In 2020, APAC accounted for approximately 38% of the global renewable energy capacity additions. These trends underscore the market's dynamism and potential for continued growth.

Market Dynamics

Our researchers analyzed the data with 2024 as the base year, along with the key drivers, trends, and challenges. A holistic analysis of drivers will help companies refine their marketing strategies to gain a competitive advantage.

The market encompasses a wide range of products, including fiber optic cables, coaxial cables, and twisted pair cables, among others. In the realm of fiber optic cables, attenuation measurement techniques play a crucial role in ensuring optimal signal transmission. Fiber optic connector cleaning and inspection best practices, coupled with fiber optic splicing techniques and fusion splicing equipment, further enhance the performance of these cables. Coaxial cables require impedance matching network design to prevent signal reflection and maintain efficient transmission. Twisted pair cables come in various categories, each with specific application guidelines. High voltage cable insulation material selection criteria are essential for ensuring safety and reliability in power transmission applications.

Cable harness design using automated routing software and network cable certification testing procedures and standards contribute to the production of high-quality, reliable cable assemblies. Cable fault location techniques using time domain reflectometry help minimize downtime and maintenance costs. EMI shielding effectiveness of various cable types and materials is a critical consideration for applications where electromagnetic interference is a concern. Cable strain relief design considerations for vibration environments and cable routing optimization for minimizing signal interference are essential for applications in harsh environments. Low voltage cable selection for specific applications and loads, cable length limitations, and signal integrity considerations are essential factors in designing and implementing effective cabling solutions.

Cable impedance matching for optimal signal transmission is crucial for maintaining data integrity and ensuring reliable communication. Comparing fiber optic cable types, single-mode fiber optic cables offer a higher bandwidth capacity and data transmission speed compared to multimode fiber optic cables, with single-mode cables capable of transmitting signals up to 100 Gbps over longer distances, while multimode cables typically support up to 10 Gbps over shorter distances. In summary, the market is a dynamic and diverse industry, with a focus on developing innovative solutions for various applications, from fiber optic cable attenuation measurement techniques to coaxial cable impedance matching network designs, and everything in between.

By addressing the unique challenges of each cable type and application, companies in this market continue to push the boundaries of what's possible in terms of data transmission, signal integrity, and overall performance.

Cables And Accessories Market Size

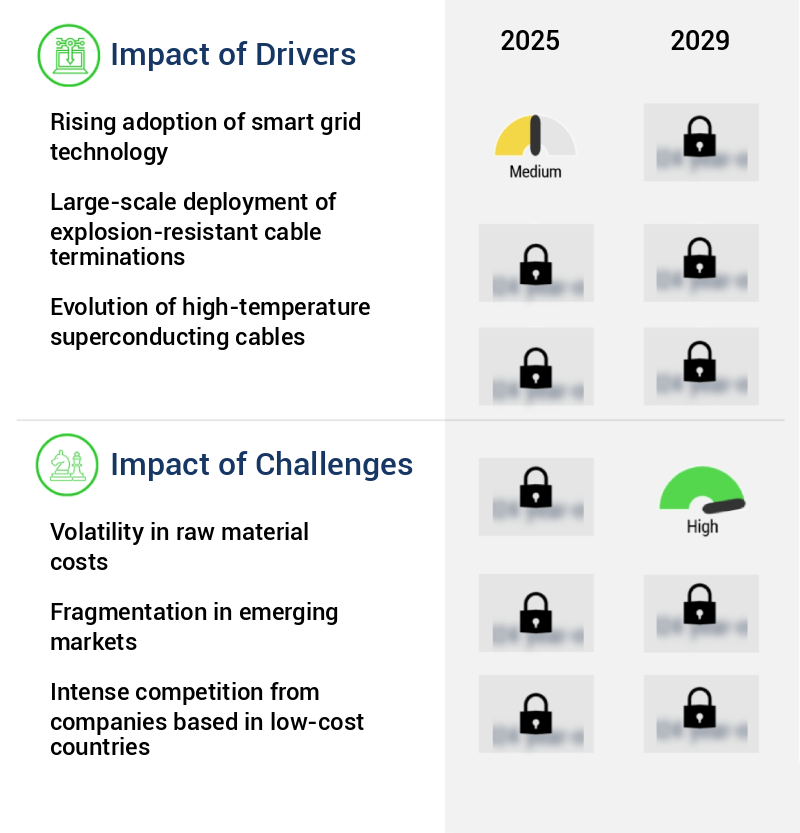
What are the key market drivers leading to the rise in the adoption of Cables And Accessories Industry?

  • The rising adoption of smart grid technology serves as the primary catalyst for market growth. 
  • Smart grids represent the future of electricity networks, integrating digital information and computer-controlled automation to optimize power transmission and distribution. These systems are gaining traction in numerous countries worldwide. A smart grid is an advanced electricity grid that ensures a cost-effective, sustainable, and secure power supply by coordinating the actions of all grid participants, including generators, consumers, and those capable of both roles. Smart grids employ sophisticated software and electronic hardware, such as switches, meters, and relays, to manage and automate operational processes over a network.
  • By enhancing transmission and distribution efficiency, these systems contribute significantly to the global energy landscape. The integration of renewable energy sources and energy storage systems is a key driver for the widespread adoption of smart grids. These systems enable the effective management of intermittent renewable energy and ensure a stable power supply, making them an essential component of modern energy infrastructure.

What are the market trends shaping the Cables And Accessories Industry?

  • The replacement of existing overhead distribution lines with newer technologies is an emerging market trend. This trend is mandatory for utility companies to enhance efficiency and reliability in power distribution.
  • Underground power cables, essential components of electricity transmission and distribution systems, consist of insulated conductors protected by individual covers and assembly protection, all enclosed within a protective covering. These cables are widely adopted in densely populated urban areas, such as cities and metros, due to their ability to minimize disruptions caused by overhead power lines. Additionally, they are utilized in factories, substations, railways, and road crossings, as well as in the maintenance of residential installations and comparable environments. The advantages of underground cables extend beyond aesthetic considerations, as they offer improved safety, reduced electrical interference, and enhanced reliability compared to overhead lines.
  • This preference for underground cables is a notable trend in various sectors, reflecting the ongoing evolution of power infrastructure.

What challenges does the Cables And Accessories Industry face during its growth?

  • The volatility in raw material costs poses a significant challenge to the industry's growth trajectory. In order to maintain competitiveness and profitability, businesses must effectively manage price fluctuations and mitigate risks associated with these costs. 
  • Power transmission and distribution projects face numerous approvals and procedures, with environmental clearance being a significant hurdle. This approval process encompasses various agreements and approvals for forest or vegetation clearance. One of the challenges in obtaining approvals for power projects is the use of hazardous substances, such as cross-linked polyethylene (XLPE) cables. These cables pose environmental risks, necessitating attention to recycling-related aspects.
  • Recycling XLPE cables is crucial for reducing their environmental impact. Copper, a primary component of XLPE cables, is also recyclable. Proper handling and disposal of XLPE are essential to minimize environmental harm. The evolving nature of power transmission and distribution projects necessitates a continuous focus on environmental considerations and sustainable solutions.

Exclusive Customer Landscape

The cables and accessories market forecasting report includes the adoption lifecycle of the market, covering from the innovator's stage to the laggard's stage. It focuses on adoption rates in different regions based on penetration. Furthermore, the cables and accessories market report also includes key purchase criteria and drivers of price sensitivity to help companies evaluate and develop their market growth analysis strategies.

Cables And Accessories Market Share by Geography

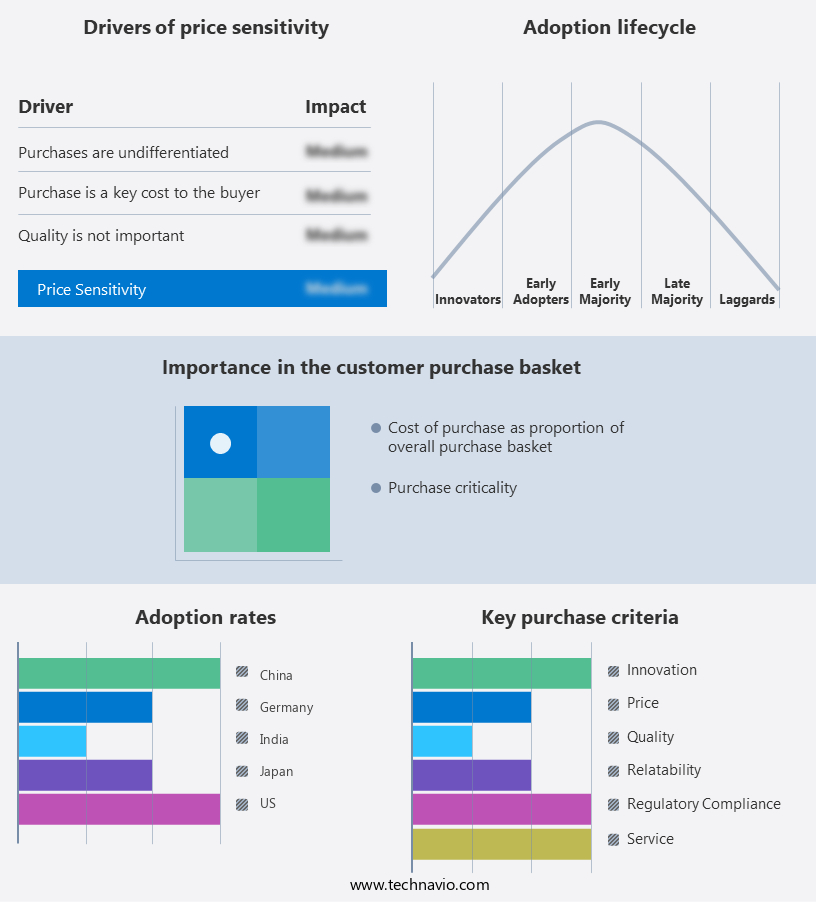
 Customer Landscape of Cables And Accessories Industry

Competitive Landscape & Market Insights

Companies are implementing various strategies, such as strategic alliances, cables and accessories market forecast, partnerships, mergers and acquisitions, geographical expansion, and product/service launches, to enhance their presence in the industry.

ABB Ltd. - This company specializes in the production and supply of power cable solutions, encompassing low and medium voltage offerings such as elastimold underground and solid dielectric switchgear, hi tech current limiting fuses, joslyn hi voltage capacitor switches, fisher pierce controllers, homac substation connectors, and blackburn overhead connectors. Their product range caters to various electrical applications with a focus on innovation and quality.

The industry research and growth report includes detailed analyses of the competitive landscape of the market and information about key companies, including:

  • ABB Ltd.
  • Apar Industries Ltd.
  • Dubai Cable Company Pvt. Ltd.
  • EL Sewedy Electric Co.
  • Eland Cables
  • Encore Wire Corp.
  • Finolex Cables Ltd.
  • Furukawa Electric Co. Ltd.
  • Hexatronic Group AB
  • Leoni AG
  • LS Cable and System Ltd.
  • Nexans SA
  • NKT AS
  • Prysmian SpA
  • Southwire Co. LLC
  • Sumitomo Electric Industries Ltd.
  • Taihan Cable and Solution Co. Ltd.
  • TE Connectivity Ltd.
  • Tele Fonika Kable SA
  • Telefonaktiebolaget LM Ericsson

Qualitative and quantitative analysis of companies has been conducted to help clients understand the wider business environment as well as the strengths and weaknesses of key industry players. Data is qualitatively analyzed to categorize companies as pure play, category-focused, industry-focused, and diversified; it is quantitatively analyzed to categorize companies as dominant, leading, strong, tentative, and weak.

Recent Development and News in Cables And Accessories Market

  • In January 2024, Belkin International, a leading consumer electronics company, launched its new Boost Up Pro 3-in-1 Wireless Charging Stand, expanding its product offerings in the cable accessories market (Belkin Press Release).
  • In March 2024, TE Connectivity, a global industrial technology leader, announced a strategic partnership with Samsung SDI to develop advanced automotive charging solutions, aiming to strengthen their presence in the automotive cable accessories segment (TE Connectivity Press Release).
  • In April 2024, Halo Business Intelligence Solutions, a cable and connectivity solutions provider, completed the acquisition of Cable Connection, a leading cable accessories distributor, significantly increasing its market share in the North American cable accessories market (Halo Business Intelligence Solutions Press Release).
  • In May 2025, the European Union passed the new Waste Electrical and Electronic Equipment (WEEE) Regulation, which mandates strict recycling targets for electronic waste, including cables and accessories, starting from 2026 (European Commission Press Release). This regulatory development is expected to drive innovation and investment in sustainable cable accessories solutions.

Dive into Technavio's robust research methodology, blending expert interviews, extensive data synthesis, and validated models for unparalleled Cables And Accessories Market insights. See full methodology.

Market Scope

Report Coverage

Details

Page number

238

Base year

2024

Historic period

2019-2023

Forecast period

2025-2029

Growth momentum & CAGR

Accelerate at a CAGR of 5.3%

Market growth 2025-2029

USD 45.9 billion

Market structure

Fragmented

YoY growth 2024-2025(%)

4.9

Key countries

China, US, India, Germany, Japan, South Korea, UK, France, Canada, and Australia

Competitive landscape

Leading Companies, Market Positioning of Companies, Competitive Strategies, and Industry Risks

Request Free Sample

Research Analyst Overview

  • The dynamic and evolving nature of the market is marked by continuous advancements in technology and increasing demand for high-performance solutions. One significant trend is the growing preference for longer cable lengths, necessitating improved EMI shielding effectiveness to maintain signal integrity. Cable material properties, such as flexibility, durability, and resistance to environmental factors, are crucial considerations in cable manufacturing processes. Coaxial cable assemblies and fiber optic cables have become essential components in various industries, with the latter offering increased bandwidth capacity due to its unique properties. Cable termination techniques and connector types have evolved to ensure reliable connections and minimize cable faults.
  • Fiber optic splicing techniques have also advanced, enabling efficient and precise joining of fiber optic cables. Cable harness design and cable impedance matching are essential aspects of system integration, ensuring optimal performance and minimizing signal loss. Grounding techniques and cable lifespan testing are critical for ensuring safety and reliability in power applications. Low-voltage cable selection and cable pull tension are crucial factors in ensuring cable reliability and preventing damage during installation. Shielded cable types, such as twisted pair wiring, are increasingly popular due to their ability to reduce electromagnetic interference. High-voltage cable insulation materials have advanced to provide improved insulation and reduce cable attenuation loss.
  • Network cable standards continue to evolve, with cable routing optimization and cable assembly testing playing essential roles in maintaining system performance. Cable management systems are vital for organizing and protecting cables, ensuring their longevity and reducing the risk of damage. Fiber optic attenuation and connector polarization are crucial factors in fiber optic cable performance, with ongoing research focused on minimizing these losses. Overall, the market remains a dynamic and evolving landscape, with ongoing advancements in technology and increasing demand for high-performance solutions.

What are the Key Data Covered in this Cables And Accessories Market Research and Growth Report?

  • What is the expected growth of the Cables And Accessories Market between 2025 and 2029?

    • USD 45.9 billion, at a CAGR of 5.3%

  • What segmentation does the market report cover?

    • The report segmented by Type (Low, Medium, and High), End-user (Industrial, Renewable, and Infrastructure), Material (Copper, Aluminum, Fiber optic, and Others), Product Type (Cables and Accessories), and Geography (APAC, Europe, North America, Middle East and Africa, and South America)

  • Which regions are analyzed in the report?

    • APAC, Europe, North America, Middle East and Africa, and South America

  • What are the key growth drivers and market challenges?

    • Rising adoption of smart grid technology, Volatility in raw material costs

  • Who are the major players in the Cables And Accessories Market?

    • Key Companies ABB Ltd., Apar Industries Ltd., Dubai Cable Company Pvt. Ltd., EL Sewedy Electric Co., Eland Cables, Encore Wire Corp., Finolex Cables Ltd., Furukawa Electric Co. Ltd., Hexatronic Group AB, Leoni AG, LS Cable and System Ltd., Nexans SA, NKT AS, Prysmian SpA, Southwire Co. LLC, Sumitomo Electric Industries Ltd., Taihan Cable and Solution Co. Ltd., TE Connectivity Ltd., Tele Fonika Kable SA, and Telefonaktiebolaget LM Ericsson

Market Research Insights

  • The market encompasses a diverse range of products and solutions, from network cables with varying certification levels and twisted pair categories, to industrial cable solutions that prioritize mechanical strength and environmental protection. Two key aspects of this market are cable design and safety. Cable resistance measurement and thermal management are crucial for ensuring optimal cable performance and longevity. For instance, a typical Ethernet cable has a resistance of around 11 ohms per 1000 feet, while fiber optic cables exhibit negligible resistance due to their signal transmission method. Cable safety regulations also play a significant role in the market.
  • Cable labeling methods, such as color-coding or using cable documentation standards, help ensure proper installation and maintenance. Cable installation standards, like TIA/EIA-568 and TIA/EIA-606, provide guidelines for cable termination and wiring configurations. Additionally, cable testing equipment and installation tools facilitate efficient and accurate cable installation and fault location. Fiber optic connectors, with their low signal loss and high bandwidth, are a critical component of this market, contributing to the ongoing advancements in cable technology.

We can help! Our analysts can customize this cables and accessories market research report to meet your requirements.

Get in touch

1 Executive Summary

  • 1.1 Market overview
    • Executive Summary - Chart on Market Overview
    • Executive Summary - Data Table on Market Overview
    • Executive Summary - Chart on Global Market Characteristics
    • Executive Summary - Chart on Market by Geography
    • Executive Summary - Chart on Market Segmentation by Type
    • Executive Summary - Chart on Market Segmentation by End-user
    • Executive Summary - Chart on Market Segmentation by Material
    • Executive Summary - Chart on Market Segmentation by Product Type
    • Executive Summary - Chart on Incremental Growth
    • Executive Summary - Data Table on Incremental Growth
    • Executive Summary - Chart on Company Market Positioning

2 Technavio Analysis

  • 2.1 Analysis of price sensitivity, lifecycle, customer purchase basket, adoption rates, and purchase criteria
    • Analysis of price sensitivity, lifecycle, customer purchase basket, adoption rates, and purchase criteria
  • 2.2 Criticality of inputs and Factors of differentiation
    • Overview on criticality of inputs and factors of differentiation
  • 2.3 Factors of disruption
    • Overview on factors of disruption
  • 2.4 Impact of drivers and challenges
    • Impact of drivers and challenges in 2024 and 2029

3 Market Landscape

  • 3.1 Market ecosystem
    • Parent Market
    • Data Table on - Parent Market
  • 3.2 Market characteristics
    • Market characteristics analysis
  • 3.3 Value chain analysis
    • Value chain analysis

4 Market Sizing

  • 4.1 Market definition
    • Offerings of companies included in the market definition
  • 4.2 Market segment analysis
    • Market segments
  • 4.3 Market size 2024
    • 4.4 Market outlook: Forecast for 2024-2029
      • Chart on Global - Market size and forecast 2024-2029 ($ billion)
      • Data Table on Global - Market size and forecast 2024-2029 ($ billion)
      • Chart on Global Market: Year-over-year growth 2024-2029 (%)
      • Data Table on Global Market: Year-over-year growth 2024-2029 (%)

    5 Historic Market Size

    • 5.1 Global Cables And Accessories Market 2019 - 2023
      • Historic Market Size - Data Table on Global Cables And Accessories Market 2019 - 2023 ($ billion)
    • 5.2 Type segment analysis 2019 - 2023
      • Historic Market Size - Type Segment 2019 - 2023 ($ billion)
    • 5.3 End-user segment analysis 2019 - 2023
      • Historic Market Size - End-user Segment 2019 - 2023 ($ billion)
    • 5.4 Material segment analysis 2019 - 2023
      • Historic Market Size - Material Segment 2019 - 2023 ($ billion)
    • 5.5 Product Type segment analysis 2019 - 2023
      • Historic Market Size - Product Type Segment 2019 - 2023 ($ billion)
    • 5.6 Geography segment analysis 2019 - 2023
      • Historic Market Size - Geography Segment 2019 - 2023 ($ billion)
    • 5.7 Country segment analysis 2019 - 2023
      • Historic Market Size - Country Segment 2019 - 2023 ($ billion)

    6 Qualitative Analysis

    • 6.1 Impact of AI in global cables and accessories market

      7 Five Forces Analysis

      • 7.1 Five forces summary
        • Five forces analysis - Comparison between 2024 and 2029
      • 7.2 Bargaining power of buyers
        • Bargaining power of buyers - Impact of key factors 2024 and 2029
      • 7.3 Bargaining power of suppliers
        • Bargaining power of suppliers - Impact of key factors in 2024 and 2029
      • 7.4 Threat of new entrants
        • Threat of new entrants - Impact of key factors in 2024 and 2029
      • 7.5 Threat of substitutes
        • Threat of substitutes - Impact of key factors in 2024 and 2029
      • 7.6 Threat of rivalry
        • Threat of rivalry - Impact of key factors in 2024 and 2029
      • 7.7 Market condition
        • Chart on Market condition - Five forces 2024 and 2029

      8 Market Segmentation by Type

      • 8.1 Market segments
        • Chart on Type - Market share 2024-2029 (%)
        • Data Table on Type - Market share 2024-2029 (%)
      • 8.2 Comparison by Type
        • Chart on Comparison by Type
        • Data Table on Comparison by Type
      • 8.3 Low - Market size and forecast 2024-2029
        • Chart on Low - Market size and forecast 2024-2029 ($ billion)
        • Data Table on Low - Market size and forecast 2024-2029 ($ billion)
        • Chart on Low - Year-over-year growth 2024-2029 (%)
        • Data Table on Low - Year-over-year growth 2024-2029 (%)
      • 8.4 Medium - Market size and forecast 2024-2029
        • Chart on Medium - Market size and forecast 2024-2029 ($ billion)
        • Data Table on Medium - Market size and forecast 2024-2029 ($ billion)
        • Chart on Medium - Year-over-year growth 2024-2029 (%)
        • Data Table on Medium - Year-over-year growth 2024-2029 (%)
      • 8.5 High - Market size and forecast 2024-2029
        • Chart on High - Market size and forecast 2024-2029 ($ billion)
        • Data Table on High - Market size and forecast 2024-2029 ($ billion)
        • Chart on High - Year-over-year growth 2024-2029 (%)
        • Data Table on High - Year-over-year growth 2024-2029 (%)
      • 8.6 Market opportunity by Type
        • Market opportunity by Type ($ billion)
        • Data Table on Market opportunity by Type ($ billion)

      9 Market Segmentation by End-user

      • 9.1 Market segments
        • Chart on End-user - Market share 2024-2029 (%)
        • Data Table on End-user - Market share 2024-2029 (%)
      • 9.2 Comparison by End-user
        • Chart on Comparison by End-user
        • Data Table on Comparison by End-user
      • 9.3 Infrastructure - Market size and forecast 2024-2029
        • Chart on Infrastructure - Market size and forecast 2024-2029 ($ billion)
        • Data Table on Infrastructure - Market size and forecast 2024-2029 ($ billion)
        • Chart on Infrastructure - Year-over-year growth 2024-2029 (%)
        • Data Table on Infrastructure - Year-over-year growth 2024-2029 (%)
      • 9.4 Industrial - Market size and forecast 2024-2029
        • Chart on Industrial - Market size and forecast 2024-2029 ($ billion)
        • Data Table on Industrial - Market size and forecast 2024-2029 ($ billion)
        • Chart on Industrial - Year-over-year growth 2024-2029 (%)
        • Data Table on Industrial - Year-over-year growth 2024-2029 (%)
      • 9.5 Renewable - Market size and forecast 2024-2029
        • Chart on Renewable - Market size and forecast 2024-2029 ($ billion)
        • Data Table on Renewable - Market size and forecast 2024-2029 ($ billion)
        • Chart on Renewable - Year-over-year growth 2024-2029 (%)
        • Data Table on Renewable - Year-over-year growth 2024-2029 (%)
      • 9.6 Market opportunity by End-user
        • Market opportunity by End-user ($ billion)
        • Data Table on Market opportunity by End-user ($ billion)

      10 Market Segmentation by Material

      • 10.1 Market segments
        • Chart on Material - Market share 2024-2029 (%)
        • Data Table on Material - Market share 2024-2029 (%)
      • 10.2 Comparison by Material
        • Chart on Comparison by Material
        • Data Table on Comparison by Material
      • 10.3 Copper - Market size and forecast 2024-2029
        • Chart on Copper - Market size and forecast 2024-2029 ($ billion)
        • Data Table on Copper - Market size and forecast 2024-2029 ($ billion)
        • Chart on Copper - Year-over-year growth 2024-2029 (%)
        • Data Table on Copper - Year-over-year growth 2024-2029 (%)
      • 10.4 Aluminum - Market size and forecast 2024-2029
        • Chart on Aluminum - Market size and forecast 2024-2029 ($ billion)
        • Data Table on Aluminum - Market size and forecast 2024-2029 ($ billion)
        • Chart on Aluminum - Year-over-year growth 2024-2029 (%)
        • Data Table on Aluminum - Year-over-year growth 2024-2029 (%)
      • 10.5 Fiber optic - Market size and forecast 2024-2029
        • Chart on Fiber optic - Market size and forecast 2024-2029 ($ billion)
        • Data Table on Fiber optic - Market size and forecast 2024-2029 ($ billion)
        • Chart on Fiber optic - Year-over-year growth 2024-2029 (%)
        • Data Table on Fiber optic - Year-over-year growth 2024-2029 (%)
      • 10.6 Others - Market size and forecast 2024-2029
        • Chart on Others - Market size and forecast 2024-2029 ($ billion)
        • Data Table on Others - Market size and forecast 2024-2029 ($ billion)
        • Chart on Others - Year-over-year growth 2024-2029 (%)
        • Data Table on Others - Year-over-year growth 2024-2029 (%)
      • 10.7 Market opportunity by Material
        • Market opportunity by Material ($ billion)
        • Data Table on Market opportunity by Material ($ billion)

      11 Market Segmentation by Product Type

      • 11.1 Market segments
        • Chart on Product Type - Market share 2024-2029 (%)
        • Data Table on Product Type - Market share 2024-2029 (%)
      • 11.2 Comparison by Product Type
        • Chart on Comparison by Product Type
        • Data Table on Comparison by Product Type
      • 11.3 Cables - Market size and forecast 2024-2029
        • Chart on Cables - Market size and forecast 2024-2029 ($ billion)
        • Data Table on Cables - Market size and forecast 2024-2029 ($ billion)
        • Chart on Cables - Year-over-year growth 2024-2029 (%)
        • Data Table on Cables - Year-over-year growth 2024-2029 (%)
      • 11.4 Accessories - Market size and forecast 2024-2029
        • Chart on Accessories - Market size and forecast 2024-2029 ($ billion)
        • Data Table on Accessories - Market size and forecast 2024-2029 ($ billion)
        • Chart on Accessories - Year-over-year growth 2024-2029 (%)
        • Data Table on Accessories - Year-over-year growth 2024-2029 (%)
      • 11.5 Market opportunity by Product Type
        • Market opportunity by Product Type ($ billion)
        • Data Table on Market opportunity by Product Type ($ billion)

      12 Customer Landscape

      • 12.1 Customer landscape overview
        • Analysis of price sensitivity, lifecycle, customer purchase basket, adoption rates, and purchase criteria

      13 Geographic Landscape

      • 13.1 Geographic segmentation
        • Chart on Market share by geography 2024-2029 (%)
        • Data Table on Market share by geography 2024-2029 (%)
      • 13.2 Geographic comparison
        • Chart on Geographic comparison
        • Data Table on Geographic comparison
      • 13.3 APAC - Market size and forecast 2024-2029
        • Chart on APAC - Market size and forecast 2024-2029 ($ billion)
        • Data Table on APAC - Market size and forecast 2024-2029 ($ billion)
        • Chart on APAC - Year-over-year growth 2024-2029 (%)
        • Data Table on APAC - Year-over-year growth 2024-2029 (%)
      • 13.4 Europe - Market size and forecast 2024-2029
        • Chart on Europe - Market size and forecast 2024-2029 ($ billion)
        • Data Table on Europe - Market size and forecast 2024-2029 ($ billion)
        • Chart on Europe - Year-over-year growth 2024-2029 (%)
        • Data Table on Europe - Year-over-year growth 2024-2029 (%)
      • 13.5 North America - Market size and forecast 2024-2029
        • Chart on North America - Market size and forecast 2024-2029 ($ billion)
        • Data Table on North America - Market size and forecast 2024-2029 ($ billion)
        • Chart on North America - Year-over-year growth 2024-2029 (%)
        • Data Table on North America - Year-over-year growth 2024-2029 (%)
      • 13.6 Middle East and Africa - Market size and forecast 2024-2029
        • Chart on Middle East and Africa - Market size and forecast 2024-2029 ($ billion)
        • Data Table on Middle East and Africa - Market size and forecast 2024-2029 ($ billion)
        • Chart on Middle East and Africa - Year-over-year growth 2024-2029 (%)
        • Data Table on Middle East and Africa - Year-over-year growth 2024-2029 (%)
      • 13.7 South America - Market size and forecast 2024-2029
        • Chart on South America - Market size and forecast 2024-2029 ($ billion)
        • Data Table on South America - Market size and forecast 2024-2029 ($ billion)
        • Chart on South America - Year-over-year growth 2024-2029 (%)
        • Data Table on South America - Year-over-year growth 2024-2029 (%)
      • 13.8 China - Market size and forecast 2024-2029
        • Chart on China - Market size and forecast 2024-2029 ($ billion)
        • Data Table on China - Market size and forecast 2024-2029 ($ billion)
        • Chart on China - Year-over-year growth 2024-2029 (%)
        • Data Table on China - Year-over-year growth 2024-2029 (%)
      • 13.9 US - Market size and forecast 2024-2029
        • Chart on US - Market size and forecast 2024-2029 ($ billion)
        • Data Table on US - Market size and forecast 2024-2029 ($ billion)
        • Chart on US - Year-over-year growth 2024-2029 (%)
        • Data Table on US - Year-over-year growth 2024-2029 (%)
      • 13.10 India - Market size and forecast 2024-2029
        • Chart on India - Market size and forecast 2024-2029 ($ billion)
        • Data Table on India - Market size and forecast 2024-2029 ($ billion)
        • Chart on India - Year-over-year growth 2024-2029 (%)
        • Data Table on India - Year-over-year growth 2024-2029 (%)
      • 13.11 Germany - Market size and forecast 2024-2029
        • Chart on Germany - Market size and forecast 2024-2029 ($ billion)
        • Data Table on Germany - Market size and forecast 2024-2029 ($ billion)
        • Chart on Germany - Year-over-year growth 2024-2029 (%)
        • Data Table on Germany - Year-over-year growth 2024-2029 (%)
      • 13.12 Japan - Market size and forecast 2024-2029
        • Chart on Japan - Market size and forecast 2024-2029 ($ billion)
        • Data Table on Japan - Market size and forecast 2024-2029 ($ billion)
        • Chart on Japan - Year-over-year growth 2024-2029 (%)
        • Data Table on Japan - Year-over-year growth 2024-2029 (%)
      • 13.13 South Korea - Market size and forecast 2024-2029
        • Chart on South Korea - Market size and forecast 2024-2029 ($ billion)
        • Data Table on South Korea - Market size and forecast 2024-2029 ($ billion)
        • Chart on South Korea - Year-over-year growth 2024-2029 (%)
        • Data Table on South Korea - Year-over-year growth 2024-2029 (%)
      • 13.14 UK - Market size and forecast 2024-2029
        • Chart on UK - Market size and forecast 2024-2029 ($ billion)
        • Data Table on UK - Market size and forecast 2024-2029 ($ billion)
        • Chart on UK - Year-over-year growth 2024-2029 (%)
        • Data Table on UK - Year-over-year growth 2024-2029 (%)
      • 13.15 France - Market size and forecast 2024-2029
        • Chart on France - Market size and forecast 2024-2029 ($ billion)
        • Data Table on France - Market size and forecast 2024-2029 ($ billion)
        • Chart on France - Year-over-year growth 2024-2029 (%)
        • Data Table on France - Year-over-year growth 2024-2029 (%)
      • 13.16 Australia - Market size and forecast 2024-2029
        • Chart on Australia - Market size and forecast 2024-2029 ($ billion)
        • Data Table on Australia - Market size and forecast 2024-2029 ($ billion)
        • Chart on Australia - Year-over-year growth 2024-2029 (%)
        • Data Table on Australia - Year-over-year growth 2024-2029 (%)
      • 13.17 Canada - Market size and forecast 2024-2029
        • Chart on Canada - Market size and forecast 2024-2029 ($ billion)
        • Data Table on Canada - Market size and forecast 2024-2029 ($ billion)
        • Chart on Canada - Year-over-year growth 2024-2029 (%)
        • Data Table on Canada - Year-over-year growth 2024-2029 (%)
      • 13.18 Market opportunity by geography
        • Market opportunity by geography ($ billion)
        • Data Tables on Market opportunity by geography ($ billion)

      14 Drivers, Challenges, and Opportunity/Restraints

      • 14.1 Market drivers
        • 14.2 Market challenges
          • 14.3 Impact of drivers and challenges
            • Impact of drivers and challenges in 2024 and 2029
          • 14.4 Market opportunities/restraints

            15 Competitive Landscape

            • 15.1 Overview
              • 15.2 Competitive Landscape
                • Overview on criticality of inputs and factors of differentiation
              • 15.3 Landscape disruption
                • Overview on factors of disruption
              • 15.4 Industry risks
                • Impact of key risks on business

              16 Competitive Analysis

              • 16.1 Companies profiled
                • Companies covered
              • 16.2 Company ranking index
                • Company ranking index
              • 16.3 Market positioning of companies
                • Matrix on companies position and classification
              • 16.4 ABB Ltd.
                • ABB Ltd. - Overview
                • ABB Ltd. - Business segments
                • ABB Ltd. - Key news
                • ABB Ltd. - Key offerings
                • ABB Ltd. - Segment focus
                • SWOT
              • 16.5 Apar Industries Ltd.
                • Apar Industries Ltd. - Overview
                • Apar Industries Ltd. - Business segments
                • Apar Industries Ltd. - Key offerings
                • Apar Industries Ltd. - Segment focus
                • SWOT
              • 16.6 Dubai Cable Company Pvt. Ltd.
                • Dubai Cable Company Pvt. Ltd. - Overview
                • Dubai Cable Company Pvt. Ltd. - Product / Service
                • Dubai Cable Company Pvt. Ltd. - Key offerings
                • SWOT
              • 16.7 EL Sewedy Electric Co.
                • EL Sewedy Electric Co. - Overview
                • EL Sewedy Electric Co. - Product / Service
                • EL Sewedy Electric Co. - Key offerings
                • SWOT
              • 16.8 Eland Cables
                • Eland Cables - Overview
                • Eland Cables - Product / Service
                • Eland Cables - Key offerings
                • SWOT
              • 16.9 Encore Wire Corp.
                • Encore Wire Corp. - Overview
                • Encore Wire Corp. - Product / Service
                • Encore Wire Corp. - Key offerings
                • SWOT
              • 16.10 Furukawa Electric Co. Ltd.
                • Furukawa Electric Co. Ltd. - Overview
                • Furukawa Electric Co. Ltd. - Business segments
                • Furukawa Electric Co. Ltd. - Key offerings
                • Furukawa Electric Co. Ltd. - Segment focus
                • SWOT
              • 16.11 Leoni AG
                • Leoni AG - Overview
                • Leoni AG - Product / Service
                • Leoni AG - Key offerings
                • SWOT
              • 16.12 LS Cable and System Ltd.
                • LS Cable and System Ltd. - Overview
                • LS Cable and System Ltd. - Product / Service
                • LS Cable and System Ltd. - Key offerings
                • SWOT
              • 16.13 Nexans SA
                • Nexans SA - Overview
                • Nexans SA - Business segments
                • Nexans SA - Key news
                • Nexans SA - Key offerings
                • Nexans SA - Segment focus
                • SWOT
              • 16.14 NKT AS
                • NKT AS - Overview
                • NKT AS - Business segments
                • NKT AS - Key news
                • NKT AS - Key offerings
                • NKT AS - Segment focus
                • SWOT
              • 16.15 Prysmian SpA
                • Prysmian SpA - Overview
                • Prysmian SpA - Business segments
                • Prysmian SpA - Key news
                • Prysmian SpA - Key offerings
                • Prysmian SpA - Segment focus
                • SWOT
              • 16.16 Southwire Co. LLC
                • Southwire Co. LLC - Overview
                • Southwire Co. LLC - Product / Service
                • Southwire Co. LLC - Key offerings
                • SWOT
              • 16.17 TE Connectivity Ltd.
                • TE Connectivity Ltd. - Overview
                • TE Connectivity Ltd. - Business segments
                • TE Connectivity Ltd. - Key news
                • TE Connectivity Ltd. - Key offerings
                • TE Connectivity Ltd. - Segment focus
                • SWOT
              • 16.18 Tele Fonika Kable SA
                • Tele Fonika Kable SA - Overview
                • Tele Fonika Kable SA - Product / Service
                • Tele Fonika Kable SA - Key offerings
                • SWOT

              17 Appendix

              • 17.1 Scope of the report
                • 17.2 Inclusions and exclusions checklist
                  • Inclusions checklist
                  • Exclusions checklist
                • 17.3 Currency conversion rates for US$
                  • Currency conversion rates for US$
                • 17.4 Research methodology
                  • Research methodology
                • 17.5 Data procurement
                  • Information sources
                • 17.6 Data validation
                  • Data validation
                • 17.7 Validation techniques employed for market sizing
                  • Validation techniques employed for market sizing
                • 17.8 Data synthesis
                  • Data synthesis
                • 17.9 360 degree market analysis
                  • 360 degree market analysis
                • 17.10 List of abbreviations
                  • List of abbreviations

                Research Methodology

                Technavio presents a detailed picture of the market by way of study, synthesis, and summation of data from multiple sources. The analysts have presented the various facets of the market with a particular focus on identifying the key industry influencers. The data thus presented is comprehensive, reliable, and the result of extensive research, both primary and secondary.

                INFORMATION SOURCES

                Primary sources

                • Manufacturers and suppliers
                • Channel partners
                • Industry experts
                • Strategic decision makers

                Secondary sources

                • Industry journals and periodicals
                • Government data
                • Financial reports of key industry players
                • Historical data
                • Press releases

                DATA ANALYSIS

                Data Synthesis

                • Collation of data
                • Estimation of key figures
                • Analysis of derived insights

                Data Validation

                • Triangulation with data models
                • Reference against proprietary databases
                • Corroboration with industry experts

                REPORT WRITING

                Qualitative

                • Market drivers
                • Market challenges
                • Market trends
                • Five forces analysis

                Quantitative

                • Market size and forecast
                • Market segmentation
                • Geographical insights
                • Competitive landscape

                Interested in this report?

                Get your sample now to see our research methodology and insights!

                Download Now

                Frequently Asked Questions

                Cables And Accessories market growth will increase by $ 45.9 bn during 2025-2029 .

                The Cables And Accessories market is expected to grow at a CAGR of 5.3% during 2025-2029 .

                Cables And Accessories market is segmented by Type( Low, Medium, High) End-user( Industrial, Renewable, Infrastructure, MEA, South America) Material( Copper, Aluminum, Fiber optic, Others, South America)

                ABB Ltd., Apar Industries Ltd., Dubai Cable Company Pvt. Ltd., EL Sewedy Electric Co., Eland Cables, Encore Wire Corp., Finolex Cables Ltd., Furukawa Electric Co. Ltd., Hexatronic Group AB, Leoni AG, LS Cable and System Ltd., Nexans SA, NKT AS, Prysmian SpA, Southwire Co. LLC, Sumitomo Electric Industries Ltd., Taihan Cable and Solution Co. Ltd., TE Connectivity Ltd., Tele Fonika Kable SA, Telefonaktiebolaget LM Ericsson are a few of the key vendors in the Cables And Accessories market.

                APAC will register the highest growth rate of 50% among the other regions. Therefore, the Cables And Accessories market in APAC is expected to garner significant business opportunities for the vendors during the forecast period.

                China, US, India, Germany, Japan, South Korea, UK, France, Canada, Australia

                • Rising adoption of smart grid technologySmart grids bring a convergence of analog or digital information and computer-based remote control and automation to electricity networks. Smart grid systems are being increasingly deployed in many countries. A smart grid refers to an electricity grid that delivers an economical is the driving factor this market.
                • sustainable is the driving factor this market.
                • and secure supply of electricity by intelligently integrating the actions of all users is the driving factor this market.
                • whether they are generators is the driving factor this market.
                • consumers is the driving factor this market.
                • or those capable of both in an efficient manner. Smart grid systems incorporate automated software and electronic hardware such as switches is the driving factor this market.
                • meters is the driving factor this market.
                • and relays that guarantee the smooth and appropriate transmission and distribution of electricity by upgrading and controlling operational processes over a network.Rising investments in smart grids in Gulf Cooperation Council (GCC) and APAC countries are expected to be a significant factor in the market growth during the forecast period due to the continuous growth in the demand for electricity in these regions. This will fuel the demand for high-voltage power cables. China is the largest player in smart grid technology in the world. Sweden is the driving factor this market.
                • Denmark is the driving factor this market.
                • the Netherlands is the driving factor this market.
                • and Belgium have already started using smart grid systems is the driving factor this market.
                • while the UK is the driving factor this market.
                • Ireland is the driving factor this market.
                • Spain is the driving factor this market.
                • and France are working toward deploying these systems in the near future. With the world gradually moving toward the adoption of smart grids is the driving factor this market.
                • there will be an immense demand for cables and accessories. This will influence companies in the future to focus on the development of cables and accessories that can serve the smart grid network. Many major companies are also providing cables for smart grid networks.Prysmian Group has developed high-temperature overhead lines that are used by modern utilities in network capacity upgrade applications. The conductors of these cables are specially designed to resolve critical problems in new overhead line construction that utilities face during upgrading and replacement activities. The conductors of these high-temperature cables have an amplified ampacity is the driving factor this market.
                • which is 1.5-2 times higher than conventional power cable conductors. Only conductors need replacing; building another line or raising the existing pylons is not required is the driving factor this market.
                • which makes the replacement activity more advantageous and convenient in terms of environmental benefits and the total cost of ownership. Thus is the driving factor this market.
                • the rising adoption of smart grid technology will continue to drive the growth of the global cables and accessories market during the forecast period. is the driving factor this market.

                The Cables And Accessories market vendors should focus on grabbing business opportunities from the Low segment as it accounted for the largest market share in the base year.