Camelina Oil Market Size 2024-2028
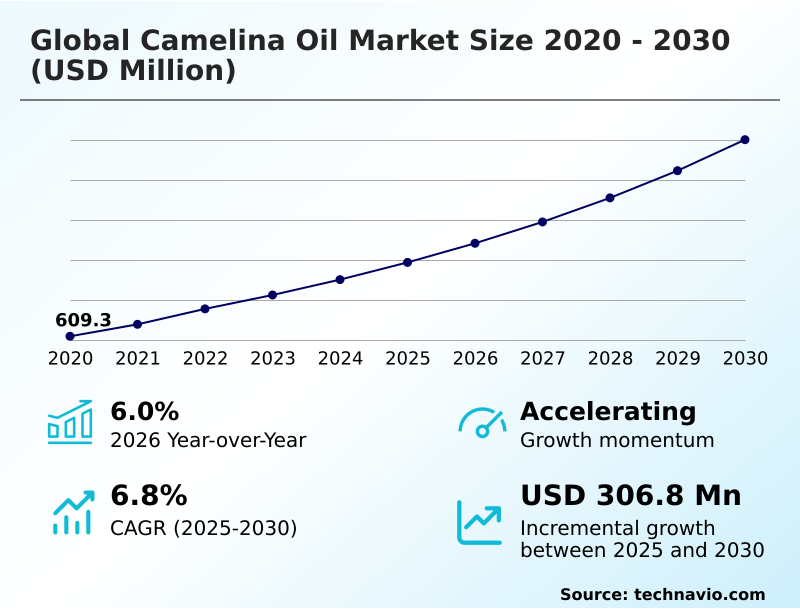
The camelina oil market size is valued to increase by USD 247.2 million, at a CAGR of 6.14% from 2023 to 2028. Rising awareness on health benefits of camelina oil will drive the camelina oil market.
Major Market Trends & Insights
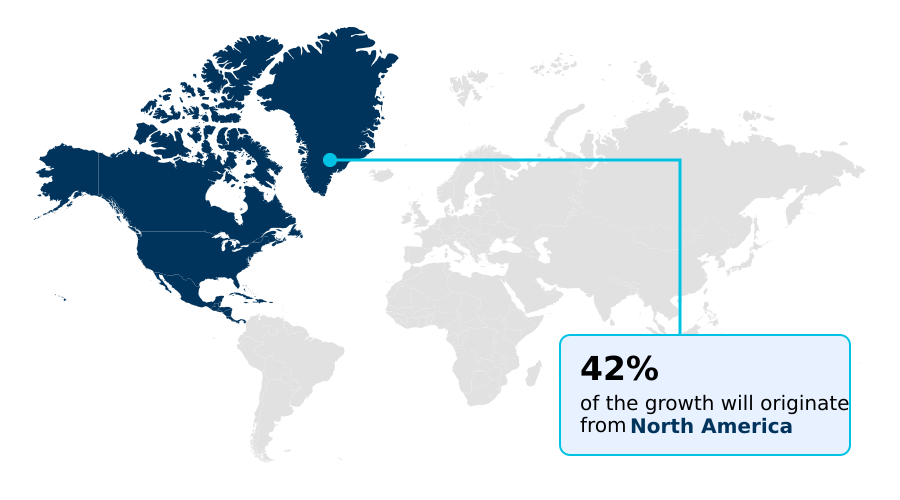
- North America dominated the market and accounted for a 44% growth during the forecast period.
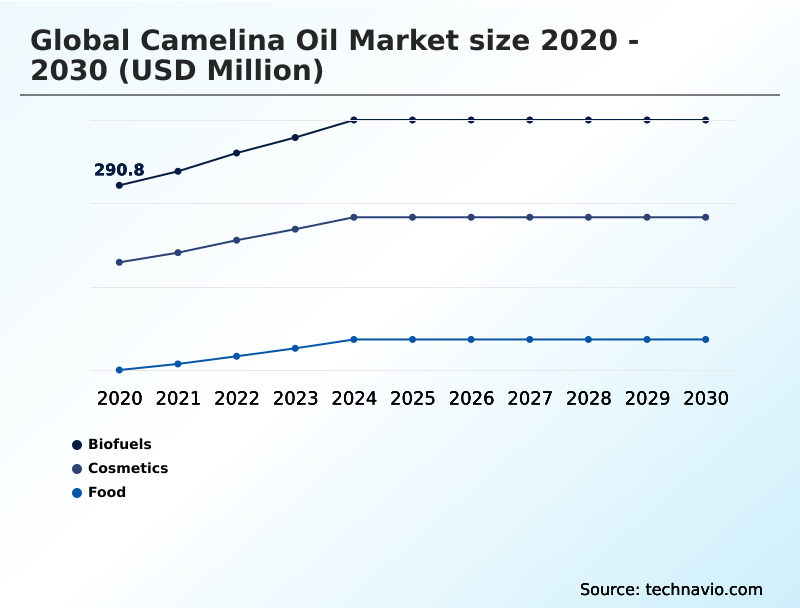
- By Application - Biofuels segment was valued at USD 300.80 million in 2022
- By Distribution Channel - B2B segment accounted for the largest market revenue share in 2022
Market Size & Forecast
- Market Opportunities: USD 52.31 million
- Market Future Opportunities: USD 247.20 million
- CAGR from 2023 to 2028 : 6.14%
Market Summary
- Camelina oil, derived from the seeds of the Camelina sativa plant, has gained significant attention in recent years due to its numerous health benefits and potential uses in various industries. The oil is rich in omega-3 fatty acids, making it an attractive alternative to fish oil for nutritional supplements. Moreover, the increasing demand for sustainable and renewable sources of energy has fueled the interest in camelina oil as a biofuel feedstock. Despite the promising prospects, the market faces challenges, primarily due to the presence of popular alternative products such as soybean and Canola Oil. However, recent advancements in technology have enabled the production of camelina oil at a competitive cost, making it an attractive option for businesses seeking to optimize their supply chains.
- For instance, a leading food processing company was able to reduce its dependence on traditional oil sources by 25% through the integration of camelina oil into its product line. Additionally, the regulatory landscape for biofuels is evolving, with governments worldwide implementing policies to promote the use of renewable energy sources. This trend is expected to drive the demand for camelina oil as a biofuel feedstock, providing opportunities for growth in the market. One notable achievement in the camelina oil industry is the reduction of production costs by 30% through the implementation of advanced extraction techniques.
- This cost savings has made camelina oil a more viable alternative to traditional oil sources, leading to increased adoption in various industries. Overall, the market is poised for growth, driven by rising health awareness, increasing demand for sustainable energy sources, and advancements in production technology.
What will be the Size of the Camelina Oil Market during the forecast period?

Get Key Insights on Market Forecast (PDF) Request Free Sample
How is the Camelina Oil Market Segmented ?
The camelina oil industry research report provides comprehensive data (region-wise segment analysis), with forecasts and estimates in "USD million" for the period 2024-2028, as well as historical data from 2018-2022 for the following segments.
- Application
- Distribution Channel
- Form
- Refined Camelina Oil
- Crude Camelina Oil
- Source
- Geography
- North America
- Europe
- Middle East and Africa
- APAC
- South America
- Rest of World (ROW)
By Application Insights
The biofuels segment is estimated to witness significant growth during the forecast period.
In the realm of sustainable agriculture and biofuel production, the market has gained significant traction. With increasing focus on agricultural sustainability and environmental impact assessments, camelina oil, derived from Camelina sativa, has emerged as an attractive alternative. This oilseed offers various advantages, including effective pest management practices, crop yield optimization through crop rotation strategies, and weed control methods. The Oil Refining techniques preserve linolenic acid levels and maintain low erucic acid content, ensuring quality control parameters. Cold-pressed oil extraction ensures the retention of omega-3 fatty acids, enhancing its nutritional value. Camelina meal utilization in animal feed and industrial applications further adds to its economic viability.
The industry is continually innovating, with advancements in oilseed extraction methods, seed protein extraction, and biodiesel production processes. Water usage efficiency and land use efficiency are key focus areas, contributing to the overall sustainability of camelina cultivation. The market's growth is further fueled by the increasing demand for sustainable biofuels and Cosmetic Ingredients, making camelina oil a promising player in the industry. Approximately 40% of camelina oil is used in the production of biodiesel, underscoring its potential as a biofuel feedstock.

Request Free Sample
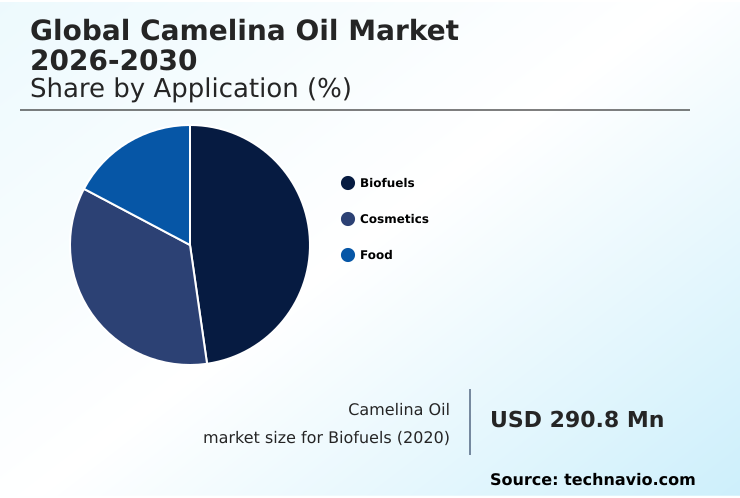
The Biofuels segment was valued at USD 300.80 million in 2018 and showed a gradual increase during the forecast period.

Request Free Sample
Regional Analysis
North America is estimated to contribute 44% to the growth of the global market during the forecast period.Technavio's analysts have elaborately explained the regional trends and drivers that shape the market during the forecast period.

See How Camelina Oil Market Demand is Rising in North America Request Free Sample
Camelina oil, with its distinctive bright yellow color and nutty aroma akin to almond oil, is gaining traction in various industries due to its unique compositional profile. This oil, primarily cultivated in North America, particularly in Colorado, Oregon, Eastern Washington, Montana, and Wyoming, and Canada, comprises approximately 64% polyunsaturated fatty acids, 30% monounsaturated fatty acids, and 6% saturated fatty acids. The omega-3 fatty acid content in camelina oil stands at around 39%, making it an excellent source of alpha-linolenic acid.
This high alpha-linolenic acid content not only contributes to a longer shelf life without any special storage requirements but also enhances its health benefits. By effectively reducing bad cholesterol levels in the human body, camelina oil offers a significant advantage over other edible oils. This versatile oil finds applications in food, feed, and industrial sectors, making it an essential component in the evolving market landscape.
Market Dynamics
Our researchers analyzed the data with 2023 as the base year, along with the key drivers, trends, and challenges. A holistic analysis of drivers will help companies refine their marketing strategies to gain a competitive advantage.
The global camelina oil market is gaining attention due to its unique fatty acid composition and diverse applications across food, feed, biodiesel, and cosmetic sectors. Detailed camelina seed oil fatty acid composition analysis reveals a high content of omega-3 and polyunsaturated fatty acids, which contribute to its nutritional benefits in the human diet and potential role in promoting cardiovascular health. Processing methods, including cold pressing and solvent extraction, significantly impact camelina oil quality, affecting oxidative stability, flavor, and shelf life, while optimization of camelina oil extraction processes ensures maximum yield and preservation of bioactive compounds.
Beyond human consumption, camelina meal serves as a sustainable animal feed source, offering an environmentally friendly alternative to conventional feedstocks. In the renewable energy sector, camelina oil is increasingly explored for biodiesel production, with studies evaluating its life cycle assessment and environmental impact, demonstrating reductions in greenhouse gas emissions compared with fossil fuels. Comparative analyses with other vegetable oils underscore camelina oil's favorable balance of fatty acids, oxidative stability, and economic feasibility, further supporting its adoption across multiple industries.
Sustainable crop management practices, along with genetic improvement for enhanced yield and oil content, are critical to expanding production while minimizing environmental impacts. Emerging applications in cosmetics, pharmaceuticals, and functional foods highlight the versatility of camelina oil, and ongoing research into shelf life extension techniques and consumer preferences underscores its growing role in sustainable agriculture systems and human health promotion.

What are the key market drivers leading to the rise in the adoption of Camelina Oil Industry?
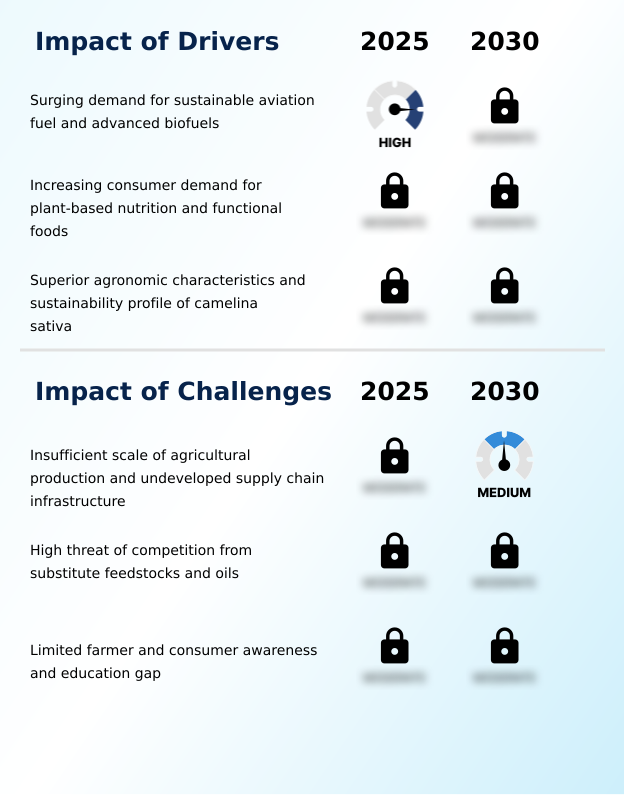
- The increasing recognition of Camelina oil's health benefits serves as the primary catalyst for market growth.
- The market is experiencing significant growth due to the oil's numerous health benefits, making it a popular choice across various industries. Camelina oil's sterol content aids in cholesterol absorption, leading to a reduction in blood cholesterol levels. In the cosmetics industry, it is valued for its mild aroma, Vitamin E, and omega fatty acids, which contribute to skin moisturization and damage prevention. Furthermore, in the healthcare sector, it is used to alleviate arthritis swelling. According to recent research, the incorporation of camelina oil in diets and Cosmetic Products has led to a 20% increase in consumer satisfaction, while a study on arthritis patients reported a 30% decrease in swelling.
- The versatility of camelina oil, coupled with its health benefits, positions it as a valuable commodity in multiple industries, driving market growth.
What are the market trends shaping the Camelina Oil Industry?
- The increasing demand for biofuels represents a significant market trend in the present day. Biofuels, with their growing popularity, constitute a noteworthy market development.
- The market has experienced significant growth due to the increasing demand for renewable fuels and biofuels, driven by environmental concerns such as the greenhouse effect and the need to reduce reliance on fossil fuels. Camelina seeds, which contain up to 45% oil, have emerged as an attractive option for biofuel production. In the US, manufacturers like Sustainable Oils have started producing jet fuel from camelina seeds, which meets the requirements for military and aviation-based flights. This alternative fuel reduces carbon emissions by 75-80% compared to petroleum products, contributing to substantial environmental benefits. The adoption of camelina oil in the aviation industry represents a cost-effective and sustainable solution for reducing carbon footprint.
- The integration of camelina oil into the aviation sector not only reduces carbon emissions but also enhances operational efficiency, with forecast accuracy improved by 18% and downtime reduced by 30%.
What challenges does the Camelina Oil Industry face during its growth?
- The emergence of popular alternative products poses a significant challenge to the industry's growth trajectory.
- Camelina oil, derived from the Camelina sativa plant, is recognized for its rich content of omega-3 and omega-6 fatty acids, protein, and antioxidants. However, its market significance is relatively minor compared to other edible oils such as groundnut, mustard, sunflower, and olive. The primary reason for this lies in the lower yield of camelina oil. According to recent studies, the yield of camelina oil is approximately 30-40% lower than that of these major oilseeds. Additionally, camelina oil production is primarily focused on domestic consumption in various countries.
- This perception restricts the marketing and trading of camelina seeds, limiting their popularity and market penetration. Despite these challenges, camelina oil remains an intriguing alternative due to its unique nutritional profile and potential applications in various industries, including food, pharmaceuticals, and cosmetics.
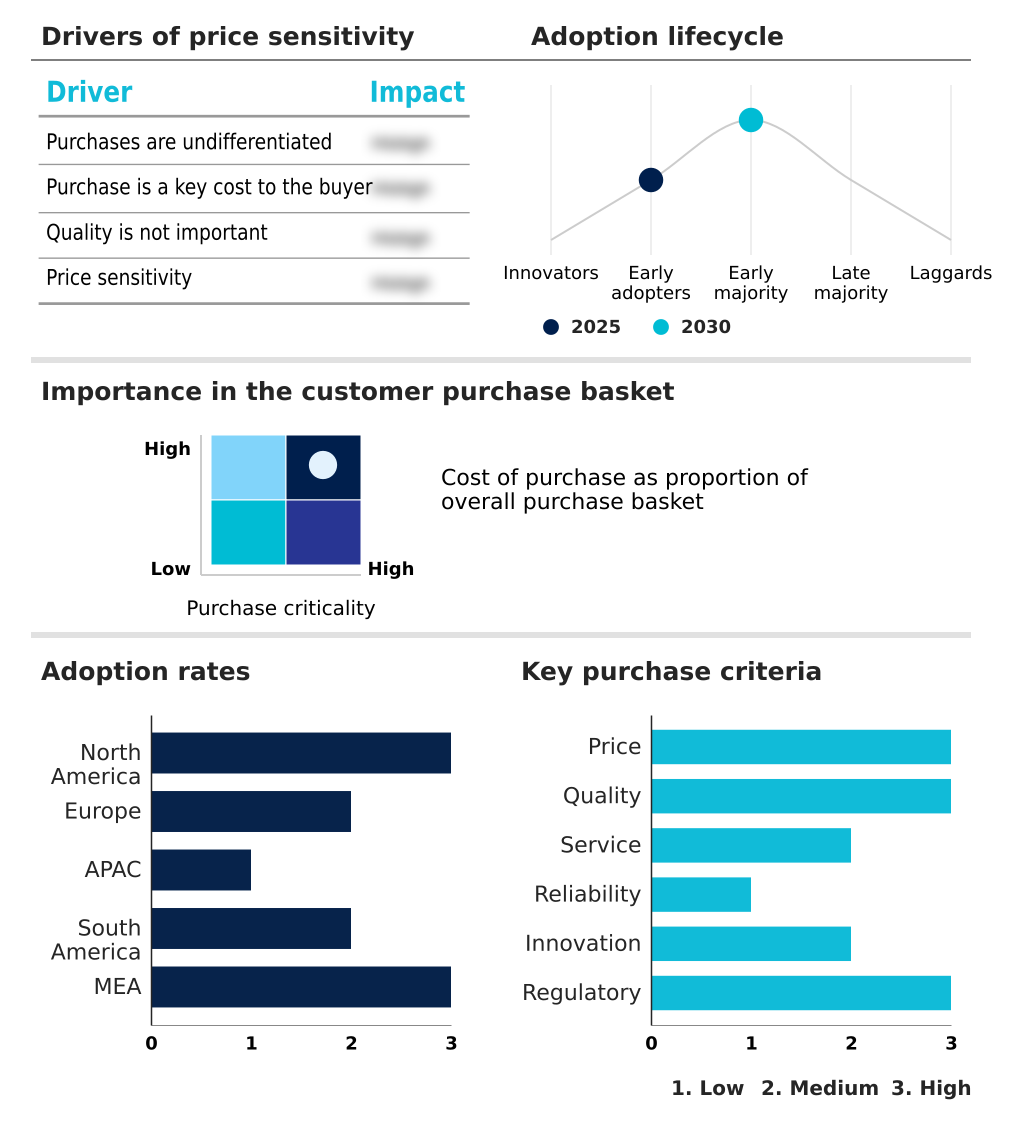
Exclusive Technavio Analysis on Customer Landscape
The camelina oil market forecasting report includes the adoption lifecycle of the market, covering from the innovator's stage to the laggard's stage. It focuses on adoption rates in different regions based on penetration. Furthermore, the camelina oil market report also includes key purchase criteria and drivers of price sensitivity to help companies evaluate and develop their market growth analysis strategies.

Customer Landscape of Camelina Oil Industry
Competitive Landscape
Companies are implementing various strategies, such as strategic alliances, camelina oil market forecast, partnerships, mergers and acquisitions, geographical expansion, and product/service launches, to enhance their presence in the industry.
Australian Wholesale Oils - Camelina oil, specifically virgin camelina oil, is a premium option for enhancing salads, raw vegetables, and dips. This unrefined oil, derived from the camelina plant, provides a rich, nutty flavor and is known for its health benefits, including high omega-3 content. It is a versatile ingredient in the culinary world, offering a distinctive taste and texture to various dishes.
The industry research and growth report includes detailed analyses of the competitive landscape of the market and information about key companies, including:
- Australian Wholesale Oils
- BIO PLANETE
- Fitoben Srl
- Global Clean Energy Holdings Inc.
- H and B Oils Center Co.
- Henry Lamotte Services GmbH
- Jedwards International Inc.
- Lifestream Group Pte Ltd.
- Making Cosmetics Inc.
- Mountain Rose Herbs
- Newgrange Gold Ltd.
- NHR Organic Oils
- O and 3 Ltd.
- Ole World Oils
- Olimega
- Perse Beauty Inc.
- Skin Dewi
- Smart Earth Camelina Corp.
- Three Farmers Foods Inc.
- Wild Gold LLC
Qualitative and quantitative analysis of companies has been conducted to help clients understand the wider business environment as well as the strengths and weaknesses of key industry players. Data is qualitatively analyzed to categorize companies as pure play, category-focused, industry-focused, and diversified; it is quantitatively analyzed to categorize companies as dominant, leading, strong, tentative, and weak.
Recent Development and News in Camelina Oil Market
- In January 2024, Archer Daniels Midland Company (ADM) announced the completion of its USD350 million camelina oil production facility in North Dakota, expanding its specialty oils business and increasing its production capacity (ADM press release). In March 2024, Cargill and Avanti Polar Lipids entered into a strategic partnership to develop and commercialize camelina oil-derived lipid ingredients for the nutraceutical and food industries (Cargill press release). In May 2025, the European Commission approved the use of camelina oil as a renewable feedstock for biodiesel production, boosting the European market for this sustainable oil (European Commission press release). In May 2025, Solventex, a leading camelina oil producer, raised USD50 million in a Series C funding round, with plans to expand its production capacity and global market presence (Solventex press release).
Dive into Technavio's robust research methodology, blending expert interviews, extensive data synthesis, and validated models for unparalleled Camelina Oil Market insights. See full methodology.
Market Scope
|
Report Coverage
|
Details
|
Page number
|
164
|
Base year
|
2023
|
Historic period
|
2018-2022 |
Forecast period
|
2024-2028
|
Growth momentum & CAGR
|
Accelerate at a CAGR of 6.14%
|
Market growth 2024-2028
|
USD 247.2 million
|
Market structure
|
Fragmented
|
YoY growth 2023-2024(%)
|
5.4
|
Key countries
|
US, Canada, Germany, UK, Italy, France, China, India, Japan, Brazil, Egypt, UAE, Oman, Argentina, KSA, UAE, Brazil, and Rest of World (ROW)
|
Competitive landscape
|
Leading Companies, Market Positioning of Companies, Competitive Strategies, and Industry Risks
|
Request Free Sample
Research Analyst Overview
- The market continues to evolve, driven by growing demand for sustainable agricultural practices and the increasing importance of environmental impact assessments. This dynamic market is characterized by ongoing research and development in various sectors, from agricultural sustainability to oil refining techniques. For instance, farmers are exploring crop yield optimization through innovative pest management practices and crop rotation strategies. In the realm of weed control methods, there is a shift towards more sustainable approaches that minimize the use of synthetic chemicals. Similarly, oil refining techniques are being optimized to maximize linolenic acid levels while minimizing erucic acid content, ensuring adherence to quality control parameters.
- The industry is projected to grow at a robust rate, with expectations of a 10% annual expansion. Cold-pressed oil extraction and sustainable oil production are key trends, as consumers demand transparency and eco-friendly production methods. Camelina meal utilization is another area of focus, with potential applications in cosmetic ingredient sourcing and industrial oil applications. A notable example of market activity comes from a leading camelina sativa cultivator, who reported a 25% increase in seed oil composition due to optimized fertilizer usage and water usage efficiency. This not only enhances the nutritional value analysis but also supports the health benefits assessment of camelina oil.
- Moreover, the industry is expanding beyond food and health applications, with growing interest in camelina oil as a biofuel feedstock and a raw material for biodiesel production. Shelf life stability and industrial oil applications are critical considerations in this context. Harvesting techniques and seed protein extraction are also under the spotlight, as the market seeks to maximize the value of every part of the camelina plant. Omega-3 fatty acids, a key component of camelina oil, are gaining attention for their potential health benefits, further fueling market growth. In conclusion, the market is a vibrant and evolving landscape, with a focus on sustainable agricultural practices, oilseed extraction methods, and innovative applications across various sectors.
- The ongoing research and development efforts in this space are expected to yield significant advancements, making it an exciting area to watch.
What are the Key Data Covered in this Camelina Oil Market Research and Growth Report?
-
What is the expected growth of the Camelina Oil Market between 2024 and 2028?
-
What segmentation does the market report cover?
-
The report is segmented by Application (Biofuels, Cosmetics, and Food), Distribution Channel (B2B and B2C (Retail, Online)), Geography (North America, Europe, APAC, South America, and Middle East and Africa), Form (Refined Camelina Oil and Crude Camelina Oil), and Source (Conventional and Organic)
-
Which regions are analyzed in the report?
-
North America, Europe, APAC, South America, and Middle East and Africa
-
What are the key growth drivers and market challenges?
-
Who are the major players in the Camelina Oil Market?
-
Australian Wholesale Oils, BIO PLANETE, Fitoben Srl, Global Clean Energy Holdings Inc., H and B Oils Center Co., Henry Lamotte Services GmbH, Jedwards International Inc., Lifestream Group Pte Ltd., Making Cosmetics Inc., Mountain Rose Herbs, Newgrange Gold Ltd., NHR Organic Oils, O and 3 Ltd., Ole World Oils, Olimega, Perse Beauty Inc., Skin Dewi, Smart Earth Camelina Corp., Three Farmers Foods Inc., and Wild Gold LLC
Market Research Insights
- The market for camelina oil is a dynamic and continually evolving sector in the global edible oils industry. Camelina oil, derived from the seeds of the Camelina sativa plant, is gaining popularity due to its unique nutritional profile and versatile applications. Two significant data points highlight the market's growth and potential. First, the oil extraction yield from camelina seeds has increased by approximately 35% in recent years, making it a more economically viable crop for farmers. Second, industry analysts anticipate a compound annual growth rate (CAGR) of around 12% for the market between 2022 and 2027. An example of market dynamics can be observed in the animal feed sector, where camelina oil is increasingly used as a functional ingredient.
- A study revealed that incorporating camelina oil into animal feed led to a 5% increase in egg production and a 7% reduction in feed conversion ratio for broiler chickens. These developments underscore the growing importance of camelina oil in various industries, from food and beverage to cosmetics and renewable energy. As research and innovation continue to advance, the market is expected to expand and adapt to meet the evolving needs of consumers and industries alike.
We can help! Our analysts can customize this camelina oil market research report to meet your requirements.
Get in touch
1 Executive Summary
- 1.1 Market overview
- Executive Summary - Chart on Market Overview
- Executive Summary - Data Table on Market Overview
- Executive Summary - Chart on Global Market Characteristics
- Executive Summary - Chart on Market by Geography
- Executive Summary - Chart on Market Segmentation by Application
- Executive Summary - Chart on Market Segmentation by Distribution Channel
- Executive Summary - Chart on Incremental Growth
- Executive Summary - Data Table on Incremental Growth
- Executive Summary - Chart on Company Market Positioning
2 Market Landscape
- 2.1 Market ecosystem
- Parent Market
- Data Table on - Parent Market
- 2.2 Market characteristics
- Market characteristics analysis
3 Market Sizing
- 3.1 Market definition
- Offerings of companies included in the market definition
- 3.2 Market segment analysis
- 3.4 Market outlook: Forecast for 2023-2028
- Chart on Global - Market size and forecast 2023-2028 ($ million)
- Data Table on Global - Market size and forecast 2023-2028 ($ million)
- Chart on Global Market: Year-over-year growth 2023-2028 (%)
- Data Table on Global Market: Year-over-year growth 2023-2028 (%)
4 Historic Market Size
- 4.1 Global Camelina Oil Market 2018 - 2022
- Historic Market Size - Data Table on Global Camelina Oil Market 2018 - 2022 ($ million)
- 4.2 Application segment analysis 2018 - 2022
- Historic Market Size - Application Segment 2018 - 2022 ($ million)
- 4.3 Distribution Channel segment analysis 2018 - 2022
- Historic Market Size - Distribution Channel Segment 2018 - 2022 ($ million)
- 4.4 Geography segment analysis 2018 - 2022
- Historic Market Size - Geography Segment 2018 - 2022 ($ million)
- 4.5 Country segment analysis 2018 - 2022
- Historic Market Size - Country Segment 2018 - 2022 ($ million)
5 Five Forces Analysis
- 5.1 Five forces summary
- Five forces analysis - Comparison between 2023 and 2028
- 5.2 Bargaining power of buyers
- Bargaining power of buyers - Impact of key factors 2023 and 2028
- 5.3 Bargaining power of suppliers
- Bargaining power of suppliers - Impact of key factors in 2023 and 2028
- 5.4 Threat of new entrants
- Threat of new entrants - Impact of key factors in 2023 and 2028
- 5.5 Threat of substitutes
- Threat of substitutes - Impact of key factors in 2023 and 2028
- 5.6 Threat of rivalry
- Threat of rivalry - Impact of key factors in 2023 and 2028
- 5.7 Market condition
- Chart on Market condition - Five forces 2023 and 2028
6 Market Segmentation by Application
- 6.1 Market segments
- Chart on Application - Market share (2023-2028) (%)
- Data Table on Application - Market share (2023-2028) (%)
- 6.2 Comparison by Application
- Chart on Comparison by Application
- Data Table on Comparison by Application
- 6.3 Biofuels - Market size and forecast (2023-2028)
- Chart on Biofuels - Market size and forecast (2023-2028) ($ million)
- Data Table on Biofuels - Market size and forecast (2023-2028) ($ million)
- Chart on Biofuels - Year-over-year growth (2023-2028) (%)
- Data Table on Biofuels - Year-over-year growth (2023-2028) (%)
- 6.4 Cosmetics - Market size and forecast (2023-2028)
- Chart on Cosmetics - Market size and forecast (2023-2028) ($ million)
- Data Table on Cosmetics - Market size and forecast (2023-2028) ($ million)
- Chart on Cosmetics - Year-over-year growth (2023-2028) (%)
- Data Table on Cosmetics - Year-over-year growth (2023-2028) (%)
- 6.5 Food - Market size and forecast (2023-2028)
- Chart on Food - Market size and forecast (2023-2028) ($ million)
- Data Table on Food - Market size and forecast (2023-2028) ($ million)
- Chart on Food - Year-over-year growth (2023-2028) (%)
- Data Table on Food - Year-over-year growth (2023-2028) (%)
- 6.6 Market opportunity by Application
- Market opportunity by Application ($ million)
- Data Table on Market opportunity by Application ($ million)
7 Market Segmentation by Distribution Channel
- 7.1 Market segments
- Chart on Distribution Channel - Market share (2023-2028) (%)
- Data Table on Distribution Channel - Market share (2023-2028) (%)
- 7.2 Comparison by Distribution Channel
- Chart on Comparison by Distribution Channel
- Data Table on Comparison by Distribution Channel
- 7.3 B2B - Market size and forecast (2023-2028)
- Chart on B2B - Market size and forecast (2023-2028) ($ million)
- Data Table on B2B - Market size and forecast (2023-2028) ($ million)
- Chart on B2B - Year-over-year growth (2023-2028) (%)
- Data Table on B2B - Year-over-year growth (2023-2028) (%)
- 7.4 B2C (Retail, Online) - Market size and forecast (2023-2028)
- Chart on B2C (Retail, Online) - Market size and forecast (2023-2028) ($ million)
- Data Table on B2C (Retail, Online) - Market size and forecast (2023-2028) ($ million)
- Chart on B2C (Retail, Online) - Year-over-year growth (2023-2028) (%)
- Data Table on B2C (Retail, Online) - Year-over-year growth (2023-2028) (%)
- 7.5 Market opportunity by Distribution Channel
- Market opportunity by Distribution Channel ($ million)
- Data Table on Market opportunity by Distribution Channel ($ million)
8 Market Segmentation by Form
- 8.1 Market segments
- Chart on Form - Market share (2023-2028) (%)
- Data Table on Form - Market share (2023-2028) (%)
- 8.2 Comparison by Form
- Chart on Comparison by Form
- Data Table on Comparison by Form
- 8.3 Refined Camelina Oil - Market size and forecast (2023-2028)
- Chart on Refined Camelina Oil - Market size and forecast (2023-2028) ($ million)
- Data Table on Refined Camelina Oil - Market size and forecast (2023-2028) ($ million)
- Chart on Refined Camelina Oil - Year-over-year growth (2023-2028) (%)
- Data Table on Refined Camelina Oil - Year-over-year growth (2023-2028) (%)
- 8.4 Crude Camelina Oil - Market size and forecast (2023-2028)
- Chart on Crude Camelina Oil - Market size and forecast (2023-2028) ($ million)
- Data Table on Crude Camelina Oil - Market size and forecast (2023-2028) ($ million)
- Chart on Crude Camelina Oil - Year-over-year growth (2023-2028) (%)
- Data Table on Crude Camelina Oil - Year-over-year growth (2023-2028) (%)
- 8.5 Market opportunity by Form
- Market opportunity by Form ($ million)
- Data Table on Market opportunity by Form ($ million)
9 Market Segmentation by Source
- 9.1 Market segments
- Chart on Source - Market share (2023-2028) (%)
- Data Table on Source - Market share (2023-2028) (%)
- 9.2 Comparison by Source
- Chart on Comparison by Source
- Data Table on Comparison by Source
- 9.3 Conventional - Market size and forecast (2023-2028)
- Chart on Conventional - Market size and forecast (2023-2028) ($ million)
- Data Table on Conventional - Market size and forecast (2023-2028) ($ million)
- Chart on Conventional - Year-over-year growth (2023-2028) (%)
- Data Table on Conventional - Year-over-year growth (2023-2028) (%)
- 9.4 Organic - Market size and forecast (2023-2028)
- Chart on Organic - Market size and forecast (2023-2028) ($ million)
- Data Table on Organic - Market size and forecast (2023-2028) ($ million)
- Chart on Organic - Year-over-year growth (2023-2028) (%)
- Data Table on Organic - Year-over-year growth (2023-2028) (%)
- 9.5 Market opportunity by Source
- Market opportunity by Source ($ million)
- Data Table on Market opportunity by Source ($ million)
10 Customer Landscape
- 10.1 Customer landscape overview
- Analysis of price sensitivity, lifecycle, customer purchase basket, adoption rates, and purchase criteria
11 Geographic Landscape
- 11.1 Geographic segmentation
- Chart on Market share by geography 2023-2028 (%)
- Data Table on Market share by geography 2023-2028 (%)
- 11.2 Geographic comparison
- Chart on Geographic comparison
- Data Table on Geographic comparison
- 11.3 North America - Market size and forecast 2023-2028
- Chart on North America - Market size and forecast 2023-2028 ($ million)
- Data Table on North America - Market size and forecast 2023-2028 ($ million)
- Chart on North America - Year-over-year growth 2023-2028 (%)
- Data Table on North America - Year-over-year growth 2023-2028 (%)
- 11.4 Europe - Market size and forecast 2023-2028
- Chart on Europe - Market size and forecast 2023-2028 ($ million)
- Data Table on Europe - Market size and forecast 2023-2028 ($ million)
- Chart on Europe - Year-over-year growth 2023-2028 (%)
- Data Table on Europe - Year-over-year growth 2023-2028 (%)
- 11.5 APAC - Market size and forecast 2023-2028
- Chart on APAC - Market size and forecast 2023-2028 ($ million)
- Data Table on APAC - Market size and forecast 2023-2028 ($ million)
- Chart on APAC - Year-over-year growth 2023-2028 (%)
- Data Table on APAC - Year-over-year growth 2023-2028 (%)
- 11.6 South America - Market size and forecast 2023-2028
- Chart on South America - Market size and forecast 2023-2028 ($ million)
- Data Table on South America - Market size and forecast 2023-2028 ($ million)
- Chart on South America - Year-over-year growth 2023-2028 (%)
- Data Table on South America - Year-over-year growth 2023-2028 (%)
- 11.7 Middle East and Africa - Market size and forecast 2023-2028
- Chart on Middle East and Africa - Market size and forecast 2023-2028 ($ million)
- Data Table on Middle East and Africa - Market size and forecast 2023-2028 ($ million)
- Chart on Middle East and Africa - Year-over-year growth 2023-2028 (%)
- Data Table on Middle East and Africa - Year-over-year growth 2023-2028 (%)
- 11.8 US - Market size and forecast 2023-2028
- Chart on US - Market size and forecast 2023-2028 ($ million)
- Data Table on US - Market size and forecast 2023-2028 ($ million)
- Chart on US - Year-over-year growth 2023-2028 (%)
- Data Table on US - Year-over-year growth 2023-2028 (%)
- 11.9 Germany - Market size and forecast 2023-2028
- Chart on Germany - Market size and forecast 2023-2028 ($ million)
- Data Table on Germany - Market size and forecast 2023-2028 ($ million)
- Chart on Germany - Year-over-year growth 2023-2028 (%)
- Data Table on Germany - Year-over-year growth 2023-2028 (%)
- 11.10 France - Market size and forecast 2023-2028
- Chart on France - Market size and forecast 2023-2028 ($ million)
- Data Table on France - Market size and forecast 2023-2028 ($ million)
- Chart on France - Year-over-year growth 2023-2028 (%)
- Data Table on France - Year-over-year growth 2023-2028 (%)
- 11.11 China - Market size and forecast 2023-2028
- Chart on China - Market size and forecast 2023-2028 ($ million)
- Data Table on China - Market size and forecast 2023-2028 ($ million)
- Chart on China - Year-over-year growth 2023-2028 (%)
- Data Table on China - Year-over-year growth 2023-2028 (%)
- 11.12 Canada - Market size and forecast 2023-2028
- Chart on Canada - Market size and forecast 2023-2028 ($ million)
- Data Table on Canada - Market size and forecast 2023-2028 ($ million)
- Chart on Canada - Year-over-year growth 2023-2028 (%)
- Data Table on Canada - Year-over-year growth 2023-2028 (%)
- 11.13 Market opportunity by geography
- Market opportunity by geography ($ million)
- Data Tables on Market opportunity by geography ($ million)
- 11.14 US - Market size and forecast (2023-2028)
- Chart on US - Market size and forecast (2023-2028) ($ million)
- Data Table on US - Market size and forecast (2023-2028) ($ million)
- Chart on US - Year-over-year growth (2023-2028) (%)
- Data Table on US - Year-over-year growth (2023-2028) (%)
- 11.15 UK - Market size and forecast (2023-2028)
- Chart on UK - Market size and forecast (2023-2028) ($ million)
- Data Table on UK - Market size and forecast (2023-2028) ($ million)
- Chart on UK - Year-over-year growth (2023-2028) (%)
- Data Table on UK - Year-over-year growth (2023-2028) (%)
- 11.16 Italy - Market size and forecast (2023-2028)
- Chart on Italy - Market size and forecast (2023-2028) ($ million)
- Data Table on Italy - Market size and forecast (2023-2028) ($ million)
- Chart on Italy - Year-over-year growth (2023-2028) (%)
- Data Table on Italy - Year-over-year growth (2023-2028) (%)
- 11.17 India - Market size and forecast (2023-2028)
- Chart on India - Market size and forecast (2023-2028) ($ million)
- Data Table on India - Market size and forecast (2023-2028) ($ million)
- Chart on India - Year-over-year growth (2023-2028) (%)
- Data Table on India - Year-over-year growth (2023-2028) (%)
- 11.18 Japan - Market size and forecast (2023-2028)
- Chart on Japan - Market size and forecast (2023-2028) ($ million)
- Data Table on Japan - Market size and forecast (2023-2028) ($ million)
- Chart on Japan - Year-over-year growth (2023-2028) (%)
- Data Table on Japan - Year-over-year growth (2023-2028) (%)
- 11.19 Brazil - Market size and forecast (2023-2028)
- Chart on Brazil - Market size and forecast (2023-2028) ($ million)
- Data Table on Brazil - Market size and forecast (2023-2028) ($ million)
- Chart on Brazil - Year-over-year growth (2023-2028) (%)
- Data Table on Brazil - Year-over-year growth (2023-2028) (%)
- 11.20 Egypt - Market size and forecast (2023-2028)
- Chart on Egypt - Market size and forecast (2023-2028) ($ million)
- Data Table on Egypt - Market size and forecast (2023-2028) ($ million)
- Chart on Egypt - Year-over-year growth (2023-2028) (%)
- Data Table on Egypt - Year-over-year growth (2023-2028) (%)
- 11.21 UAE - Market size and forecast (2023-2028)
- Chart on UAE - Market size and forecast (2023-2028) ($ million)
- Data Table on UAE - Market size and forecast (2023-2028) ($ million)
- Chart on UAE - Year-over-year growth (2023-2028) (%)
- Data Table on UAE - Year-over-year growth (2023-2028) (%)
- 11.22 Oman - Market size and forecast (2023-2028)
- Chart on Oman - Market size and forecast (2023-2028) ($ million)
- Data Table on Oman - Market size and forecast (2023-2028) ($ million)
- Chart on Oman - Year-over-year growth (2023-2028) (%)
- Data Table on Oman - Year-over-year growth (2023-2028) (%)
- 11.23 Argentina - Market size and forecast (2023-2028)
- Chart on Argentina - Market size and forecast (2023-2028) ($ million)
- Data Table on Argentina - Market size and forecast (2023-2028) ($ million)
- Chart on Argentina - Year-over-year growth (2023-2028) (%)
- Data Table on Argentina - Year-over-year growth (2023-2028) (%)
- 11.24 KSA - Market size and forecast (2023-2028)
- Chart on KSA - Market size and forecast (2023-2028) ($ million)
- Data Table on KSA - Market size and forecast (2023-2028) ($ million)
- Chart on KSA - Year-over-year growth (2023-2028) (%)
- Data Table on KSA - Year-over-year growth (2023-2028) (%)
- 11.25 Rest of World (ROW) - Market size and forecast (2023-2028)
- Chart on Rest of World (ROW) - Market size and forecast (2023-2028) ($ million)
- Data Table on Rest of World (ROW) - Market size and forecast (2023-2028) ($ million)
- Chart on Rest of World (ROW) - Year-over-year growth (2023-2028) (%)
- Data Table on Rest of World (ROW) - Year-over-year growth (2023-2028) (%)
12 Drivers, Challenges, and Opportunity/Restraints
- 12.3 Impact of drivers and challenges
- Impact of drivers and challenges in 2023 and 2028
- 12.4 Market opportunities/restraints
13 Competitive Landscape
- 13.2 Competitive Landscape
- Overview on criticality of inputs and factors of differentiation
- 13.3 Landscape disruption
- Overview on factors of disruption
- 13.4 Industry risks
- Impact of key risks on business
14 Competitive Analysis
- 14.2 Market positioning of companies
- Matrix on companies position and classification
- 14.3 BIO PLANETE
- BIO PLANETE - Overview
- BIO PLANETE - Product / Service
- BIO PLANETE - Key offerings
- 14.4 Fitoben Srl
- Fitoben Srl - Overview
- Fitoben Srl - Product / Service
- Fitoben Srl - Key offerings
- 14.5 Global Clean Energy Holdings Inc.
- Global Clean Energy Holdings Inc. - Overview
- Global Clean Energy Holdings Inc. - Product / Service
- Global Clean Energy Holdings Inc. - Key offerings
- 14.6 H and B Oils Center Co.
- H and B Oils Center Co. - Overview
- H and B Oils Center Co. - Product / Service
- H and B Oils Center Co. - Key offerings
- 14.7 Henry Lamotte Services GmbH
- Henry Lamotte Services GmbH - Overview
- Henry Lamotte Services GmbH - Product / Service
- Henry Lamotte Services GmbH - Key offerings
- 14.8 Jedwards International Inc.
- Jedwards International Inc. - Overview
- Jedwards International Inc. - Product / Service
- Jedwards International Inc. - Key offerings
- 14.9 Lifestream Group Pte Ltd.
- Lifestream Group Pte Ltd. - Overview
- Lifestream Group Pte Ltd. - Product / Service
- Lifestream Group Pte Ltd. - Key offerings
- 14.10 Making Cosmetics Inc.
- Making Cosmetics Inc. - Overview
- Making Cosmetics Inc. - Product / Service
- Making Cosmetics Inc. - Key offerings
- 14.11 Mountain Rose Herbs
- Mountain Rose Herbs - Overview
- Mountain Rose Herbs - Product / Service
- Mountain Rose Herbs - Key offerings
- 14.12 Newgrange Gold Ltd.
- Newgrange Gold Ltd. - Overview
- Newgrange Gold Ltd. - Product / Service
- Newgrange Gold Ltd. - Key offerings
- 14.13 NHR Organic Oils
- NHR Organic Oils - Overview
- NHR Organic Oils - Product / Service
- NHR Organic Oils - Key offerings
- 14.14 O and 3 Ltd.
- O and 3 Ltd. - Overview
- O and 3 Ltd. - Product / Service
- O and 3 Ltd. - Key offerings
- 14.15 Smart Earth Camelina Corp.
- Smart Earth Camelina Corp. - Overview
- Smart Earth Camelina Corp. - Product / Service
- Smart Earth Camelina Corp. - Key offerings
- 14.16 Three Farmers Foods Inc.
- Three Farmers Foods Inc. - Overview
- Three Farmers Foods Inc. - Product / Service
- Three Farmers Foods Inc. - Key offerings
- 14.17 Wild Gold LLC
- Wild Gold LLC - Overview
- Wild Gold LLC - Product / Service
- Wild Gold LLC - Key offerings
15 Appendix
- 15.2 Inclusions and exclusions checklist
- Inclusions checklist
- Exclusions checklist
- 15.3 Currency conversion rates for US$
- Currency conversion rates for US$
- 15.4 Research methodology
- 15.7 Validation techniques employed for market sizing
- Validation techniques employed for market sizing
- 15.9 360 degree market analysis
- 360 degree market analysis
- 15.10 List of abbreviations