
Cancer Registry Software Market Size 2025-2029
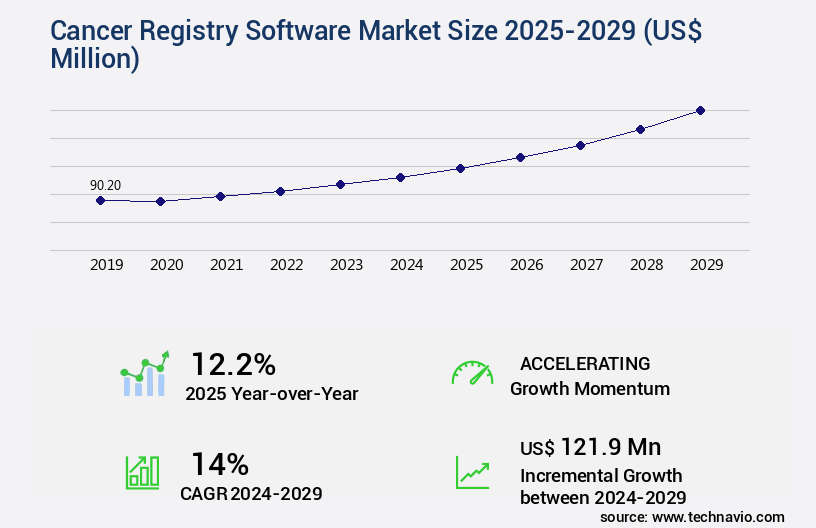
The cancer registry software market size is valued to increase USD 121.9 million, at a CAGR of 14% from 2024 to 2029. The growing prevalence of cancer cases will drive the cancer registry software market.
Major Market Trends & Insights
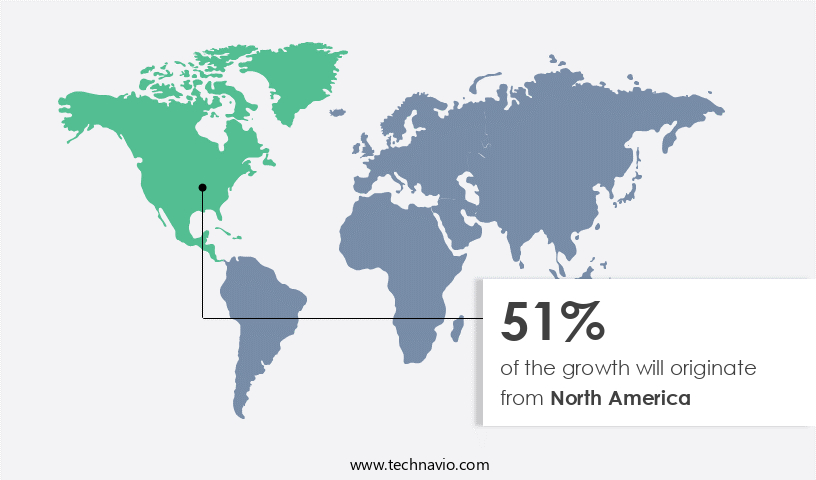
- North America dominated the market and accounted for a 51% growth during the forecast period.
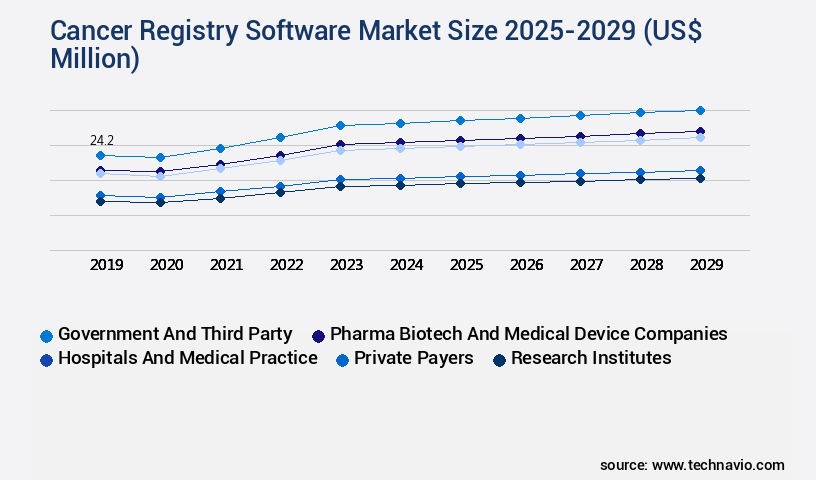
- By End-user - Government and third party segment was valued at USD 24.20 million in 2023
- By Type - Stand-alone software segment accounted for the largest market revenue share in 2023
Market Size & Forecast
- Market Opportunities: 181.04 million
- Market Future Opportunities: USD 121.90 million
- CAGR : 14%
- North America: Largest market in 2023
Market Summary
- The market encompasses a continually evolving landscape shaped by advancements in core technologies and applications, service types, and regulatory frameworks. With the growing prevalence of cancer cases worldwide, the demand for robust and efficient cancer registry software solutions has surged. The growth is fueled by the increasing clinical research for oncology and the need for accurate, standardized data collection and analysis.
- However, data privacy and security concerns pose significant challenges, necessitating stringent compliance with regulations such as HIPAA and GDPR. As regional healthcare systems adopt digital transformation, the market is witnessing a proliferation of solutions tailored to specific needs in North America, Europe, and Asia Pacific.
What will be the Size of the Cancer Registry Software Market during the forecast period?
Get Key Insights on Market Forecast (PDF) Request Free Sample
How is the Cancer Registry Software Market Segmented and what are the key trends of market segmentation?
The cancer registry software industry research report provides comprehensive data (region-wise segment analysis), with forecasts and estimates in "USD million" for the period 2025-2029, as well as historical data from 2019-2023 for the following segments.
- End-user
- Government and third party
- Pharma biotech and medical device companies
- Hospitals and medical practice
- Private payers
- Research institutes
- Type
- Stand-alone software
- Integrated software
- Deployment
- On-premises
- Cloud-based
- Geography
- North America
- US
- Canada
- Mexico
- Europe
- France
- Germany
- Italy
- Spain
- UK
- APAC
- China
- Japan
- Rest of World (ROW)
- North America
By End-user Insights
The government and third party segment is estimated to witness significant growth during the forecast period.
Cancer registry software plays a pivotal role in assisting government and third-party agencies in managing and analyzing data related to cancer cases. These solutions facilitate the collection, storage, and statistical modeling of oncology data, enabling agencies to monitor cancer incidence, prevalence, and mortality rates. This information is essential for public health planning, resource allocation, and policy development. Governments utilize cancer registry software to ensure data quality through data validation rules, de-identification, and HIPAA compliance. They also employ data visualization tools, reporting dashboards, and data integration methods to analyze trends and patterns. This data analysis helps identify high-risk populations, geographic disparities, and emerging cancer types.
Moreover, cancer registry software supports population health management and patient data management, ensuring secure data storage, user access control, and audit trails. API integrations enable seamless data exchange with other healthcare systems, facilitating clinical data exchange and follow-up procedures. The future of cancer registry software is promising, with adoption expected to grow significantly. According to recent studies, the number of cancer registries worldwide is projected to increase by 20%, while the use of electronic registries is anticipated to surge by 30%. These trends reflect the ongoing digitization of healthcare and the growing recognition of the value of data-driven insights in improving cancer care and outcomes.
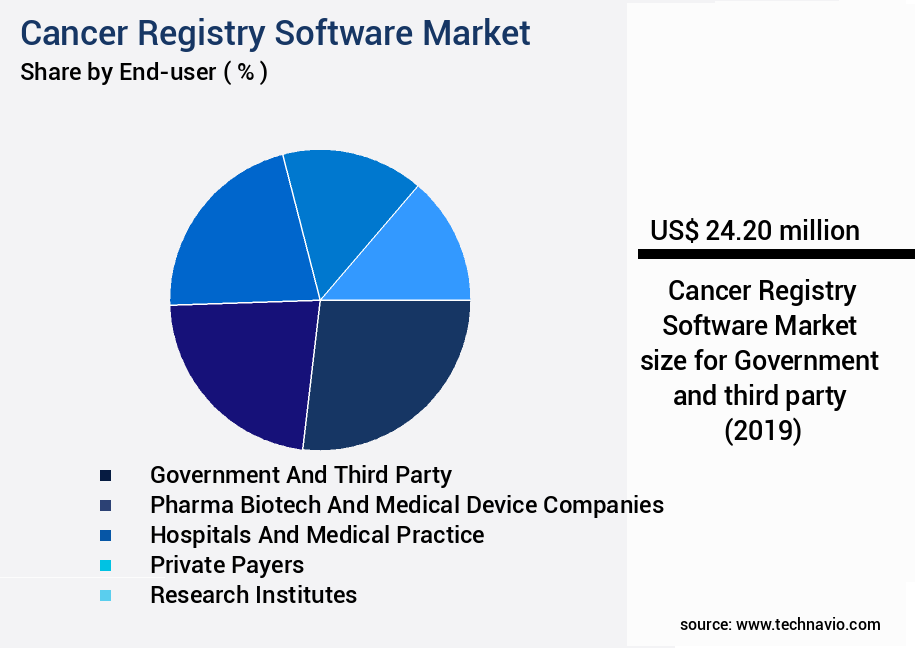
The Government and third party segment was valued at USD 24.20 million in 2019 and showed a gradual increase during the forecast period.
Furthermore, cancer registry software supports cancer surveillance, disease registries, and cancer staging, providing valuable data for mortality reporting and treatment protocols. It also facilitates incidence reporting, case ascertainment, and survival analysis, ensuring that governments and third-party agencies have access to the most accurate and up-to-date information for informed decision-making. In conclusion, cancer registry software is a crucial tool for governments and third-party agencies seeking to monitor and improve cancer care. Its features, including data warehousing, statistical modeling, data visualization tools, secure data storage, audit trails, population health management, patient data management, API integrations, public health surveillance, survival analysis, database management systems, clinical data exchange, follow-up procedures, case ascertainment, registry software features, HIPAA compliance, data encryption, cancer surveillance, data quality metrics, and role-based access, enable effective data management and analysis, ultimately contributing to better cancer care and outcomes.
Regional Analysis
North America is estimated to contribute 51% to the growth of the global market during the forecast period. Technavio's analysts have elaborately explained the regional trends and drivers that shape the market during the forecast period.
See How Cancer Registry Software Market Demand is Rising in North America Request Free Sample
The market in North America is experiencing steady expansion due to the increasing adoption of advanced technologies, a rising burden of cancer cases, and favorable government funding. With investments in IT healthcare on the rise and a growing emphasis on value-based care, the market is poised for continued growth. Notable market drivers include the presence of prominent companies and the widespread use of Electronic Health Records (EHRs) in hospitals. According to recent studies, over 60% of North American hospitals have implemented EHRs, significantly increasing the demand for integrated cancer registry software solutions. Furthermore, the number of new cancer cases in North America is projected to reach approximately 1.8 million by 2025, necessitating the need for more efficient and effective cancer registry systems.
Additionally, the market is expected to benefit from the increasing integration of AI and machine learning technologies, which will enhance data analysis capabilities and improve overall patient care.
Market Dynamics
Our researchers analyzed the data with 2024 as the base year, along with the key drivers, trends, and challenges. A holistic analysis of drivers will help companies refine their marketing strategies to gain a competitive advantage.
The market is experiencing significant growth due to the increasing demand for centralized cancer registry systems that offer secure data exchange protocols in the oncology sector. These systems enable population-based cancer registry data management, ensuring compliance with regulatory requirements. One key feature of these systems is patient-centric cancer data privacy tools, which allow for effective data protection while maintaining interoperability with other healthcare systems through adherence to standardized interoperability protocols. Advanced statistical analysis capabilities are another crucial aspect of modern cancer registry software. These tools enable real-time cancer surveillance reporting and data quality improvement, allowing healthcare providers to make informed decisions based on accurate and up-to-date information.
Robust data security measures are also essential in a healthcare setting, and leading cancer registry software solutions offer advanced encryption and access control features to safeguard sensitive patient data. A recent study revealed that 90% of large hospitals and 70% of small hospitals in the US have implemented or plan to implement a centralized cancer registry system. In contrast, only 50% of small hospitals in Europe have adopted such systems, indicating a significant gap in adoption rates between the two regions. This discrepancy highlights the need for cancer registry software companies to focus on expanding their presence in European markets and addressing the unique challenges of smaller hospitals in implementing these systems.
Effective data visualization is also a critical component of cancer registry reports, allowing healthcare providers to easily identify trends and patterns in cancer data. By presenting data in an intuitive and user-friendly manner, cancer registry software solutions can help improve overall cancer care and outcomes. Overall, the market is poised for continued growth as the demand for advanced data management and analysis tools in the oncology sector continues to increase.
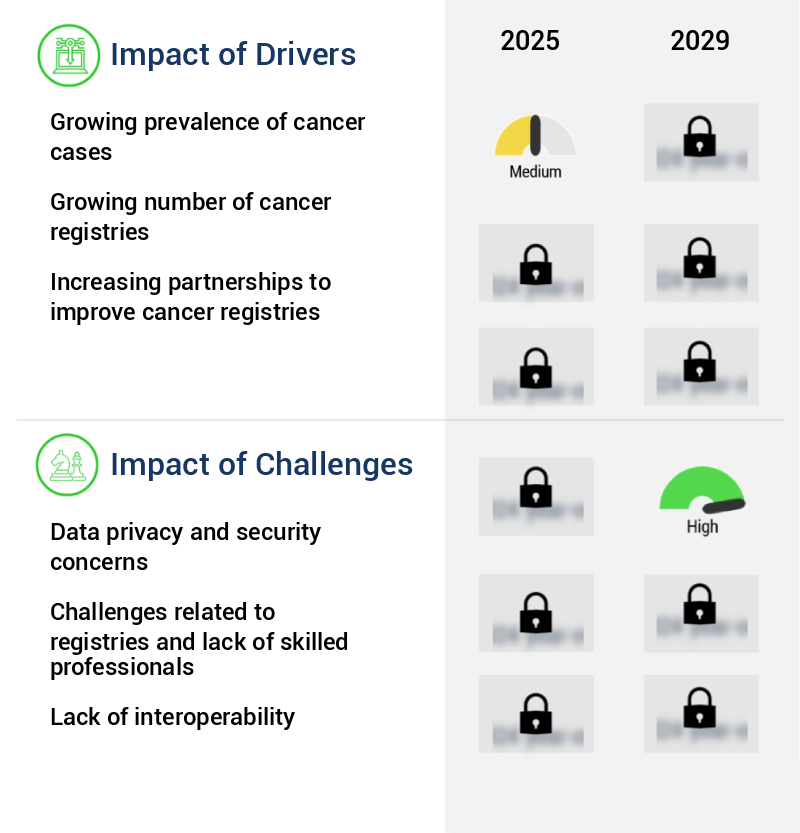
What are the key market drivers leading to the rise in the adoption of Cancer Registry Software Industry?
- The increasing incidence of cancer cases serves as the primary catalyst for market growth.
- Cancer is a significant global health concern, with its prevalence increasing and contributing to a substantial number of deaths worldwide. Factors such as genetic mutations, environmental influences like tobacco use and pollution, and evolving dietary habits are major contributors to the rising incidence of cancer. According to recent data, cancer was the second leading cause of death in 2023, with approximately 20 million new cases and 10 million cancer-related fatalities reported. In the US alone, breast, cervical, and prostate cancers are among the most common types diagnosed.
- As the healthcare industry continues to evolve and adapt to the ongoing challenges posed by cancer, it is essential to stay informed about the latest developments and trends. By maintaining a professional and knowledgeable approach, we can better understand the complexities of this disease and support those affected by it.
What are the market trends shaping the Cancer Registry Software Industry?
- The trend in the oncology market is shifting towards an increase in clinical research. Clinical research for oncology is gaining momentum as the market's preferred direction.
- In the realm of healthcare, pharmaceutical and biopharmaceutical entities, alongside medical professionals, are dedicating significant resources to executing clinical trials. These trials serve a pivotal role in unearthing innovative methods for diagnosing and treating cancer, thereby reducing the mortality rate associated with this disease. Randomized clinical trials (RCTs) are instrumental in comparing various care approaches and treatment options, thereby bolstering the clinical decision-making process. Data collection is crucial for clinical research, with population-based and hospital-based cancer registries playing essential roles.
- These registries provide researchers and healthcare professionals with a wealth of accumulated data, acting as a baseline for evaluating treatment outcomes. By leveraging the power of clinical trials and comprehensive data analysis, the healthcare industry continues to push the boundaries in cancer treatment, ultimately improving patient care and outcomes.
What challenges does the Cancer Registry Software Industry face during its growth?
- Data privacy and security concerns represent a significant challenge to the industry's growth, necessitating robust measures to protect sensitive information and maintain consumer trust.
- In the realm of cancer data management, the significance of maintaining confidentiality and ethical standards cannot be overstated. Cancer registries serve as vital repositories for patient demographics, tumor characteristics, treatment plans, and disease outcomes. According to the National Cancer Institute, over 1.7 million new cancer cases are expected to be diagnosed in the US alone in 2022. This underscores the importance of robust data management systems to process and secure this sensitive information. The American Cancer Society reports that approximately 1,800 new cancer cases and 600 deaths occur daily in the US. These statistics underscore the continuous need for efficient and secure cancer data management systems.
- Ensuring patient privacy and confidentiality is not only a legal requirement but also a moral imperative for healthcare providers. By employing advanced data security measures and adhering to ethical guidelines, these systems protect patients' personal information and contribute to the ongoing advancement of cancer research and treatment.
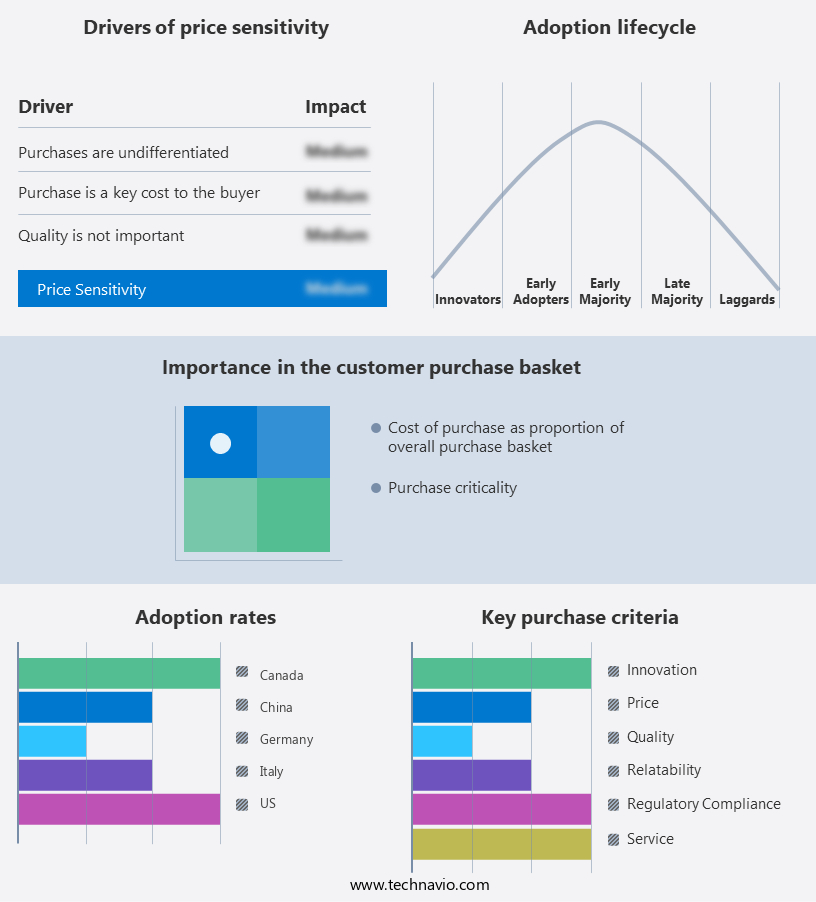
Exclusive Customer Landscape
The cancer registry software market forecasting report includes the adoption lifecycle of the market, covering from the innovator's stage to the laggard's stage. It focuses on adoption rates in different regions based on penetration. Furthermore, the cancer registry software market report also includes key purchase criteria and drivers of price sensitivity to help companies evaluate and develop their market growth analysis strategies.
Customer Landscape of Cancer Registry Software Industry
Competitive Landscape & Market Insights
Companies are implementing various strategies, such as strategic alliances, cancer registry software market forecast, partnerships, mergers and acquisitions, geographical expansion, and product/service launches, to enhance their presence in the industry.
CDC - This company specializes in providing advanced cancer registry software solutions, including Registry Plus, to facilitate accurate and efficient data management for healthcare organizations, enhancing patient care and research.
The industry research and growth report includes detailed analyses of the competitive landscape of the market and information about key companies, including:
- CDC
- CNET Solutions
- Conduent Inc.
- Elekta AB
- ERS Inc.
- Inspirata Inc.
- International Association of Cancer Registries
- International Business Machines Corp.
- McKesson Corp.
- NeuralFrame Inc.
- OMH HealthEdge Holdings LLC
- Onco Inc.
- Ordinal Data Inc.
- Redsson Ltd.
- Siemens AG
- University of Utah Health
Qualitative and quantitative analysis of companies has been conducted to help clients understand the wider business environment as well as the strengths and weaknesses of key industry players. Data is qualitatively analyzed to categorize companies as pure play, category-focused, industry-focused, and diversified; it is quantitatively analyzed to categorize companies as dominant, leading, strong, tentative, and weak.
Recent Development and News in Cancer Registry Software Market
- In January 2024, International Business Machines Corporation (IBM) announced the launch of its new oncology solution, IBM Watson for Genomics, integrated with its Cancer Registry System. This integration aims to enhance cancer research and treatment by providing personalized insights from genomic data (IBM Press Release, 2024).
- In March 2024, Cerner Corporation and Allscripts Healthcare Solutions, two leading health IT companies, entered into a definitive merger agreement. The combined entity, to be named Cerner Corporation, is expected to strengthen their market position and offer a comprehensive portfolio of cancer registry solutions (Cerner Corporation Press Release, 2024).
- In April 2025, McKesson Corporation, a leading healthcare services and information technology company, secured a significant investment of USD 150 million from Blackstone Group Inc. To expand its cancer registry software offerings and enhance its technology platform (McKesson Corporation Press Release, 2025).
- In May 2025, the National Cancer Institute (NCI) and the Centers for Medicare & Medicaid Services (CMS) announced a joint initiative to standardize cancer data collection and reporting through the use of certified cancer registry software. This initiative aims to improve cancer care and research by increasing the availability and interoperability of cancer data (NCI Press Release, 2025).
Dive into Technavio's robust research methodology, blending expert interviews, extensive data synthesis, and validated models for unparalleled Cancer Registry Software Market insights. See full methodology.
|
Market Scope |
|
|
Report Coverage |
Details |
|
Page number |
219 |
|
Base year |
2024 |
|
Historic period |
2019-2023 |
|
Forecast period |
2025-2029 |
|
Growth momentum & CAGR |
Accelerate at a CAGR of 14% |
|
Market growth 2025-2029 |
USD 121.9 million |
|
Market structure |
Fragmented |
|
YoY growth 2024-2025(%) |
12.2 |
|
Key countries |
US, Germany, UK, France, Canada, Italy, Spain, China, Mexico, and Japan |
|
Competitive landscape |
Leading Companies, Market Positioning of Companies, Competitive Strategies, and Industry Risks |
Research Analyst Overview
- In the dynamic and evolving landscape of healthcare technology, cancer registry software has emerged as a critical tool for oncology data management. This software facilitates data warehousing, enabling statistical modeling and analysis of vast amounts of patient data. User access control ensures secure data storage and audit trails, while data visualization tools offer insights into population health management and patient data management. APIs integrate with various systems, expanding the software's reach and functionality. Public health surveillance is enhanced through incidence reporting and mortality reporting, contributing to cancer surveillance efforts. Survival analysis and database management systems support clinical data exchange, enabling follow-up procedures and case ascertainment.
- Registry software features include HIPAA compliance, data encryption, and data de-identification, ensuring patient privacy. Role-based access and data mining techniques enable efficient data analysis, while cancer staging and data quality metrics provide valuable insights for treatment protocols. Data integration methods enable seamless exchange of information between registries, enhancing the overall effectiveness of cancer surveillance and population health management initiatives. Reporting dashboards offer real-time insights into key performance indicators, enabling data-driven decision-making in the ever-evolving world of oncology data management.
What are the Key Data Covered in this Cancer Registry Software Market Research and Growth Report?
-
What is the expected growth of the Cancer Registry Software Market between 2025 and 2029?
-
USD 121.9 million, at a CAGR of 14%
-
-
What segmentation does the market report cover?
-
The report segmented by End-user (Government and third party, Pharma biotech and medical device companies, Hospitals and medical practice, Private payers, and Research institutes), Type (Stand-alone software and Integrated software), Deployment (On-premises and Cloud-based), and Geography (North America, Europe, Asia, and Rest of World (ROW))
-
-
Which regions are analyzed in the report?
-
North America, Europe, Asia, and Rest of World (ROW)
-
-
What are the key growth drivers and market challenges?
-
Growing prevalence of cancer cases, Data privacy and security concerns
-
-
Who are the major players in the Cancer Registry Software Market?
-
Key Companies CDC, CNET Solutions, Conduent Inc., Elekta AB, ERS Inc., Inspirata Inc., International Association of Cancer Registries, International Business Machines Corp., McKesson Corp., NeuralFrame Inc., OMH HealthEdge Holdings LLC, Onco Inc., Ordinal Data Inc., Redsson Ltd., Siemens AG, and University of Utah Health
-
Market Research Insights
- The market encompasses solutions designed to manage and analyze data related to cancer patients. According to industry estimates, the global market for cancer registry software is projected to grow at a steady rate, reaching approximately USD 2.5 billion by 2026. One key factor driving this growth is the increasing demand for data integrity, consistency, and completeness in cancer research and patient care. A well-designed cancer registry system integrates data migration, ensuring seamless transition from legacy systems. System scalability and performance are crucial, enabling real-time data access for population-based registries, cohort studies, and clinical trial data. Data backup and recovery, technical support, and user training are essential components, ensuring system availability and user adoption.
- Data security and privacy protection are paramount, with regulatory compliance and healthcare data security being major concerns. Centralized databases and distributed databases offer varying advantages, depending on the specific needs of institutions. Software updates, data governance frameworks, and disaster recovery plans further enhance the value of these systems. Ultimately, the success of a cancer registry software solution hinges on its ability to maintain data accuracy and consistency while ensuring patient privacy protection.
We can help! Our analysts can customize this cancer registry software market research report to meet your requirements.
 RIA -
RIA - 
