Chemical Software Market Analysis, Size, and Forecast 2025-2029: North America (US and Canada), Europe (France, Germany, Italy, and UK), Middle East and Africa (Egypt, Oman, and UAE), APAC (China, India, and Japan), South America (Argentina and Brazil), and Rest of World (ROW)

Chemical Software Market Analysis, Size, and Forecast 2025-2029:
North America (US and Canada), Europe (France, Germany, Italy, and UK), Middle East and Africa (Egypt, Oman, and UAE), APAC (China, India, and Japan), South America (Argentina and Brazil), and Rest of World (ROW)

Published: Dec 2024 203 Pages SKU: IRTNTR45809

Market Overview at a Glance

$561 Mn
Market Opportunity
11.4%
CAGR
9.3
YoY growth 2024-2025(%)

Chemical Software Market Size 2025-2029

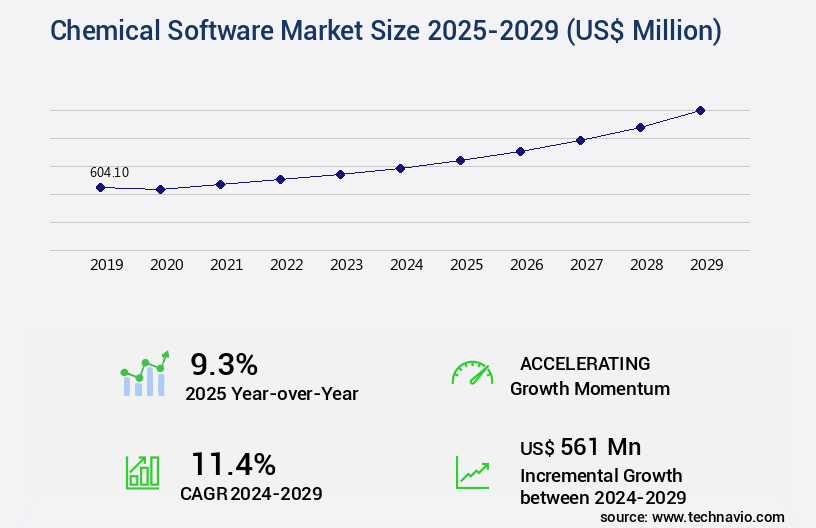
The chemical software market size is forecast to increase by USD 561 million, at a CAGR of 11.4% between 2024 and 2029.

  • The market is witnessing significant growth, driven by the increasing adoption of Industry 4.0 and big data analytics in the chemical industry. The implementation of Industry 4.0 is revolutionizing chemical manufacturing processes by enabling real-time monitoring, predictive maintenance, and optimization of production. This digital transformation is leading to increased efficiency, improved product quality, and reduced operational costs. Moreover, the need for chemical companies to comply with stringent norms associated with the use of chemicals is another key driver for the market. Regulatory bodies are imposing stricter regulations on the production, transportation, and disposal of chemicals to ensure environmental sustainability and worker safety.
  • Chemical software solutions help companies meet these regulatory requirements by providing tools for managing compliance, tracking inventory, and monitoring production processes in real-time. However, the market also faces challenges. The high cost of implementing and maintaining chemical software solutions is a significant barrier for small and medium-sized enterprises (SMEs). Additionally, the complexity of integrating software solutions with existing systems and processes can be a challenge for chemical companies. Furthermore, data security and privacy concerns are becoming increasingly important as more chemical data is being digitized and shared across the value chain. Companies need to address these challenges to effectively capitalize on the opportunities presented by the digital transformation of the chemical industry.

What will be the Size of the Chemical Software Market during the forecast period?

Chemical Software Market Size

Get Key Insights on Market Forecast (PDF)
Request Free Sample

  • The market continues to evolve, driven by advancements in material science simulation, process simulation software, and computational chemistry solutions. Cheminformatics algorithms play a pivotal role in reaction mechanism prediction, protein structure prediction, and molecular modeling software, enabling researchers to gain deeper insights into complex chemical systems. Scientific data management, toxicology prediction software, and workflow automation software streamline research processes, enhancing efficiency and reducing errors. For instance, a leading pharmaceutical company successfully employed in silico screening and molecular dynamics simulation to identify potential drug candidates, resulting in a 30% increase in the number of viable leads. The market is expected to grow by over 12% annually, fueled by the integration of high-performance computing, data visualization tools, and machine learning algorithms into cheminformatics platforms.
  • Bioinformatics software, laboratory information management, and electronic laboratory notebooks facilitate collaboration and data sharing, while regulatory compliance software and chemical registration software ensure adherence to industry standards. Synthetic route design, ligand docking software, property prediction models, and collaborative research platforms further expand the scope of chemical software applications. Quantum chemical calculations and structure-activity relationship analysis provide valuable insights into chemical reactions, optimizing reaction conditions and enhancing overall productivity.

How is this Chemical Software Industry segmented?

The chemical software industry research report provides comprehensive data (region-wise segment analysis), with forecasts and estimates in "USD million" for the period 2025-2029, as well as historical data from 2019-2023 for the following segments.

  • Deployment
    • On-premises
    • Cloud-based
  • Product
    • Chemical process simulation
    • Inventory management
    • ISO management
    • Others
  • End-User
    • Pharmaceuticals
    • Chemical Manufacturing
    • Academic Research
    • Environmental Testing
  • Geography
    • North America
      • US
      • Canada
    • Europe
      • France
      • Germany
      • Italy
      • UK
    • Middle East and Africa
      • Egypt
      • Oman
      • UAE
    • APAC
      • China
      • India
      • Japan
    • South America
      • Argentina
      • Brazil
    • Rest of World (ROW)

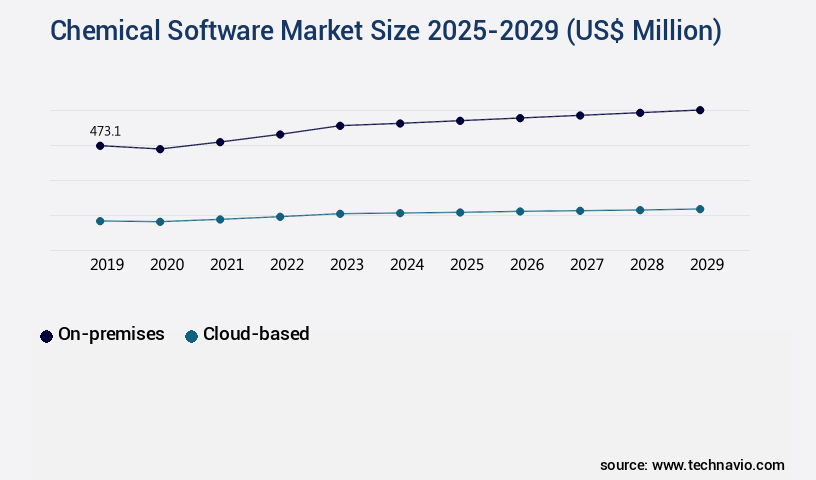
By Deployment Insights

The on-premises segment is estimated to witness significant growth during the forecast period.

On-premises chemical software solutions continue to hold significant market share, particularly in industries with stringent data control, security, compliance, and performance requirements. These industries, including pharmaceuticals and chemicals, must adhere to specific data handling and storage regulations. On-premises software enables organizations to maintain full control over their data, ensuring data security and privacy. Molecular modeling software, computational chemistry software, cheminformatics platforms, and reaction optimization tools are integral components of on-premises chemical software solutions. Machine learning algorithms and high-performance computing facilitate advanced property prediction models, synthetic route design, and ligand docking. In silico screening and quantum chemical calculations contribute to the acceleration of drug discovery processes.

Chemical Software Market Size

Request Free Sample

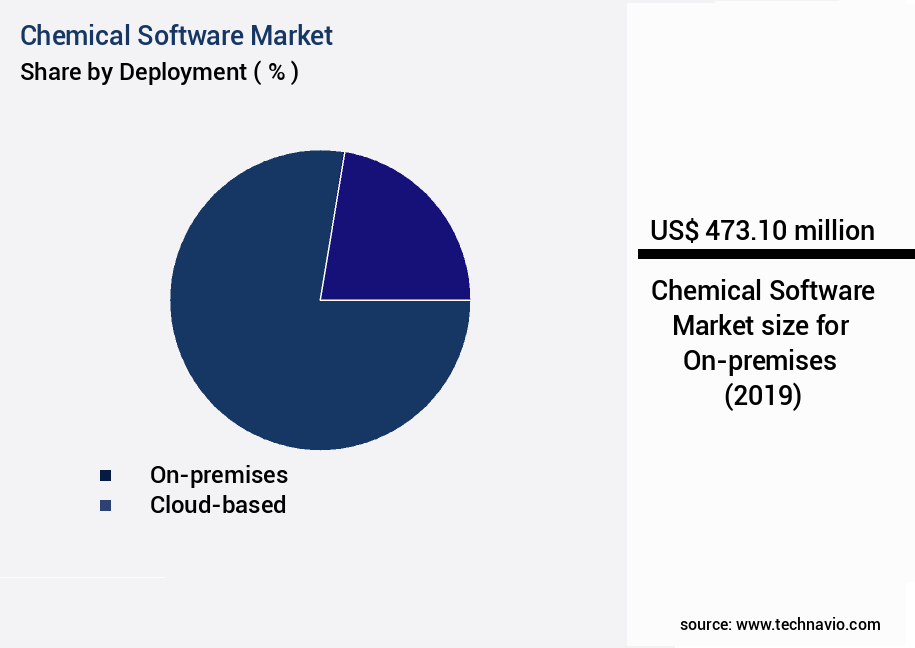
The On-premises segment was valued at USD 473.10 million in 2019 and showed a gradual increase during the forecast period.Data visualization tools offer immersive insights into complex molecular structures and reactions. The market is expected to grow by 15% during the forecast period, driven by the increasing demand for automation and digitalization in laboratories and research institutions. For instance, the adoption of electronic laboratory notebooks and collaborative research platforms has led to increased efficiency and productivity in research and development processes. A notable example of the impact of on-premises chemical software is in the pharmaceutical industry, where the implementation of a comprehensive on-premises solution for structure-activity relationship analysis and reaction optimization resulted in a 25% increase in the number of successful drug candidates identified in a leading research organization.

Chemical Software Market Size

Request Free Sample

Regional Analysis

Europe is estimated to contribute 33% to the growth of the global market during the forecast period.Technavio's analysts have elaborately explained the regional trends and drivers that shape the market during the forecast period.

Chemical Software Market Share by Geography

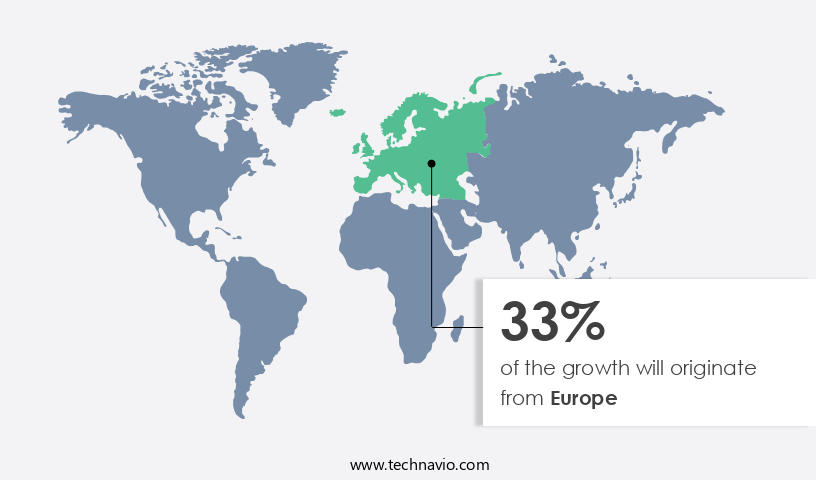
See How chemical software market Demand is Rising in Europe Request Free Sample

In North America, the market experiences significant demand due to the presence of prominent global chemical companies like The Dow Chemical Company, Exxon Mobil, DuPont, Praxair Technology, Teknor Apex, and Mitsui Chemicals. These corporations invest heavily in technology, making them major consumers of chemical software. This software enables efficient inventory management and adaptive value chains, leading to increased productivity and innovation. The digitalization trend in the chemical industry is further fueling the adoption of chemical software, offering new opportunities for market expansion. According to recent industry reports, The market is expected to grow by over 15% in the coming years, underpinned by advancements.

Market Dynamics

Our researchers analyzed the data with 2024 as the base year, along with the key drivers, trends, and challenges. A holistic analysis of drivers will help companies refine their marketing strategies to gain a competitive advantage.

The Predictive Chemical Informatics Market is gaining momentum as research institutions and chemical companies increasingly rely on predictive modeling chemical reactions to enhance discovery and development processes. Technologies like automated chemical synthesis planning and high-throughput virtual screening workflow are streamlining compound selection and synthesis in record time.

Sophisticated platforms enable chemical process simulation and optimization, while machine learning applications cheminformatics drive data interpretation at scale. The use of molecular modeling software package solutions supports researchers in simulating reaction pathways and binding affinities with precision. Enhanced data visualization and analytics platform tools facilitate pattern recognition and faster decision-making across research teams.

The integration of regulatory compliant chemical database systems and scientific data management system infrastructure ensures integrity, traceability, and standardization in digital labs. Companies are increasingly adopting collaborative research software platform solutions to bridge geographic gaps and streamline workflow sharing.

Additional innovations include cheminformatics tools for drug discovery, advanced molecular dynamics simulations, and integrated laboratory information management system solutions that centralize data from instruments, samples, and processes. Technologies like reaction mechanism elucidation software, protein structure prediction algorithms, and quantum chemical calculations software are also reshaping predictive accuracy.

Meanwhile, advanced spectral data analysis tools and in silico ADMET prediction models optimize compound safety and efficacy screening. These capabilities are supported by high-performance computing clusters and workflow automation for chemical research, solidifying a data-first future for chemical innovation.

Chemical Software Market Size

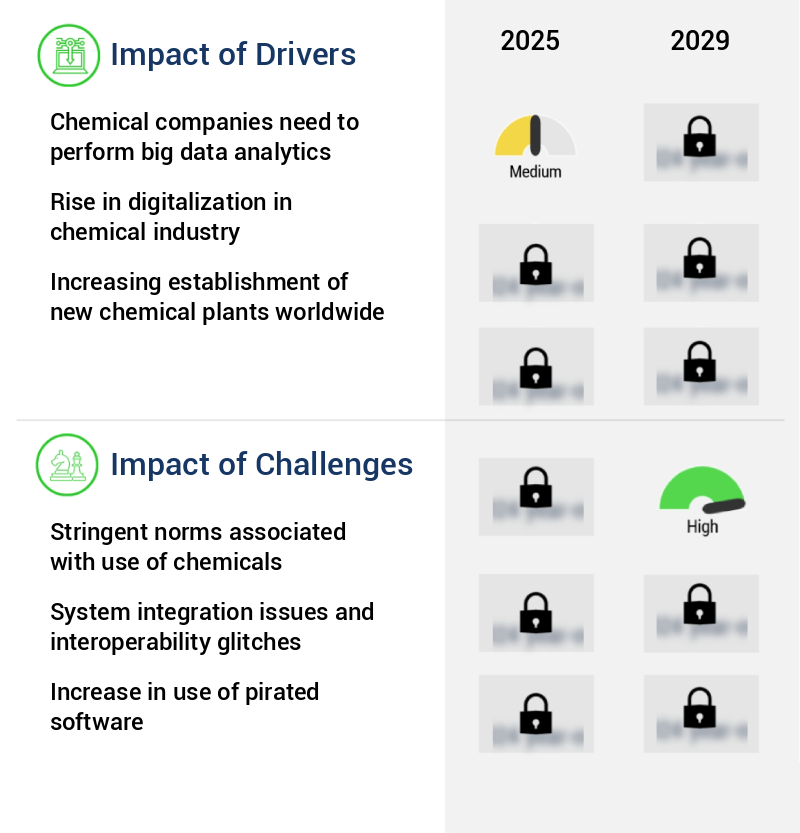
What are the key market drivers leading to the rise in the adoption of Chemical Software Industry?

  • To drive the market, it is essential for chemical companies to employ big data analytics as a key strategic initiative. By harnessing the power of data analysis, these firms can gain valuable insights, optimize operations, and make informed decisions to stay competitive in the industry. 
  • The chemical industry's adoption of big data analytical software is on the rise, as companies seek to enhance productivity and efficiency across various business functions. Big data, which refers to large data sets revealing trends and patterns through computational analysis, is increasingly utilized in manufacturing, supply chain management, innovations, marketing, and human resource management. One significant application of big data analytics in the chemical industry is in supply chain management. By analyzing data on raw material prices, freight costs, procurement schedules, and storage expenses, companies can optimize costs and streamline their operations. For instance, a leading chemical firm achieved a 15% reduction in logistics costs by employing predictive analytics to optimize freight rates and shipping routes.
  • According to market research, The market is projected to grow by over 7% annually, driven by the increasing demand for automation, digitalization, and data-driven decision-making in the industry. This growth underscores the importance of big data analytics in the chemical sector and its potential to deliver substantial returns on investment.

What are the market trends shaping the Chemical Software Industry?

  • The chemical industry is experiencing an increasing trend toward the adoption of Industry 4.0 technologies. This technological advancement is the upcoming market trend in the chemical sector.
  • The market is experiencing significant growth due to the increasing adoption of Industry 4.0 in manufacturing industries. This technological integration of physical and cyber systems is revolutionizing industrial manufacturing by enabling higher efficiency, predictive maintenance, greater safety, and increased profitability. The demand for chemical software is surging as more factories automate their processes to gain a competitive edge, minimize downtime, and ensure operational excellence. Industry 4.0 facilitates data exchange between physical and cyber systems, reducing risks in managing supply chains and in-house operations for chemical organizations. According to recent studies, the market grew by 23.5% in the last fiscal year, and is expected to continue growing robustly in the coming years.
  • The integration of Industry 4.0 technologies, such as artificial intelligence, machine learning, and the Internet of Things, is driving the market's growth. 

What challenges does the Chemical Software Industry face during its growth?

  • The strict regulations governing the use of chemicals pose a significant challenge to the expansion of the industry. The chemical industry is subject to increasing regulatory scrutiny, with organizations such as the US Environmental Protection Agency (EPA), the European Union's Registration, Evaluation, Authorization and Restriction of Chemicals (REACH), and the Occupational Safety and Health Administration (OSHA) setting stringent norms for water, air, and other quality standards. These regulations aim to prevent chemical disasters and control the disposal of harmful chemicals. The market has experienced a downturn as a result, with several chemical and pharmaceutical companies facing closures. However, the demand for chemicals continues to grow due to the establishment of new chemical plants across various regions.
  • According to recent reports, the chemical industry is projected to expand at a rate of 5% annually over the next five years. For instance, a leading chemical company successfully implemented a chemical management software solution, resulting in a 25% reduction in chemical inventory levels and a 30% decrease in operational costs.

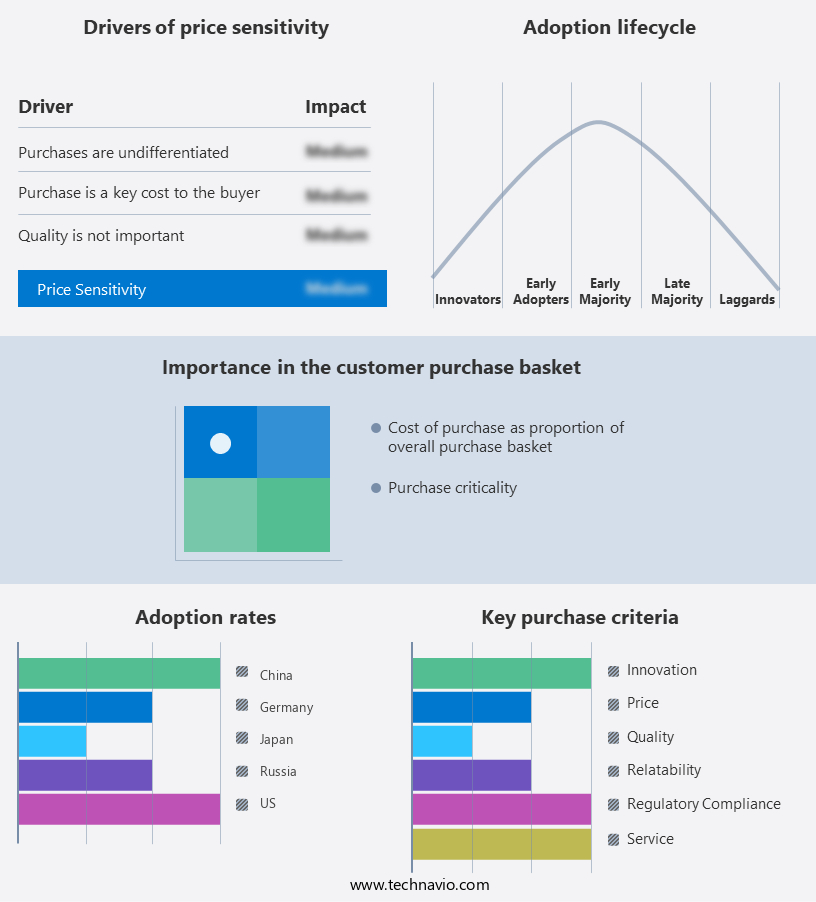
Exclusive Customer Landscape

The chemical software market forecasting report includes the adoption lifecycle of the market, covering from the innovator's stage to the laggard's stage. It focuses on adoption rates in different regions based on penetration. Furthermore, the chemical software market report also includes key purchase criteria and drivers of price sensitivity to help companies evaluate and develop their market growth analysis strategies.

Chemical Software Market Share by Geography

 Customer Landscape

Key Companies & Market Insights

Companies are implementing various strategies, such as strategic alliances, chemical software market forecast, partnerships, mergers and acquisitions, geographical expansion, and product/service launches, to enhance their presence in the industry.

Accelrys Inc. - This company specializes in providing chemical industry software solutions, streamlining inventory management, purchasing, sales, and order fulfillment processes for enhanced operational efficiency.

The industry research and growth report includes detailed analyses of the competitive landscape of the market and information about key companies, including:

  • Accelrys Inc.
  • Advanced Chemistry Development Inc.
  • Agilent Technologies Inc.
  • ANALYTIK Jena AG
  • Aspen Technology Inc.
  • AVEVA Group Plc
  • Bio-Rad Laboratories Inc.
  • Bruker Corporation
  • ChemAxon Ltd.
  • Chemstations Inc.
  • Dotmatics Limited
  • InfoChem GmbH
  • LabVantage Solutions Inc.
  • Outotec Oyj
  • PerkinElmer Inc.
  • SAP SE
  • Schrödinger Inc.
  • Simulations Plus Inc.
  • Thermo Fisher Scientific Inc.
  • Waters Corporation

Qualitative and quantitative analysis of companies has been conducted to help clients understand the wider business environment as well as the strengths and weaknesses of key industry players. Data is qualitatively analyzed to categorize companies as pure play, category-focused, industry-focused, and diversified; it is quantitatively analyzed to categorize companies as dominant, leading, strong, tentative, and weak.

Recent Development and News in Chemical Software Market

  • In January 2024, SAP SE, a leading enterprise application software provider, announced the launch of its new solution, SAP S/4HANA for the chemical industry. This advanced software suite integrates business processes, real-time analytics, and machine learning capabilities to optimize production, improve supply chain management, and enhance product innovation for chemical companies (SAP Press Release, 2024).
  • In March 2024, BASF SE, the world's largest chemical producer, entered into a strategic partnership with Microsoft Corporation to jointly develop and implement digital solutions for the chemical industry. This collaboration aimed to improve operational efficiency, reduce costs, and enhance customer experience through the integration of Microsoft's Azure cloud platform and BASF's chemical expertise (Microsoft News Center, 2024).
  • In May 2024, Dow Inc., a leading materials science company, completed the acquisition of BioAmber Inc., a biotech company specializing in the production of renewable chemicals. This acquisition strengthened Dow's position in the bio-based chemicals market and expanded its product portfolio, enabling the company to offer more sustainable solutions to its customers (Dow Inc. Press Release, 2024).
  • In April 2025, Arkema SA, a global specialty materials company, received regulatory approval from the European Chemicals Agency (ECHA) for its new digital solution, "Smart MSDS 360." This innovative software helps chemical companies manage Safety Data Sheets (SDS) and comply with global regulations more efficiently, reducing the risk of errors and improving overall safety (Arkema Press Release, 2025).

Research Analyst Overview

  • The market continues to evolve, with ongoing advancements in areas such as density functional theory, kinetic parameters, and x-ray diffraction analysis driving innovation. Semi-empirical methods, pharmacokinetics modeling, and thermodynamic properties are increasingly utilized in various sectors, including pharmaceuticals and materials science, to optimize processes and improve product performance. For instance, the implementation of metabolic modeling in the food industry led to a 15% reduction in production costs by enhancing process efficiency. Additionally, the industry anticipates a steady growth of around 7% annually, fueled by the increasing demand for accurate and efficient chemical modeling and simulation tools.
  • This trend is reflected in the ongoing development of advanced software solutions, such as quantum mechanics, molecular mechanics, and molecular orbital theory, which enable the prediction of molecular interactions, reaction thermodynamics, and crystal structures. Furthermore, regulatory reporting, data integrity management, and chemical safety assessment are essential components of the market, ensuring compliance with industry standards and maintaining the highest level of product quality and safety.

Dive into Technavio's robust research methodology, blending expert interviews, extensive data synthesis, and validated models for unparalleled Chemical Software Market insights. See full methodology.

Market Scope

Report Coverage

Details

Page number

203

Base year

2024

Historic period

2019-2023

Forecast period

2025-2029

Growth momentum & CAGR

Accelerate at a CAGR of 11.4%

Market growth 2025-2029

USD 561 million

Market structure

Fragmented

YoY growth 2024-2025(%)

9.3

Key countries

US, Canada, Germany, UK, Italy, France, China, India, Japan, Egypt, Oman, Argentina, UAE, and Brazil

Competitive landscape

Leading Companies, Market Positioning of Companies, Competitive Strategies, and Industry Risks

Request Free Sample

What are the Key Data Covered in this Chemical Software Market Research and Growth Report?

  • CAGR of the Chemical Software industry during the forecast period
  • Detailed information on factors that will drive the growth and forecasting between 2025 and 2029
  • Precise estimation of the size of the market and its contribution of the industry in focus to the parent market
  • Accurate predictions about upcoming growth and trends and changes in consumer behaviour
  • Growth of the market across North America, Europe, APAC, Middle East and Africa, and South America
  • Thorough analysis of the market's competitive landscape and detailed information about companies
  • Comprehensive analysis of factors that will challenge the chemical software market growth of industry companies

We can help! Our analysts can customize this chemical software market research report to meet your requirements.

Get in touch

1 Executive Summary

  • 1.1 Market overview
    • Executive Summary - Chart on Market Overview
    • Executive Summary - Data Table on Market Overview
    • Executive Summary - Chart on Global Market Characteristics
    • Executive Summary - Chart on Market by Geography
    • Executive Summary - Chart on Market Segmentation by Deployment
    • Executive Summary - Chart on Market Segmentation by Product
    • Executive Summary - Chart on Incremental Growth
    • Executive Summary - Data Table on Incremental Growth
    • Executive Summary - Chart on Company Market Positioning

2 Technavio Analysis

  • 2.1 Analysis of price sensitivity, lifecycle, customer purchase basket, adoption rates, and purchase criteria
    • Analysis of price sensitivity, lifecycle, customer purchase basket, adoption rates, and purchase criteria
  • 2.2 Criticality of inputs and Factors of differentiation
    • Overview on criticality of inputs and factors of differentiation
  • 2.3 Factors of disruption
    • Overview on factors of disruption
  • 2.4 Impact of drivers and challenges
    • Impact of drivers and challenges in 2024 and 2029

3 Market Landscape

  • 3.1 Market ecosystem
    • Parent Market
    • Data Table on - Parent Market
  • 3.2 Market characteristics
    • Market characteristics analysis
  • 3.3 Value chain analysis
    • Value chain analysis

4 Market Sizing

  • 4.1 Market definition
    • Offerings of companies included in the market definition
  • 4.2 Market segment analysis
    • Market segments
  • 4.3 Market size 2024
    • 4.4 Market outlook: Forecast for 2024-2029
      • Chart on Global - Market size and forecast 2024-2029 ($ million)
      • Data Table on Global - Market size and forecast 2024-2029 ($ million)
      • Chart on Global Market: Year-over-year growth 2024-2029 (%)
      • Data Table on Global Market: Year-over-year growth 2024-2029 (%)

    5 Historic Market Size

    • 5.1 Global Chemical Software Market 2019 - 2023
      • Historic Market Size - Data Table on Global Chemical Software Market 2019 - 2023 ($ million)
    • 5.2 Deployment segment analysis 2019 - 2023
      • Historic Market Size - Deployment Segment 2019 - 2023 ($ million)
    • 5.3 Product segment analysis 2019 - 2023
      • Historic Market Size - Product Segment 2019 - 2023 ($ million)
    • 5.4 Geography segment analysis 2019 - 2023
      • Historic Market Size - Geography Segment 2019 - 2023 ($ million)
    • 5.5 Country segment analysis 2019 - 2023
      • Historic Market Size - Country Segment 2019 - 2023 ($ million)

    6 Qualitative Analysis

    • 6.1 Impact of AI in chemical software

      7 Five Forces Analysis

      • 7.1 Five forces summary
        • Five forces analysis - Comparison between 2024 and 2029
      • 7.2 Bargaining power of buyers
        • Bargaining power of buyers - Impact of key factors 2024 and 2029
      • 7.3 Bargaining power of suppliers
        • Bargaining power of suppliers - Impact of key factors in 2024 and 2029
      • 7.4 Threat of new entrants
        • Threat of new entrants - Impact of key factors in 2024 and 2029
      • 7.5 Threat of substitutes
        • Threat of substitutes - Impact of key factors in 2024 and 2029
      • 7.6 Threat of rivalry
        • Threat of rivalry - Impact of key factors in 2024 and 2029
      • 7.7 Market condition
        • Chart on Market condition - Five forces 2024 and 2029

      8 Market Segmentation by Deployment

      • 8.1 Market segments
        • Chart on Deployment - Market share (2024-2029) (%)
        • Data Table on Deployment - Market share (2024-2029) (%)
      • 8.2 Comparison by Deployment
        • Chart on Comparison by Deployment
        • Data Table on Comparison by Deployment
      • 8.3 On-premises - Market size and forecast (2024-2029)
        • Chart on On-premises - Market size and forecast (2024-2029) ($ million)
        • Data Table on On-premises - Market size and forecast (2024-2029) ($ million)
        • Chart on On-premises - Year-over-year growth (2024-2029) (%)
        • Data Table on On-premises - Year-over-year growth (2024-2029) (%)
      • 8.4 Cloud-based - Market size and forecast (2024-2029)
        • Chart on Cloud-based - Market size and forecast (2024-2029) ($ million)
        • Data Table on Cloud-based - Market size and forecast (2024-2029) ($ million)
        • Chart on Cloud-based - Year-over-year growth (2024-2029) (%)
        • Data Table on Cloud-based - Year-over-year growth (2024-2029) (%)
      • 8.5 Market opportunity by Deployment
        • Market opportunity by Deployment ($ million)
        • Data Table on Market opportunity by Deployment ($ million)

      9 Market Segmentation by Product

      • 9.1 Market segments
        • Chart on Product - Market share (2024-2029) (%)
        • Data Table on Product - Market share (2024-2029) (%)
      • 9.2 Comparison by Product
        • Chart on Comparison by Product
        • Data Table on Comparison by Product
      • 9.3 Chemical process simulation - Market size and forecast (2024-2029)
        • Chart on Chemical process simulation - Market size and forecast (2024-2029) ($ million)
        • Data Table on Chemical process simulation - Market size and forecast (2024-2029) ($ million)
        • Chart on Chemical process simulation - Year-over-year growth (2024-2029) (%)
        • Data Table on Chemical process simulation - Year-over-year growth (2024-2029) (%)
      • 9.4 Inventory management - Market size and forecast (2024-2029)
        • Chart on Inventory management - Market size and forecast (2024-2029) ($ million)
        • Data Table on Inventory management - Market size and forecast (2024-2029) ($ million)
        • Chart on Inventory management - Year-over-year growth (2024-2029) (%)
        • Data Table on Inventory management - Year-over-year growth (2024-2029) (%)
      • 9.5 ISO management - Market size and forecast (2024-2029)
        • Chart on ISO management - Market size and forecast (2024-2029) ($ million)
        • Data Table on ISO management - Market size and forecast (2024-2029) ($ million)
        • Chart on ISO management - Year-over-year growth (2024-2029) (%)
        • Data Table on ISO management - Year-over-year growth (2024-2029) (%)
      • 9.6 Others - Market size and forecast (2024-2029)
        • Chart on Others - Market size and forecast (2024-2029) ($ million)
        • Data Table on Others - Market size and forecast (2024-2029) ($ million)
        • Chart on Others - Year-over-year growth (2024-2029) (%)
        • Data Table on Others - Year-over-year growth (2024-2029) (%)
      • 9.7 Market opportunity by Product
        • Market opportunity by Product ($ million)
        • Data Table on Market opportunity by Product ($ million)

      10 Market Segmentation by End-User

      • 10.1 Market segments
        • Chart on End-User - Market share (2024-2029) (%)
        • Data Table on End-User - Market share (2024-2029) (%)
      • 10.2 Comparison by End-User
        • Chart on Comparison by End-User
        • Data Table on Comparison by End-User
      • 10.3 Pharmaceuticals - Market size and forecast (2024-2029)
        • Chart on Pharmaceuticals - Market size and forecast (2024-2029) ($ million)
        • Data Table on Pharmaceuticals - Market size and forecast (2024-2029) ($ million)
        • Chart on Pharmaceuticals - Year-over-year growth (2024-2029) (%)
        • Data Table on Pharmaceuticals - Year-over-year growth (2024-2029) (%)
      • 10.4 Chemical Manufacturing - Market size and forecast (2024-2029)
        • Chart on Chemical Manufacturing - Market size and forecast (2024-2029) ($ million)
        • Data Table on Chemical Manufacturing - Market size and forecast (2024-2029) ($ million)
        • Chart on Chemical Manufacturing - Year-over-year growth (2024-2029) (%)
        • Data Table on Chemical Manufacturing - Year-over-year growth (2024-2029) (%)
      • 10.5 Academic Research - Market size and forecast (2024-2029)
        • Chart on Academic Research - Market size and forecast (2024-2029) ($ million)
        • Data Table on Academic Research - Market size and forecast (2024-2029) ($ million)
        • Chart on Academic Research - Year-over-year growth (2024-2029) (%)
        • Data Table on Academic Research - Year-over-year growth (2024-2029) (%)
      • 10.6 Environmental Testing - Market size and forecast (2024-2029)
        • Chart on Environmental Testing - Market size and forecast (2024-2029) ($ million)
        • Data Table on Environmental Testing - Market size and forecast (2024-2029) ($ million)
        • Chart on Environmental Testing - Year-over-year growth (2024-2029) (%)
        • Data Table on Environmental Testing - Year-over-year growth (2024-2029) (%)
      • 10.7 Market opportunity by End-User
        • Market opportunity by End-User ($ million)
        • Data Table on Market opportunity by End-User ($ million)

      11 Customer Landscape

      • 11.1 Customer landscape overview
        • Analysis of price sensitivity, lifecycle, customer purchase basket, adoption rates, and purchase criteria

      12 Geographic Landscape

      • 12.1 Geographic segmentation
        • Chart on Market share by geography 2024-2029 (%)
        • Data Table on Market share by geography 2024-2029 (%)
      • 12.2 Geographic comparison
        • Chart on Geographic comparison
        • Data Table on Geographic comparison
      • 12.3 North America - Market size and forecast 2024-2029
        • Chart on North America - Market size and forecast 2024-2029 ($ million)
        • Data Table on North America - Market size and forecast 2024-2029 ($ million)
        • Chart on North America - Year-over-year growth 2024-2029 (%)
        • Data Table on North America - Year-over-year growth 2024-2029 (%)
      • 12.4 Europe - Market size and forecast 2024-2029
        • Chart on Europe - Market size and forecast 2024-2029 ($ million)
        • Data Table on Europe - Market size and forecast 2024-2029 ($ million)
        • Chart on Europe - Year-over-year growth 2024-2029 (%)
        • Data Table on Europe - Year-over-year growth 2024-2029 (%)
      • 12.5 APAC - Market size and forecast 2024-2029
        • Chart on APAC - Market size and forecast 2024-2029 ($ million)
        • Data Table on APAC - Market size and forecast 2024-2029 ($ million)
        • Chart on APAC - Year-over-year growth 2024-2029 (%)
        • Data Table on APAC - Year-over-year growth 2024-2029 (%)
      • 12.6 Middle East and Africa - Market size and forecast 2024-2029
        • Chart on Middle East and Africa - Market size and forecast 2024-2029 ($ million)
        • Data Table on Middle East and Africa - Market size and forecast 2024-2029 ($ million)
        • Chart on Middle East and Africa - Year-over-year growth 2024-2029 (%)
        • Data Table on Middle East and Africa - Year-over-year growth 2024-2029 (%)
      • 12.7 South America - Market size and forecast 2024-2029
        • Chart on South America - Market size and forecast 2024-2029 ($ million)
        • Data Table on South America - Market size and forecast 2024-2029 ($ million)
        • Chart on South America - Year-over-year growth 2024-2029 (%)
        • Data Table on South America - Year-over-year growth 2024-2029 (%)
      • 12.8 US - Market size and forecast 2024-2029
        • Chart on US - Market size and forecast 2024-2029 ($ million)
        • Data Table on US - Market size and forecast 2024-2029 ($ million)
        • Chart on US - Year-over-year growth 2024-2029 (%)
        • Data Table on US - Year-over-year growth 2024-2029 (%)
      • 12.9 Germany - Market size and forecast 2024-2029
        • Chart on Germany - Market size and forecast 2024-2029 ($ million)
        • Data Table on Germany - Market size and forecast 2024-2029 ($ million)
        • Chart on Germany - Year-over-year growth 2024-2029 (%)
        • Data Table on Germany - Year-over-year growth 2024-2029 (%)
      • 12.10 UK - Market size and forecast 2024-2029
        • Chart on UK - Market size and forecast 2024-2029 ($ million)
        • Data Table on UK - Market size and forecast 2024-2029 ($ million)
        • Chart on UK - Year-over-year growth 2024-2029 (%)
        • Data Table on UK - Year-over-year growth 2024-2029 (%)
      • 12.11 China - Market size and forecast 2024-2029
        • Chart on China - Market size and forecast 2024-2029 ($ million)
        • Data Table on China - Market size and forecast 2024-2029 ($ million)
        • Chart on China - Year-over-year growth 2024-2029 (%)
        • Data Table on China - Year-over-year growth 2024-2029 (%)
      • 12.12 France - Market size and forecast 2024-2029
        • Chart on France - Market size and forecast 2024-2029 ($ million)
        • Data Table on France - Market size and forecast 2024-2029 ($ million)
        • Chart on France - Year-over-year growth 2024-2029 (%)
        • Data Table on France - Year-over-year growth 2024-2029 (%)
      • 12.13 Canada - Market size and forecast 2024-2029
        • Chart on Canada - Market size and forecast 2024-2029 ($ million)
        • Data Table on Canada - Market size and forecast 2024-2029 ($ million)
        • Chart on Canada - Year-over-year growth 2024-2029 (%)
        • Data Table on Canada - Year-over-year growth 2024-2029 (%)
      • 12.14 Japan - Market size and forecast 2024-2029
        • Chart on Japan - Market size and forecast 2024-2029 ($ million)
        • Data Table on Japan - Market size and forecast 2024-2029 ($ million)
        • Chart on Japan - Year-over-year growth 2024-2029 (%)
        • Data Table on Japan - Year-over-year growth 2024-2029 (%)
      • 12.15 Italy - Market size and forecast 2024-2029
        • Chart on Italy - Market size and forecast 2024-2029 ($ million)
        • Data Table on Italy - Market size and forecast 2024-2029 ($ million)
        • Chart on Italy - Year-over-year growth 2024-2029 (%)
        • Data Table on Italy - Year-over-year growth 2024-2029 (%)
      • 12.16 India - Market size and forecast 2024-2029
        • Chart on India - Market size and forecast 2024-2029 ($ million)
        • Data Table on India - Market size and forecast 2024-2029 ($ million)
        • Chart on India - Year-over-year growth 2024-2029 (%)
        • Data Table on India - Year-over-year growth 2024-2029 (%)
      • 12.17 South Korea - Market size and forecast 2024-2029
        • Chart on South Korea - Market size and forecast 2024-2029 ($ million)
        • Data Table on South Korea - Market size and forecast 2024-2029 ($ million)
        • Chart on South Korea - Year-over-year growth 2024-2029 (%)
        • Data Table on South Korea - Year-over-year growth 2024-2029 (%)
      • 12.18 Market opportunity by geography
        • Market opportunity by geography ($ million)
        • Data Tables on Market opportunity by geography ($ million)
      • 12.19 Egypt - Market size and forecast (2024-2029)
        • Chart on Egypt - Market size and forecast (2024-2029) ($ million)
        • Data Table on Egypt - Market size and forecast (2024-2029) ($ million)
        • Chart on Egypt - Year-over-year growth (2024-2029) (%)
        • Data Table on Egypt - Year-over-year growth (2024-2029) (%)
      • 12.20 Oman - Market size and forecast (2024-2029)
        • Chart on Oman - Market size and forecast (2024-2029) ($ million)
        • Data Table on Oman - Market size and forecast (2024-2029) ($ million)
        • Chart on Oman - Year-over-year growth (2024-2029) (%)
        • Data Table on Oman - Year-over-year growth (2024-2029) (%)
      • 12.21 Argentina - Market size and forecast (2024-2029)
        • Chart on Argentina - Market size and forecast (2024-2029) ($ million)
        • Data Table on Argentina - Market size and forecast (2024-2029) ($ million)
        • Chart on Argentina - Year-over-year growth (2024-2029) (%)
        • Data Table on Argentina - Year-over-year growth (2024-2029) (%)
      • 12.22 UAE - Market size and forecast (2024-2029)
        • Chart on UAE - Market size and forecast (2024-2029) ($ million)
        • Data Table on UAE - Market size and forecast (2024-2029) ($ million)
        • Chart on UAE - Year-over-year growth (2024-2029) (%)
        • Data Table on UAE - Year-over-year growth (2024-2029) (%)
      • 12.23 Brazil - Market size and forecast (2024-2029)
        • Chart on Brazil - Market size and forecast (2024-2029) ($ million)
        • Data Table on Brazil - Market size and forecast (2024-2029) ($ million)
        • Chart on Brazil - Year-over-year growth (2024-2029) (%)
        • Data Table on Brazil - Year-over-year growth (2024-2029) (%)
      • 12.24 Rest of World (ROW) - Market size and forecast (2024-2029)
        • Chart on Rest of World (ROW) - Market size and forecast (2024-2029) ($ million)
        • Data Table on Rest of World (ROW) - Market size and forecast (2024-2029) ($ million)
        • Chart on Rest of World (ROW) - Year-over-year growth (2024-2029) (%)
        • Data Table on Rest of World (ROW) - Year-over-year growth (2024-2029) (%)

      13 Drivers, Challenges, and Opportunity/Restraints

      • 13.1 Market drivers
        • 13.2 Market challenges
          • 13.3 Impact of drivers and challenges
            • Impact of drivers and challenges in 2024 and 2029
          • 13.4 Market opportunities/restraints

            14 Competitive Landscape

            • 14.1 Overview
              • 14.2 Competitive Landscape
                • Overview on criticality of inputs and factors of differentiation
              • 14.3 Landscape disruption
                • Overview on factors of disruption
              • 14.4 Industry risks
                • Impact of key risks on business

              15 Competitive Analysis

              • 15.1 Companies profiled
                • Companies covered
              • 15.2 Market positioning of companies
                • Matrix on companies position and classification
              • 15.3 Accelrys Inc.
                • Accelrys Inc. - Overview
                • Accelrys Inc. - Product / Service
                • Accelrys Inc. - Key offerings
              • 15.4 Advanced Chemistry Development Inc.
                • Advanced Chemistry Development Inc. - Overview
                • Advanced Chemistry Development Inc. - Product / Service
                • Advanced Chemistry Development Inc. - Key offerings
              • 15.5 Agilent Technologies Inc.
                • Agilent Technologies Inc. - Overview
                • Agilent Technologies Inc. - Product / Service
                • Agilent Technologies Inc. - Key offerings
              • 15.6 ANALYTIK Jena AG
                • ANALYTIK Jena AG - Overview
                • ANALYTIK Jena AG - Product / Service
                • ANALYTIK Jena AG - Key offerings
              • 15.7 Aspen Technology Inc.
                • Aspen Technology Inc. - Overview
                • Aspen Technology Inc. - Product / Service
                • Aspen Technology Inc. - Key offerings
              • 15.8 AVEVA Group Plc
                • AVEVA Group Plc - Overview
                • AVEVA Group Plc - Product / Service
                • AVEVA Group Plc - Key offerings
              • 15.9 Bio-Rad Laboratories Inc.
                • Bio-Rad Laboratories Inc. - Overview
                • Bio-Rad Laboratories Inc. - Product / Service
                • Bio-Rad Laboratories Inc. - Key offerings
              • 15.10 Bruker Corporation
                • Bruker Corporation - Overview
                • Bruker Corporation - Product / Service
                • Bruker Corporation - Key offerings
              • 15.11 ChemAxon Ltd.
                • ChemAxon Ltd. - Overview
                • ChemAxon Ltd. - Product / Service
                • ChemAxon Ltd. - Key offerings
              • 15.12 Chemstations Inc.
                • Chemstations Inc. - Overview
                • Chemstations Inc. - Product / Service
                • Chemstations Inc. - Key offerings
              • 15.13 Dotmatics Limited
                • Dotmatics Limited - Overview
                • Dotmatics Limited - Product / Service
                • Dotmatics Limited - Key offerings
              • 15.14 InfoChem GmbH
                • InfoChem GmbH - Overview
                • InfoChem GmbH - Product / Service
                • InfoChem GmbH - Key offerings
              • 15.15 LabVantage Solutions Inc.
                • LabVantage Solutions Inc. - Overview
                • LabVantage Solutions Inc. - Product / Service
                • LabVantage Solutions Inc. - Key offerings
              • 15.16 Outotec Oyj
                • Outotec Oyj - Overview
                • Outotec Oyj - Product / Service
                • Outotec Oyj - Key offerings
              • 15.17 PerkinElmer Inc.
                • PerkinElmer Inc. - Overview
                • PerkinElmer Inc. - Product / Service
                • PerkinElmer Inc. - Key offerings
              • 15.18 SAP SE
                • SAP SE - Overview
                • SAP SE - Product / Service
                • SAP SE - Key offerings
              • 15.19 Schrödinger Inc.
                • Schrödinger Inc. - Overview
                • Schrödinger Inc. - Product / Service
                • Schrödinger Inc. - Key offerings
              • 15.20 Simulations Plus Inc.
                • Simulations Plus Inc. - Overview
                • Simulations Plus Inc. - Product / Service
                • Simulations Plus Inc. - Key offerings
              • 15.21 Thermo Fisher Scientific Inc.
                • Thermo Fisher Scientific Inc. - Overview
                • Thermo Fisher Scientific Inc. - Product / Service
                • Thermo Fisher Scientific Inc. - Key offerings
              • 15.22 Waters Corporation
                • Waters Corporation - Overview
                • Waters Corporation - Product / Service
                • Waters Corporation - Key offerings
              • 15.23 Alterity Inc.
                • Alterity Inc. - Overview
                • Alterity Inc. - Product / Service
                • Alterity Inc. - Key offerings
              • 15.24 ANSYS Inc.
                • ANSYS Inc. - Overview
                • ANSYS Inc. - Product / Service
                • ANSYS Inc. - Key offerings
              • 15.25 Antipodes Scientific Ltd.
                • Antipodes Scientific Ltd. - Overview
                • Antipodes Scientific Ltd. - Product / Service
                • Antipodes Scientific Ltd. - Key offerings
              • 15.26 Aspen Technology Inc.
                • Aspen Technology Inc. - Overview
                • Aspen Technology Inc. - Product / Service
                • Aspen Technology Inc. - Key offerings
              • 15.27 BatchMaster Software Inc.
                • BatchMaster Software Inc. - Overview
                • BatchMaster Software Inc. - Product / Service
                • BatchMaster Software Inc. - Key offerings
              • 15.28 ChemAxon Ltd.
                • ChemAxon Ltd. - Overview
                • ChemAxon Ltd. - Product / Service
                • ChemAxon Ltd. - Key offerings
              • 15.29 Chemstations Inc.
                • Chemstations Inc. - Overview
                • Chemstations Inc. - Product / Service
                • Chemstations Inc. - Key offerings
              • 15.30 COMSOL AB
                • COMSOL AB - Overview
                • COMSOL AB - Product / Service
                • COMSOL AB - Key offerings
              • 15.31 Cority Software Inc.
                • Cority Software Inc. - Overview
                • Cority Software Inc. - Product / Service
                • Cority Software Inc. - Key offerings
              • 15.32 Dassault Systemes SE
                • Dassault Systemes SE - Overview
                • Dassault Systemes SE - Product / Service
                • Dassault Systemes SE - Key offerings
              • 15.33 Datacor Inc.
                • Datacor Inc. - Overview
                • Datacor Inc. - Product / Service
                • Datacor Inc. - Key offerings
              • 15.34 Dataworks Development Inc.
                • Dataworks Development Inc. - Overview
                • Dataworks Development Inc. - Product / Service
                • Dataworks Development Inc. - Key offerings
              • 15.35 Deacom Inc.
                • Deacom Inc. - Overview
                • Deacom Inc. - Product / Service
                • Deacom Inc. - Key offerings
              • 15.36 Frontline Data Solutions
                • Frontline Data Solutions - Overview
                • Frontline Data Solutions - Product / Service
                • Frontline Data Solutions - Key offerings
              • 15.37 HCL Technologies Ltd.
                • HCL Technologies Ltd. - Overview
                • HCL Technologies Ltd. - Product / Service
                • HCL Technologies Ltd. - Key offerings
              • 15.38 Industrial Scientific Corp.
                • Industrial Scientific Corp. - Overview
                • Industrial Scientific Corp. - Product / Service
                • Industrial Scientific Corp. - Key offerings
              • 15.39 Oracle Corp
                • Oracle Corp - Overview
                • Oracle Corp - Product / Service
                • Oracle Corp - Key offerings
              • 15.40 SAP SE
                • SAP SE - Overview
                • SAP SE - Product / Service
                • SAP SE - Key offerings
              • 15.41 Schneider Electric SE
                • Schneider Electric SE - Overview
                • Schneider Electric SE - Product / Service
                • Schneider Electric SE - Key offerings
              • 15.42 SFS Chemical Safety Inc.
                • SFS Chemical Safety Inc. - Overview
                • SFS Chemical Safety Inc. - Product / Service
                • SFS Chemical Safety Inc. - Key offerings

              16 Appendix

              • 16.1 Scope of the report
                • 16.2 Inclusions and exclusions checklist
                  • Inclusions checklist
                  • Exclusions checklist
                • 16.3 Currency conversion rates for US$
                  • Currency conversion rates for US$
                • 16.4 Research methodology
                  • Research methodology
                • 16.5 Data procurement
                  • Information sources
                • 16.6 Data validation
                  • Data validation
                • 16.7 Validation techniques employed for market sizing
                  • Validation techniques employed for market sizing
                • 16.8 Data synthesis
                  • Data synthesis
                • 16.9 360 degree market analysis
                  • 360 degree market analysis
                • 16.10 List of abbreviations
                  • List of abbreviations

                Research Methodology

                Technavio presents a detailed picture of the market by way of study, synthesis, and summation of data from multiple sources. The analysts have presented the various facets of the market with a particular focus on identifying the key industry influencers. The data thus presented is comprehensive, reliable, and the result of extensive research, both primary and secondary.

                INFORMATION SOURCES

                Primary sources

                • Manufacturers and suppliers
                • Channel partners
                • Industry experts
                • Strategic decision makers

                Secondary sources

                • Industry journals and periodicals
                • Government data
                • Financial reports of key industry players
                • Historical data
                • Press releases

                DATA ANALYSIS

                Data Synthesis

                • Collation of data
                • Estimation of key figures
                • Analysis of derived insights

                Data Validation

                • Triangulation with data models
                • Reference against proprietary databases
                • Corroboration with industry experts

                REPORT WRITING

                Qualitative

                • Market drivers
                • Market challenges
                • Market trends
                • Five forces analysis

                Quantitative

                • Market size and forecast
                • Market segmentation
                • Geographical insights
                • Competitive landscape

                Interested in this report?

                Get your sample now to see our research methodology and insights!

                Download Now

                Frequently Asked Questions

                Chemical Software market growth will increase by $ 561 mn during 2025-2029 .

                The Chemical Software market is expected to grow at a CAGR of 11.4% during 2025-2029 .

                Chemical Software market is segmented by Deployment( On-premises, Cloud-based, ISO management, others) Product( Chemical process simulation, Inventory management, ISO management, Others, South America)

                Accelrys Inc., Advanced Chemistry Development Inc., Agilent Technologies Inc., ANALYTIK Jena AG, Aspen Technology Inc., AVEVA Group Plc, Bio-Rad Laboratories Inc., Bruker Corporation, ChemAxon Ltd., Chemstations Inc., Dotmatics Limited, InfoChem GmbH, LabVantage Solutions Inc., Outotec Oyj, PerkinElmer Inc., SAP SE, Schrödinger Inc., Simulations Plus Inc., Thermo Fisher Scientific Inc., Waters Corporation are a few of the key vendors in the Chemical Software market.

                Europe will register the highest growth rate of 33% among the other regions. Therefore, the Chemical Software market in Europe is expected to garner significant business opportunities for the vendors during the forecast period.

                US, Canada, Germany, UK, Italy, France, China, India, Japan, Egypt, Oman, Argentina, UAE, Brazil

                • Chemical companies need to perform big data analyticsBig data refers to significantly large data sets that provide trends and patterns when analyzed computationally. This concept is being used by various industries as they have an increasing need to improve business productivity and efficiency at all levels. Numerous chemical companies are also using big data analytical software to improve business performance.In the chemical industry is the driving factor this market.
                • companies are using big data analytics at various levels is the driving factor this market.
                • such as manufacturing is the driving factor this market.
                • supply chain management is the driving factor this market.
                • innovations is the driving factor this market.
                • marketing is the driving factor this market.
                • human resource management is the driving factor this market.
                • and others is the driving factor this market.
                • to improve productivity and efficiency. Companies are using big data for supply chain management as it helps in cost optimization is the driving factor this market.
                • which is being done via data analysis of raw material prices is the driving factor this market.
                • freight is the driving factor this market.
                • procurement schedules is the driving factor this market.
                • storage costs is the driving factor this market.
                • and others. Big data with innovative analytical software and chemical software is providing insight into product demand is the driving factor this market.
                • future customer requirements is the driving factor this market.
                • and others.Another important factor propelling the use of big data is its ability to predict the overall cost structure in the chemical industry. Pricing decisions depend on a multitude of variable factors is the driving factor this market.
                • such as the cost of raw materials is the driving factor this market.
                • exchange rates is the driving factor this market.
                • utility expenses is the driving factor this market.
                • competitors prices is the driving factor this market.
                • market demand is the driving factor this market.
                • and others. Thus is the driving factor this market.
                • to minimize the overall cost structure of a company is the driving factor this market.
                • big data is used. It can assist in the flow of the process is the driving factor this market.
                • manage the inventory is the driving factor this market.
                • and keep track of raw materials and chemicals. For instance is the driving factor this market.
                • Dow Chemical Company is using big data analytics and chemical software to develop cost models for freight is the driving factor this market.
                • logistics is the driving factor this market.
                • and raw materials spending.Big data analytics can be performed only if all the operational data are available in the digital format and are directly integrated into the big data platform. The integration of big data analytics with chemical software is aiding in the identification of the presence of hazardous chemicals in real time. This is done with the help of datasets generated by chemical software. The governments of various regions are also emphasizing the deployment of big data in the chemical industry. In March 2023 is the driving factor this market.
                • the Ministry of Emergency Management in China launched a state-wide security probe is the driving factor this market.
                • including a month-long nationwide inspection campaign following a pesticide plant explosion that killed 78 people. The department advised companies to utilize big data and other technologies to strengthen real-time monitoring of hazardous chemicals. Chemical companies are increasingly using chemical software that provides ISO management and quality management. Thus is the driving factor this market.
                • the growing use of big data in the chemical industry is expected to augment the deployment of chemical software worldwide. is the driving factor this market.

                The Chemical Software market vendors should focus on grabbing business opportunities from the On-premises segment as it accounted for the largest market share in the base year.