Commercial Beverage Dispensers Market Analysis, Size, and Forecast 2025-2029: North America (US and Canada), Europe (France, Germany, and UK), APAC (Australia, China, India, and South Korea), and Rest of World (ROW)

Commercial Beverage Dispensers Market Analysis, Size, and Forecast 2025-2029:
North America (US and Canada), Europe (France, Germany, and UK), APAC (Australia, China, India, and South Korea), and Rest of World (ROW)

Published: Dec 2024 204 Pages SKU: IRTNTR71304

Market Overview at a Glance

$242.9 Mn
Market Opportunity
5.1%
CAGR
4.7
YoY growth 2024-2025(%)

Commercial Beverage Dispensers Market Size 2025-2029

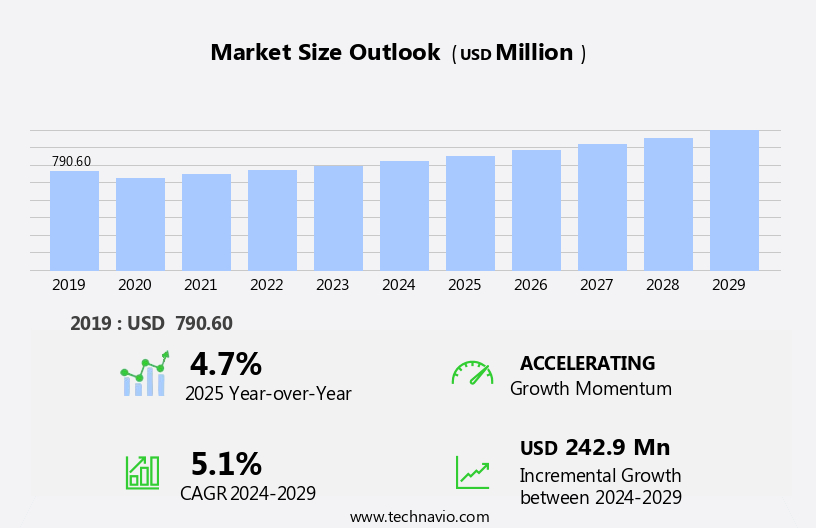
The commercial beverage dispensers market size is forecast to increase by USD 242.9 million, at a CAGR of 5.1% between 2024 and 2029.

  • The market is witnessing significant growth due to the increasing online presence of companies, providing easy access to these products. This trend is driving market expansion as businesses seek to modernize their facilities and enhance customer experience. Furthermore, companies are focusing on developing commercial beverage dispensers with advanced connectivity options, enabling remote monitoring and management of inventory and machine performance. The increasing popularity of soft drinks, tea, alcoholic beverages, juices, and other non-alcoholic beverages in the food service industry is also driving market demand. However, the market faces a challenge with a low product replacement cycle, requiring continuous innovation and improvement to maintain market share.
  • Companies must invest in research and development to address this obstacle and offer products with extended lifespans and superior functionality. To capitalize on opportunities and navigate challenges effectively, businesses should stay informed about market trends and consumer preferences, while also prioritizing product quality and reliability.

Quick Stats of Commercial Beverage Dispensers Market

  • Incremental Value (2025-2029): USD 242.9 million
  • Forecast CAGR: 5.1%
  • Historic Value (2019): USD 790.6 million
  • Leading Market Segment in 2025: Refrigerated
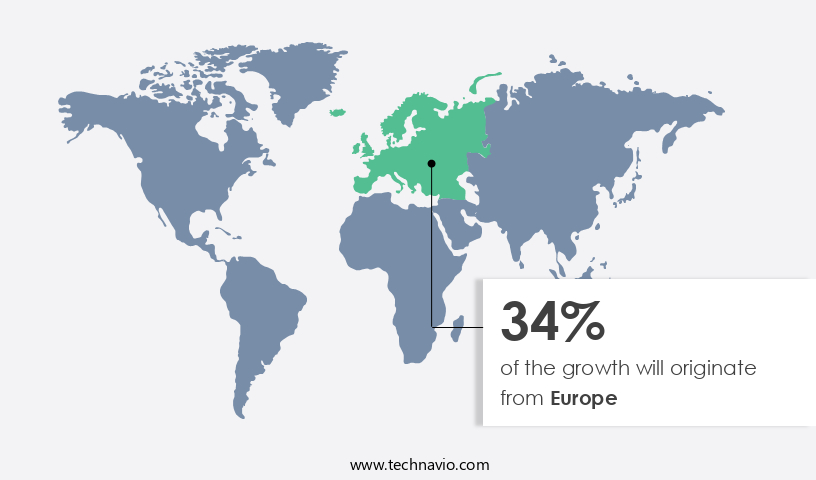
  • Key Growth Region: Europe(fastest-growing market with a 34%)

What will be the Size of the Commercial Beverage Dispensers Market during the forecast period?

Commercial Beverage Dispensers Market Size

 Request Free Sample

The commercial beverage dispenser market continues to evolve, with dynamic market activities shaping its landscape. From retail stores to food service establishments, these dispensers cater to various sectors, integrating diverse technologies such as IoT and refrigeration. Touchscreen dispensers, temperature control, and remote monitoring are transforming user experience, while energy efficiency and inventory management enhance operational efficiency. Ice dispensers, manual and automatic, and water filtration systems ensure high-quality beverages. Pos integration and cloud connectivity facilitate seamless data analytics, enabling businesses to optimize their offerings. Refrigerated and non-refrigerated dispensers, stainless steel and plastic, cater to diverse needs, with temperature control and flow rate optimization.

Coffee dispensers, juice dispensers, and hot beverage dispensers broaden the product range, while event catering benefits from large, floor-standing dispensers. Dispensing technology advances, with IoT integration and user interface improvements, creating smart dispensers for enhanced customer experience. In the food service industry, commercial kitchens rely on these dispensers for efficient and consistent beverage service, with ice makers and water dispensers ensuring optimal performance. The market's continuous unfolding reflects the industry's ongoing quest for innovation and improved customer satisfaction.

How is this Commercial Beverage Dispensers Industry segmented?

The commercial beverage dispensers industry research report provides comprehensive data (region-wise segment analysis), with forecasts and estimates in "USD million" for the period 2025-2029, as well as historical data from 2019-2023 for the following segments.

  • Product
    • Refrigerated
    • Uninsulated
    • Insulated
  • Material
    • Stainless steel
    • Glass and acrylic
    • Plastic
    • Others
  • Technology
    • Automatic
    • Semi-Automatic
    • Manual
  • Product Type
    • Hot
    • Cold
    • Fountain
    • Frozen
    • Soft Serve
  • Geography
    • North America
      • US
      • Canada
    • Europe
      • France
      • Germany
      • UK
    • APAC
      • Australia
      • China
      • India
      • South Korea
    • Rest of World (ROW)

By Product Insights

The refrigerated segment is estimated to witness significant growth during the forecast period.

Commercial beverage dispensers cater to various business sectors, including retail stores and food service industries, by providing chilled beverages for self-service. Refrigerated dispensers, such as juice dispensers and cold beverage dispensers, are popular choices due to their ability to maintain optimal temperatures for beverages like juice, iced tea, and slushies. Touchscreen dispensers and IoT technology enable remote monitoring and inventory management (robots), reducing labor needs and wastage. Vending machines and wall-mounted dispensers offer convenience, while temperature control ensures beverages are served at the right temperature. Energy efficiency and user-friendly features, such as push-button and automatic dispensers, are essential considerations. Beverage dispensers come in various materials, including stainless steel and plastic, and sizes, from countertop to floor-standing models.

Coffee dispensers and hot beverage dispensers cater to specific needs. Water filtration systems and ice makers are integral components for many dispensers. The market is driven by the growing preference for chilled beverages and the need for efficient, self-service options in the expanding food service industry. Cloud connectivity and data analytics enable real-time monitoring and insights, enhancing operational efficiency.

Commercial Beverage Dispensers Market Size

Request Free Sample

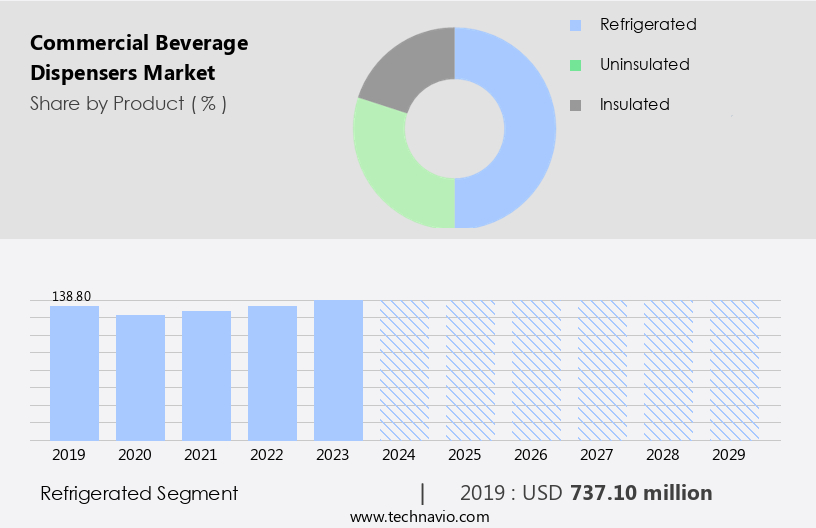
The Refrigerated segment was valued at USD 737.10 million in 2019 and showed a gradual increase during the forecast period.

Regional Analysis

Europe is estimated to contribute 34% to the growth of the global market during the forecast period. Technavio's analysts have elaborately explained the regional trends and drivers that shape the market during the forecast period.

Commercial Beverage Dispensers Market Share by Geography

 Request Free Sample

In Europe's dynamic beverage market, an assortment of low-calorie and flavored beverages cater to various consumer preferences. Commercial beverage dispensers, including cold beverage dispensers and juice dispensers, have gained traction due to their ability to offer multiple options. Coca Cola European Partners (CCEP) is among the companies leading this trend, collaborating with Lavit Group to install touchscreen dispensers that enable consumers to customize their beverages. IoT technology and cloud connectivity facilitate remote monitoring and inventory management, enhancing efficiency in food service. Temperature control is crucial for refrigerated dispensers, while energy efficiency is a priority for non-refrigerated dispensers.

Beverage dispensers come in various formats, such as countertop, wall-mounted, floor-standing, and stainless steel, catering to diverse commercial kitchen needs. Additionally, coffee dispensers, hot beverage dispensers, and tea dispensers cater to the growing demand for hot beverages. Dispensing technology, including automatic and manual dispensers, and user interfaces, further enrich the consumer experience. Plastic, glass, and stainless steel dispensers are available, with flow rates varying based on the application. Overall, the European beverage dispenser market reflects a fusion of innovation, technology, and consumer preferences.

Market Dynamics

Our researchers analyzed the data with 2024 as the base year, along with the key drivers, trends, and challenges. A holistic analysis of drivers will help companies refine their marketing strategies to gain a competitive advantage.

B2B beverage dispenser supply solutions leverage smart dispensing technologies for efficiency. Commercial beverage dispensers market growth opportunities 2025 include touchless beverage dispensers and eco-friendly dispenser solutions, meeting demand. Beverage dispenser supply chain software optimizes operations, while commercial beverage dispensers market competitive analysis highlights players like Cornelius and Bunn. Sustainable dispenser manufacturing aligns with eco-friendly foodservice trends. Beverage dispenser regulations 2024-2028 shape dispenser demand in North America 2025. Premium beverage dispenser solutions and commercial beverage dispensers market insights boost adoption. Dispensers for quick-service restaurants and customized beverage dispenser systems target niches. Commercial beverage dispensers market challenges and solutions address maintenance costs, with direct procurement strategies for dispensers and beverage dispenser pricing optimization enhancing profitability.

What are the key market drivers leading to the rise in the adoption of Commercial Beverage Dispensers Industry?

  • The increasing market penetration of companies supplying commercial beverage dispensers is the primary factor fueling market growth. 
  • The commercial beverage dispenser market is experiencing significant growth due to technological advancements and the increasing preference for online sales channels. Companies are expanding their distribution networks by selling their products online, allowing end-users and distributors to purchase beverage dispensers conveniently. This includes offerings such as push-button dispensers, juice dispensers, non-carbonated beverage dispensers, cold beverage dispensers, coffee dispensers, and bottled water dispensers. Companies are also partnering with e-commerce companies to strengthen their online presence and reach a larger customer base. Inventory management and cloud connectivity are essential features that are gaining popularity in the market. These features enable real-time data analytics, allowing businesses to optimize their inventory levels and reduce wastage.
  • Additionally, data analytics provides valuable insights into consumer behavior and preferences, enabling companies to tailor their offerings to meet market demands. Carbonated beverage dispensers and glass dispensers are also gaining traction due to their ability to offer a wider range of beverage options and enhance the overall customer experience. With the increasing demand for healthier beverage options, non-carbonated beverage dispensers are becoming increasingly popular. Overall, the market for commercial beverage dispensers is expected to continue growing as businesses seek to offer a wider range of beverage options to their customers while improving operational efficiency.

What are the market trends shaping the Commercial Beverage Dispensers Industry?

  • The focus of companies in the beverage industry is shifting towards developing commercial dispensers with enhanced connectivity options, reflecting a significant market trend. This technological advancement enables better monitoring, remote management, and data analysis, offering numerous benefits to businesses in terms of efficiency and customer satisfaction.
  • Commercial beverage dispensers are gaining popularity among food service establishments, theaters, amusement parks, and other businesses. Companies are responding to this trend by introducing innovative models that enhance the consumer experience. For example, The Coca-Cola Company introduced the Freestyle 9100 dispenser, which features a touchscreen interface and Bluetooth connectivity. This technology enables consumers to connect to the Freestyle mobile application and select their desired beverages without waiting in line. Additionally, energy efficiency, water filtration systems, ice dispensers, and ice makers are becoming essential features in commercial beverage dispensers.
  • Wall-mounted and water cooler models are also prevalent in the market. The integration of point-of-sale (POS) systems is another trend, allowing for streamlined ordering and payment processes. Overall, the focus on advanced dispensing technology and consumer convenience is driving the growth of the commercial beverage dispenser market.

What challenges does the Commercial Beverage Dispensers Industry face during its growth?

  • A low product replacement cycle poses a significant challenge to the industry, as it impedes growth by requiring frequent product introductions and innovations to maintain customer interest. 
  • Commercial beverage dispensers, including automatic soda and hot beverage dispensers, are long-lasting investments for businesses. The replacement cycle for these dispensers is typically low due to their robust build and minimal maintenance requirements. Hot beverage dispensers, such as those used in commercial kitchens, have a lifecycle ranging from 10 to 30 years. This longevity makes them a worthwhile investment, despite their initial cost. Smart and user-friendly dispensers, including plastic soda and tea dispensers, are also popular choices for businesses. These advanced models offer features like flow rate control and temperature settings, enhancing the user experience. Floor-standing dispensers are a common choice for larger establishments due to their capacity and space efficiency.
  • The market for commercial beverage dispensers continues to evolve, with new technologies and innovations emerging. Smart dispensers, for instance, can be integrated with various systems, such as inventory management software, to streamline operations. Despite these advancements, the fundamental need for reliable and durable beverage dispensers remains constant. The replacement cycle for commercial beverage dispensers is generally low due to their long lifecycle and minimal maintenance requirements. Hot and cold-water dispensers, including those for hot beverages and soda, are considered one-time investments that offer excellent value over the years. Smart and user-friendly dispensers are also gaining popularity, offering additional features and benefits to businesses.

Exclusive Customer Landscape

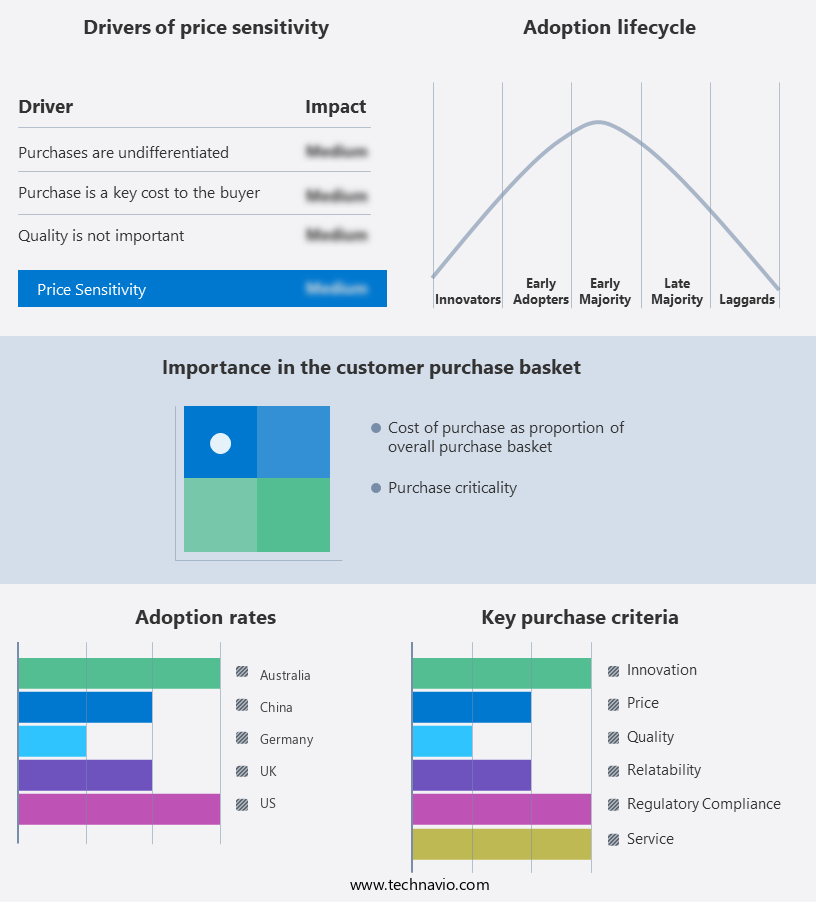
The commercial beverage dispensers market forecasting report includes the adoption lifecycle of the market, covering from the innovator's stage to the laggard's stage. It focuses on adoption rates in different regions based on penetration. Furthermore, the commercial beverage dispensers market report also includes key purchase criteria and drivers of price sensitivity to help companies evaluate and develop their market growth analysis strategies.

Commercial Beverage Dispensers Market Share by Geography

 Customer Landscape

Key Companies & Market Insights

Companies are implementing various strategies, such as strategic alliances, commercial beverage dispensers market forecast, partnerships, mergers and acquisitions, geographical expansion, and product/service launches, to enhance their presence in the industry.

Ali Group S.r.l. - The company specializes in the commercial production and distribution of innovative beverage dispensing solutions.

The industry research and growth report includes detailed analyses of the competitive landscape of the market and information about key companies, including:

  • Ali Group S.r.l.
  • Berkshire Hathaway Inc.
  • Bunn O Matic Corp.
  • Cal Mil Plastic Products Inc.
  • Cambro Manufacturing Co.
  • Changzhou Pilot Electronic Co. Ltd.
  • Electrolux Professional AB
  • FBD Partnership LP
  • FRANKE Holding AG
  • Godrej and Boyce Manufacturing Co. Ltd.
  • HOSHIZAKI Corp.
  • LUIGI LAVAZZA SpA
  • Manitowoc Ice
  • Nestle SA
  • Newco Coffee
  • Omega Juicers
  • PepsiCo Inc.
  • Rosseto Serving Solutions
  • The Coca Cola Co.
  • The Middleby Corp.

Qualitative and quantitative analysis of companies has been conducted to help clients understand the wider business environment as well as the strengths and weaknesses of key industry players. Data is qualitatively analyzed to categorize companies as pure play, category-focused, industry-focused, and diversified; it is quantitatively analyzed to categorize companies as dominant, leading, strong, tentative, and weak.

Recent Development and News in Commercial Beverage Dispensers Market

  • In February 2023, Hussmann Corporation, a leading provider of refrigeration solutions, announced the launch of its new line of beverage dispensers, the Hussmann Connect Series. These smart, connected dispensers offer real-time temperature monitoring and remote diagnostics, enhancing operational efficiency for foodservice and retail operators (Hussmann Corporation Press Release).
  • In May 2024, Coca-Cola European Partners (CCEP) and Nestle entered into a strategic partnership to develop and commercialize ready-to-drink coffee and tea solutions using CCEP's fountain dispensing technology. This collaboration aims to expand the reach of Nestle's Nescafe and Nespresso brands in the out-of-home market (Coca-Cola European Partners Press Release).
  • In October 2024, Manitowoc Foodservice, a leading manufacturer of commercial foodservice equipment, completed the acquisition of Kold-Draft, a leading provider of beverage dispensing systems. This acquisition strengthened Manitowoc's position in the beverage dispensing market and expanded its product portfolio (Manitowoc Foodservice Press Release).
  • In March 2025, the European Union approved new regulations on single-use plastics, including a ban on certain single-use plastic beverage containers. This policy change is expected to drive demand for reusable and refillable beverage dispensers, benefiting companies such as Coca-Cola European Partners and Manitowoc Foodservice that offer such solutions (European Commission Press Release).

Research Analyst Overview

  • The commercial beverage dispenser market is characterized by a growing focus on sustainability and energy efficiency. Sustainability certification and energy consumption monitoring are becoming essential factors in business decision-making. Compliance regulations, such as those related to water quality testing and hygiene standards, continue to shape market dynamics. Real-time monitoring and automated dispensing systems enable businesses to optimize their operations and reduce costs. Sustainable dispensers with energy-saving features, such as heating elements and preventive maintenance, are gaining popularity. Branding capabilities, digital displays, and customization options add value for customers. Installation services, remote control, and software solutions facilitate seamless integration into business operations.
  • Chilling systems, parts replacement, service contracts, accessibility features, and warranty programs ensure reliability and longevity. Water usage tracking and remote troubleshooting enhance operational efficiency and reduce downtime. Ice production and sanitation protocols further enhance the customer experience. Overall, the market for commercial beverage dispensers is dynamic, with a focus on innovation, sustainability, and regulatory compliance.

Dive into Technavio's robust research methodology, blending expert interviews, extensive data synthesis, and validated models for unparalleled Commercial Beverage Dispensers Market insights. See full methodology.

Market Scope

Report Coverage

Details

Page number

204

Base year

2024

Historic period

2019-2023

Forecast period

2025-2029

Growth momentum & CAGR

Accelerate at a CAGR of 5.1%

Market growth 2025-2029

USD 242.9 million

Market structure

Fragmented

YoY growth 2024-2025(%)

4.7

Key countries

US, China, UK, Canada, Germany, Australia, France, India, South Korea, and Saudi Arabia

Competitive landscape

Leading Companies, Market Positioning of Companies, Competitive Strategies, and Industry Risks

Request Free Sample

What are the Key Data Covered in this Commercial Beverage Dispensers Market Research and Growth Report?

  • CAGR of the Commercial Beverage Dispensers industry during the forecast period
  • Detailed information on factors that will drive the growth and forecasting between 2025 and 2029
  • Precise estimation of the size of the market and its contribution of the industry in focus to the parent market
  • Accurate predictions about upcoming growth and trends and changes in consumer behaviour
  • Growth of the market across Europe, APAC, North America, South America, and Middle East and Africa
  • Thorough analysis of the market's competitive landscape and detailed information about companies
  • Comprehensive analysis of factors that will challenge the commercial beverage dispensers market growth of industry companies

We can help! Our analysts can customize this commercial beverage dispensers market research report to meet your requirements.

Get in touch

1 Executive Summary

  • 1.1 Market overview
    • Executive Summary - Chart on Market Overview
    • Executive Summary - Data Table on Market Overview
    • Executive Summary - Chart on Global Market Characteristics
    • Executive Summary - Chart on Market by Geography
    • Executive Summary - Chart on Market Segmentation by Product
    • Executive Summary - Chart on Market Segmentation by Material
    • Executive Summary - Chart on Incremental Growth
    • Executive Summary - Data Table on Incremental Growth
    • Executive Summary - Chart on Company Market Positioning

2 Technavio Analysis

  • 2.1 Analysis of price sensitivity, lifecycle, customer purchase basket, adoption rates, and purchase criteria
    • Analysis of price sensitivity, lifecycle, customer purchase basket, adoption rates, and purchase criteria
  • 2.2 Criticality of inputs and Factors of differentiation
    • Overview on criticality of inputs and factors of differentiation
  • 2.3 Factors of disruption
    • Overview on factors of disruption
  • 2.4 Impact of drivers and challenges
    • Impact of drivers and challenges in 2024 and 2029

3 Market Landscape

  • 3.1 Market ecosystem
    • Parent Market
    • Data Table on - Parent Market
  • 3.2 Market characteristics
    • Market characteristics analysis
  • 3.3 Value chain analysis
    • Value chain analysis

4 Market Sizing

  • 4.1 Market definition
    • Offerings of companies included in the market definition
  • 4.2 Market segment analysis
    • Market segments
  • 4.3 Market size 2024
    • 4.4 Market outlook: Forecast for 2024-2029
      • Chart on Global - Market size and forecast 2024-2029 ($ million)
      • Data Table on Global - Market size and forecast 2024-2029 ($ million)
      • Chart on Global Market: Year-over-year growth 2024-2029 (%)
      • Data Table on Global Market: Year-over-year growth 2024-2029 (%)

    5 Historic Market Size

    • 5.1 Global Commercial Beverage Dispensers Market 2019 - 2023
      • Historic Market Size - Data Table on Global Commercial Beverage Dispensers Market 2019 - 2023 ($ million)
    • 5.2 Product segment analysis 2019 - 2023
      • Historic Market Size - Product Segment 2019 - 2023 ($ million)
    • 5.3 Material segment analysis 2019 - 2023
      • Historic Market Size - Material Segment 2019 - 2023 ($ million)
    • 5.4 Geography segment analysis 2019 - 2023
      • Historic Market Size - Geography Segment 2019 - 2023 ($ million)
    • 5.5 Country segment analysis 2019 - 2023
      • Historic Market Size - Country Segment 2019 - 2023 ($ million)

    6 Qualitative Analysis

    • 6.1 The AI impact on Global Commercial Beverage Dispensers Market

      7 Five Forces Analysis

      • 7.1 Five forces summary
        • Five forces analysis - Comparison between 2024 and 2029
      • 7.2 Bargaining power of buyers
        • Bargaining power of buyers - Impact of key factors 2024 and 2029
      • 7.3 Bargaining power of suppliers
        • Bargaining power of suppliers - Impact of key factors in 2024 and 2029
      • 7.4 Threat of new entrants
        • Threat of new entrants - Impact of key factors in 2024 and 2029
      • 7.5 Threat of substitutes
        • Threat of substitutes - Impact of key factors in 2024 and 2029
      • 7.6 Threat of rivalry
        • Threat of rivalry - Impact of key factors in 2024 and 2029
      • 7.7 Market condition
        • Chart on Market condition - Five forces 2024 and 2029

      8 Market Segmentation by Product

      • 8.1 Market segments
        • Chart on Product - Market share (2024-2029) (%)
        • Data Table on Product - Market share (2024-2029) (%)
      • 8.2 Comparison by Product
        • Chart on Comparison by Product
        • Data Table on Comparison by Product
      • 8.3 Refrigerated - Market size and forecast (2024-2029)
        • Chart on Refrigerated - Market size and forecast (2024-2029) ($ million)
        • Data Table on Refrigerated - Market size and forecast (2024-2029) ($ million)
        • Chart on Refrigerated - Year-over-year growth (2024-2029) (%)
        • Data Table on Refrigerated - Year-over-year growth (2024-2029) (%)
      • 8.4 Uninsulated - Market size and forecast (2024-2029)
        • Chart on Uninsulated - Market size and forecast (2024-2029) ($ million)
        • Data Table on Uninsulated - Market size and forecast (2024-2029) ($ million)
        • Chart on Uninsulated - Year-over-year growth (2024-2029) (%)
        • Data Table on Uninsulated - Year-over-year growth (2024-2029) (%)
      • 8.5 Insulated - Market size and forecast (2024-2029)
        • Chart on Insulated - Market size and forecast (2024-2029) ($ million)
        • Data Table on Insulated - Market size and forecast (2024-2029) ($ million)
        • Chart on Insulated - Year-over-year growth (2024-2029) (%)
        • Data Table on Insulated - Year-over-year growth (2024-2029) (%)
      • 8.6 Market opportunity by Product
        • Market opportunity by Product ($ million)
        • Data Table on Market opportunity by Product ($ million)

      9 Market Segmentation by Material

      • 9.1 Market segments
        • Chart on Material - Market share (2024-2029) (%)
        • Data Table on Material - Market share (2024-2029) (%)
      • 9.2 Comparison by Material
        • Chart on Comparison by Material
        • Data Table on Comparison by Material
      • 9.3 Stainless steel - Market size and forecast (2024-2029)
        • Chart on Stainless steel - Market size and forecast (2024-2029) ($ million)
        • Data Table on Stainless steel - Market size and forecast (2024-2029) ($ million)
        • Chart on Stainless steel - Year-over-year growth (2024-2029) (%)
        • Data Table on Stainless steel - Year-over-year growth (2024-2029) (%)
      • 9.4 Glass and acrylic - Market size and forecast (2024-2029)
        • Chart on Glass and acrylic - Market size and forecast (2024-2029) ($ million)
        • Data Table on Glass and acrylic - Market size and forecast (2024-2029) ($ million)
        • Chart on Glass and acrylic - Year-over-year growth (2024-2029) (%)
        • Data Table on Glass and acrylic - Year-over-year growth (2024-2029) (%)
      • 9.5 Plastic - Market size and forecast (2024-2029)
        • Chart on Plastic - Market size and forecast (2024-2029) ($ million)
        • Data Table on Plastic - Market size and forecast (2024-2029) ($ million)
        • Chart on Plastic - Year-over-year growth (2024-2029) (%)
        • Data Table on Plastic - Year-over-year growth (2024-2029) (%)
      • 9.6 Others - Market size and forecast (2024-2029)
        • Chart on Others - Market size and forecast (2024-2029) ($ million)
        • Data Table on Others - Market size and forecast (2024-2029) ($ million)
        • Chart on Others - Year-over-year growth (2024-2029) (%)
        • Data Table on Others - Year-over-year growth (2024-2029) (%)
      • 9.7 Market opportunity by Material
        • Market opportunity by Material ($ million)
        • Data Table on Market opportunity by Material ($ million)

      10 Market Segmentation by Technology

      • 10.1 Market segments
        • Chart on Technology - Market share (2024-2029) (%)
        • Data Table on Technology - Market share (2024-2029) (%)
      • 10.2 Comparison by Technology
        • Chart on Comparison by Technology
        • Data Table on Comparison by Technology
      • 10.3 Automatic - Market size and forecast (2024-2029)
        • Chart on Automatic - Market size and forecast (2024-2029) ($ million)
        • Data Table on Automatic - Market size and forecast (2024-2029) ($ million)
        • Chart on Automatic - Year-over-year growth (2024-2029) (%)
        • Data Table on Automatic - Year-over-year growth (2024-2029) (%)
      • 10.4 Semi-Automatic - Market size and forecast (2024-2029)
        • Chart on Semi-Automatic - Market size and forecast (2024-2029) ($ million)
        • Data Table on Semi-Automatic - Market size and forecast (2024-2029) ($ million)
        • Chart on Semi-Automatic - Year-over-year growth (2024-2029) (%)
        • Data Table on Semi-Automatic - Year-over-year growth (2024-2029) (%)
      • 10.5 Manual - Market size and forecast (2024-2029)
        • Chart on Manual - Market size and forecast (2024-2029) ($ million)
        • Data Table on Manual - Market size and forecast (2024-2029) ($ million)
        • Chart on Manual - Year-over-year growth (2024-2029) (%)
        • Data Table on Manual - Year-over-year growth (2024-2029) (%)
      • 10.6 Market opportunity by Technology
        • Market opportunity by Technology ($ million)
        • Data Table on Market opportunity by Technology ($ million)

      11 Market Segmentation by Product Type

      • 11.1 Market segments
        • Chart on Product Type - Market share (2024-2029) (%)
        • Data Table on Product Type - Market share (2024-2029) (%)
      • 11.2 Comparison by Product Type
        • Chart on Comparison by Product Type
        • Data Table on Comparison by Product Type
      • 11.3 Hot - Market size and forecast (2024-2029)
        • Chart on Hot - Market size and forecast (2024-2029) ($ million)
        • Data Table on Hot - Market size and forecast (2024-2029) ($ million)
        • Chart on Hot - Year-over-year growth (2024-2029) (%)
        • Data Table on Hot - Year-over-year growth (2024-2029) (%)
      • 11.4 Cold - Market size and forecast (2024-2029)
        • Chart on Cold - Market size and forecast (2024-2029) ($ million)
        • Data Table on Cold - Market size and forecast (2024-2029) ($ million)
        • Chart on Cold - Year-over-year growth (2024-2029) (%)
        • Data Table on Cold - Year-over-year growth (2024-2029) (%)
      • 11.5 Fountain - Market size and forecast (2024-2029)
        • Chart on Fountain - Market size and forecast (2024-2029) ($ million)
        • Data Table on Fountain - Market size and forecast (2024-2029) ($ million)
        • Chart on Fountain - Year-over-year growth (2024-2029) (%)
        • Data Table on Fountain - Year-over-year growth (2024-2029) (%)
      • 11.6 Frozen - Market size and forecast (2024-2029)
        • Chart on Frozen - Market size and forecast (2024-2029) ($ million)
        • Data Table on Frozen - Market size and forecast (2024-2029) ($ million)
        • Chart on Frozen - Year-over-year growth (2024-2029) (%)
        • Data Table on Frozen - Year-over-year growth (2024-2029) (%)
      • 11.7 Soft Serve - Market size and forecast (2024-2029)
        • Chart on Soft Serve - Market size and forecast (2024-2029) ($ million)
        • Data Table on Soft Serve - Market size and forecast (2024-2029) ($ million)
        • Chart on Soft Serve - Year-over-year growth (2024-2029) (%)
        • Data Table on Soft Serve - Year-over-year growth (2024-2029) (%)
      • 11.8 Market opportunity by Product Type
        • Market opportunity by Product Type ($ million)
        • Data Table on Market opportunity by Product Type ($ million)

      12 Customer Landscape

      • 12.1 Customer landscape overview
        • Analysis of price sensitivity, lifecycle, customer purchase basket, adoption rates, and purchase criteria

      13 Geographic Landscape

      • 13.1 Geographic segmentation
        • Chart on Market share by geography 2024-2029 (%)
        • Data Table on Market share by geography 2024-2029 (%)
      • 13.2 Geographic comparison
        • Chart on Geographic comparison
        • Data Table on Geographic comparison
      • 13.3 Europe - Market size and forecast 2024-2029
        • Chart on Europe - Market size and forecast 2024-2029 ($ million)
        • Data Table on Europe - Market size and forecast 2024-2029 ($ million)
        • Chart on Europe - Year-over-year growth 2024-2029 (%)
        • Data Table on Europe - Year-over-year growth 2024-2029 (%)
      • 13.4 APAC - Market size and forecast 2024-2029
        • Chart on APAC - Market size and forecast 2024-2029 ($ million)
        • Data Table on APAC - Market size and forecast 2024-2029 ($ million)
        • Chart on APAC - Year-over-year growth 2024-2029 (%)
        • Data Table on APAC - Year-over-year growth 2024-2029 (%)
      • 13.5 North America - Market size and forecast 2024-2029
        • Chart on North America - Market size and forecast 2024-2029 ($ million)
        • Data Table on North America - Market size and forecast 2024-2029 ($ million)
        • Chart on North America - Year-over-year growth 2024-2029 (%)
        • Data Table on North America - Year-over-year growth 2024-2029 (%)
      • 13.6 South America - Market size and forecast 2024-2029
        • Chart on South America - Market size and forecast 2024-2029 ($ million)
        • Data Table on South America - Market size and forecast 2024-2029 ($ million)
        • Chart on South America - Year-over-year growth 2024-2029 (%)
        • Data Table on South America - Year-over-year growth 2024-2029 (%)
      • 13.7 Middle East and Africa - Market size and forecast 2024-2029
        • Chart on Middle East and Africa - Market size and forecast 2024-2029 ($ million)
        • Data Table on Middle East and Africa - Market size and forecast 2024-2029 ($ million)
        • Chart on Middle East and Africa - Year-over-year growth 2024-2029 (%)
        • Data Table on Middle East and Africa - Year-over-year growth 2024-2029 (%)
      • 13.8 US - Market size and forecast 2024-2029
        • Chart on US - Market size and forecast 2024-2029 ($ million)
        • Data Table on US - Market size and forecast 2024-2029 ($ million)
        • Chart on US - Year-over-year growth 2024-2029 (%)
        • Data Table on US - Year-over-year growth 2024-2029 (%)
      • 13.9 China - Market size and forecast 2024-2029
        • Chart on China - Market size and forecast 2024-2029 ($ million)
        • Data Table on China - Market size and forecast 2024-2029 ($ million)
        • Chart on China - Year-over-year growth 2024-2029 (%)
        • Data Table on China - Year-over-year growth 2024-2029 (%)
      • 13.10 UK - Market size and forecast 2024-2029
        • Chart on UK - Market size and forecast 2024-2029 ($ million)
        • Data Table on UK - Market size and forecast 2024-2029 ($ million)
        • Chart on UK - Year-over-year growth 2024-2029 (%)
        • Data Table on UK - Year-over-year growth 2024-2029 (%)
      • 13.11 Canada - Market size and forecast 2024-2029
        • Chart on Canada - Market size and forecast 2024-2029 ($ million)
        • Data Table on Canada - Market size and forecast 2024-2029 ($ million)
        • Chart on Canada - Year-over-year growth 2024-2029 (%)
        • Data Table on Canada - Year-over-year growth 2024-2029 (%)
      • 13.12 Germany - Market size and forecast 2024-2029
        • Chart on Germany - Market size and forecast 2024-2029 ($ million)
        • Data Table on Germany - Market size and forecast 2024-2029 ($ million)
        • Chart on Germany - Year-over-year growth 2024-2029 (%)
        • Data Table on Germany - Year-over-year growth 2024-2029 (%)
      • 13.13 Australia - Market size and forecast 2024-2029
        • Chart on Australia - Market size and forecast 2024-2029 ($ million)
        • Data Table on Australia - Market size and forecast 2024-2029 ($ million)
        • Chart on Australia - Year-over-year growth 2024-2029 (%)
        • Data Table on Australia - Year-over-year growth 2024-2029 (%)
      • 13.14 France - Market size and forecast 2024-2029
        • Chart on France - Market size and forecast 2024-2029 ($ million)
        • Data Table on France - Market size and forecast 2024-2029 ($ million)
        • Chart on France - Year-over-year growth 2024-2029 (%)
        • Data Table on France - Year-over-year growth 2024-2029 (%)
      • 13.15 India - Market size and forecast 2024-2029
        • Chart on India - Market size and forecast 2024-2029 ($ million)
        • Data Table on India - Market size and forecast 2024-2029 ($ million)
        • Chart on India - Year-over-year growth 2024-2029 (%)
        • Data Table on India - Year-over-year growth 2024-2029 (%)
      • 13.16 South Korea - Market size and forecast 2024-2029
        • Chart on South Korea - Market size and forecast 2024-2029 ($ million)
        • Data Table on South Korea - Market size and forecast 2024-2029 ($ million)
        • Chart on South Korea - Year-over-year growth 2024-2029 (%)
        • Data Table on South Korea - Year-over-year growth 2024-2029 (%)
      • 13.17 Saudi Arabia - Market size and forecast 2024-2029
        • Chart on Saudi Arabia - Market size and forecast 2024-2029 ($ million)
        • Data Table on Saudi Arabia - Market size and forecast 2024-2029 ($ million)
        • Chart on Saudi Arabia - Year-over-year growth 2024-2029 (%)
        • Data Table on Saudi Arabia - Year-over-year growth 2024-2029 (%)
      • 13.18 Market opportunity by geography
        • Market opportunity by geography ($ million)
        • Data Tables on Market opportunity by geography ($ million)
      • 13.19 Rest of World (ROW) - Market size and forecast (2024-2029)
        • Chart on Rest of World (ROW) - Market size and forecast (2024-2029) ($ million)
        • Data Table on Rest of World (ROW) - Market size and forecast (2024-2029) ($ million)
        • Chart on Rest of World (ROW) - Year-over-year growth (2024-2029) (%)
        • Data Table on Rest of World (ROW) - Year-over-year growth (2024-2029) (%)

      14 Drivers, Challenges, and Opportunity/Restraints

      • 14.1 Market drivers
        • 14.2 Market challenges
          • 14.3 Impact of drivers and challenges
            • Impact of drivers and challenges in 2024 and 2029
          • 14.4 Market opportunities/restraints

            15 Competitive Landscape

            • 15.1 Overview
              • 15.2 Competitive Landscape
                • Overview on criticality of inputs and factors of differentiation
              • 15.3 Landscape disruption
                • Overview on factors of disruption
              • 15.4 Industry risks
                • Impact of key risks on business

              16 Competitive Analysis

              • 16.1 Companies profiled
                • Companies covered
              • 16.2 Company ranking index
                • Company ranking index
              • 16.3 Market positioning of companies
                • Matrix on companies position and classification
              • 16.4 Ali Group S.r.l.
                • Ali Group S.r.l. - Overview
                • Ali Group S.r.l. - Product / Service
                • Ali Group S.r.l. - Key offerings
                • SWOT
              • 16.5 Berkshire Hathaway Inc.
                • Berkshire Hathaway Inc. - Overview
                • Berkshire Hathaway Inc. - Business segments
                • Berkshire Hathaway Inc. - Key news
                • Berkshire Hathaway Inc. - Key offerings
                • Berkshire Hathaway Inc. - Segment focus
                • SWOT
              • 16.6 Bunn O Matic Corp.
                • Bunn O Matic Corp. - Overview
                • Bunn O Matic Corp. - Product / Service
                • Bunn O Matic Corp. - Key offerings
                • SWOT
              • 16.7 Cambro Manufacturing Co.
                • Cambro Manufacturing Co. - Overview
                • Cambro Manufacturing Co. - Product / Service
                • Cambro Manufacturing Co. - Key offerings
                • SWOT
              • 16.8 Changzhou Pilot Electronic Co. Ltd.
                • Changzhou Pilot Electronic Co. Ltd. - Overview
                • Changzhou Pilot Electronic Co. Ltd. - Product / Service
                • Changzhou Pilot Electronic Co. Ltd. - Key offerings
                • SWOT
              • 16.9 Electrolux Professional AB
                • Electrolux Professional AB - Overview
                • Electrolux Professional AB - Business segments
                • Electrolux Professional AB - Key news
                • Electrolux Professional AB - Key offerings
                • Electrolux Professional AB - Segment focus
                • SWOT
              • 16.10 FBD Partnership LP
                • FBD Partnership LP - Overview
                • FBD Partnership LP - Product / Service
                • FBD Partnership LP - Key offerings
                • SWOT
              • 16.11 FRANKE Holding AG
                • FRANKE Holding AG - Overview
                • FRANKE Holding AG - Product / Service
                • FRANKE Holding AG - Key news
                • FRANKE Holding AG - Key offerings
                • SWOT
              • 16.12 Godrej and Boyce Manufacturing Co. Ltd.
                • Godrej and Boyce Manufacturing Co. Ltd. - Overview
                • Godrej and Boyce Manufacturing Co. Ltd. - Product / Service
                • Godrej and Boyce Manufacturing Co. Ltd. - Key offerings
                • SWOT
              • 16.13 HOSHIZAKI Corp.
                • HOSHIZAKI Corp. - Overview
                • HOSHIZAKI Corp. - Business segments
                • HOSHIZAKI Corp. - Key offerings
                • HOSHIZAKI Corp. - Segment focus
                • SWOT
              • 16.14 Manitowoc Ice
                • Manitowoc Ice - Overview
                • Manitowoc Ice - Product / Service
                • Manitowoc Ice - Key offerings
                • SWOT
              • 16.15 Newco Coffee
                • Newco Coffee - Overview
                • Newco Coffee - Product / Service
                • Newco Coffee - Key offerings
                • SWOT
              • 16.16 Rosseto Serving Solutions
                • Rosseto Serving Solutions - Overview
                • Rosseto Serving Solutions - Product / Service
                • Rosseto Serving Solutions - Key offerings
                • SWOT
              • 16.17 The Coca Cola Co.
                • The Coca Cola Co. - Overview
                • The Coca Cola Co. - Business segments
                • The Coca Cola Co. - Key news
                • The Coca Cola Co. - Key offerings
                • The Coca Cola Co. - Segment focus
                • SWOT
              • 16.18 The Middleby Corp.
                • The Middleby Corp. - Overview
                • The Middleby Corp. - Business segments
                • The Middleby Corp. - Key news
                • The Middleby Corp. - Key offerings
                • The Middleby Corp. - Segment focus
                • SWOT

              17 Appendix

              • 17.1 Scope of the report
                • 17.2 Inclusions and exclusions checklist
                  • Inclusions checklist
                  • Exclusions checklist
                • 17.3 Currency conversion rates for US$
                  • Currency conversion rates for US$
                • 17.4 Research methodology
                  • Research methodology
                • 17.5 Data procurement
                  • Information sources
                • 17.6 Data validation
                  • Data validation
                • 17.7 Validation techniques employed for market sizing
                  • Validation techniques employed for market sizing
                • 17.8 Data synthesis
                  • Data synthesis
                • 17.9 360 degree market analysis
                  • 360 degree market analysis
                • 17.10 List of abbreviations
                  • List of abbreviations

                Research Methodology

                Technavio presents a detailed picture of the market by way of study, synthesis, and summation of data from multiple sources. The analysts have presented the various facets of the market with a particular focus on identifying the key industry influencers. The data thus presented is comprehensive, reliable, and the result of extensive research, both primary and secondary.

                INFORMATION SOURCES

                Primary sources

                • Manufacturers and suppliers
                • Channel partners
                • Industry experts
                • Strategic decision makers

                Secondary sources

                • Industry journals and periodicals
                • Government data
                • Financial reports of key industry players
                • Historical data
                • Press releases

                DATA ANALYSIS

                Data Synthesis

                • Collation of data
                • Estimation of key figures
                • Analysis of derived insights

                Data Validation

                • Triangulation with data models
                • Reference against proprietary databases
                • Corroboration with industry experts

                REPORT WRITING

                Qualitative

                • Market drivers
                • Market challenges
                • Market trends
                • Five forces analysis

                Quantitative

                • Market size and forecast
                • Market segmentation
                • Geographical insights
                • Competitive landscape

                Interested in this report?

                Get your sample now to see our research methodology and insights!

                Download Now

                Frequently Asked Questions

                Commercial Beverage Dispensers market growth will increase by $ 242.9 mn during 2025-2029.

                The Commercial Beverage Dispensers market is expected to grow at a CAGR of 5.1% during 2025-2029.

                Commercial Beverage Dispensers market is segmented by Product( Refrigerated, Uninsulated, Insulated) Material( Stainless steel, Glass and acrylic, Plastic, Others)

                Ali Group S.r.l., Berkshire Hathaway Inc., Bunn O Matic Corp., Cal Mil Plastic Products Inc., Cambro Manufacturing Co., Changzhou Pilot Electronic Co. Ltd., Electrolux Professional AB, FBD Partnership LP, FRANKE Holding AG, Godrej and Boyce Manufacturing Co. Ltd., HOSHIZAKI Corp., LUIGI LAVAZZA SpA, Manitowoc Ice, Nestle SA, Newco Coffee, Omega Juicers, PepsiCo Inc., Rosseto Serving Solutions, The Coca Cola Co., The Middleby Corp. are a few of the key vendors in the Commercial Beverage Dispensers market.

                Europe will register the highest growth rate of 34% among the other regions. Therefore, the Commercial Beverage Dispensers market in Europe is expected to garner significant business opportunities for the vendors during the forecast period.

                US, China, UK, Canada, Germany, Australia, France, India, South Korea, Saudi Arabia

                • Growing online presence of vendors that offer commercial beverage dispensersThe advent of technology and the growing penetration of the Internet have necessitated the online presence of vendors that offer commercial beverage dispensers. Vendors are also focusing on expanding their distribution networks in digital channels. For instance is the driving factor this market.
                • Electrolux offers a range of commercial beverage dispensers through its own website is the driving factor this market.
                • which includes Beverage dispenser 560024 (B) and Juice dispenser 560029 (B). The company also provides the option of online shopping to various stakeholders is the driving factor this market.
                • such as end-users and distributors. The availability of products online saves time for distributors and end-users as it eliminates the need for shopping through offline distribution channels.Vendors that offer commercial beverage dispensers are entering into strategic partnerships with e-commerce companies to strengthen their online presence. Some e-commerce platforms that offer commercial beverage dispensers include TheRDStore.com (TheRDStore) is the driving factor this market.
                • Kitchenall LLC (Kitchenall) is the driving factor this market.
                • and Kegerator.com (Kegerator) is the driving factor this market.
                • which is a part of the LivingDirect and Build.com networks. Several brands of vendors of commercial beverage dispensers is the driving factor this market.
                • such as Cronelius Inc. is the driving factor this market.
                • Bunn-O-Matic Corporation is the driving factor this market.
                • Electrolux AB is the driving factor this market.
                • and Lancer Worldwide is the driving factor this market.
                • are sold through e-commerce platforms. Market vendors also offer secure online purchase options and significant discounts on commercial beverage dispensers. Factors such as the ease of shopping is the driving factor this market.
                • significant discounts is the driving factor this market.
                • and good payment and return policies available on online retail channels encourage consumers to buy commercial beverage dispensers online. E-commerce vendors allow consumers to compare and collect information about commercial beverage dispensers from various brands and offer them a platform to provide feedback on commercial beverage dispensers through reviews and ratings. Although offline distribution channels remain the key sales channels for commercial beverage dispensers is the driving factor this market.
                • online distribution channels are expected to witness rapid growth during the forecast period. Competitively priced offerings and quick delivery services are the major factors driving the growth of the global commercial beverage dispensers market. Thus is the driving factor this market.
                • the growing online presence of vendors that offer commercial beverage dispensers will drive the market during the forecast period. is the driving factor this market.

                The Commercial Beverage Dispensers market vendors should focus on grabbing business opportunities from the Refrigerated segment as it accounted for the largest market share in the base year.