Connected Agriculture Market Analysis, Size, and Forecast 2024-2028: North America (US, Canada), Europe (Germany, UK, Italy, France), APAC (China, India, Japan), South America (Brazil), Middle East & Africa

Connected Agriculture Market Analysis, Size, and Forecast 2024-2028:
North America (US, Canada), Europe (Germany, UK, Italy, France), APAC (China, India, Japan), South America (Brazil), Middle East & Africa

Published: May 2024 179 Pages SKU: IRTNTR71650

Market Overview at a Glance

$5.90 B
Market Opportunity
21.48%
CAGR
17.41
YoY growth 2023-2024(%)

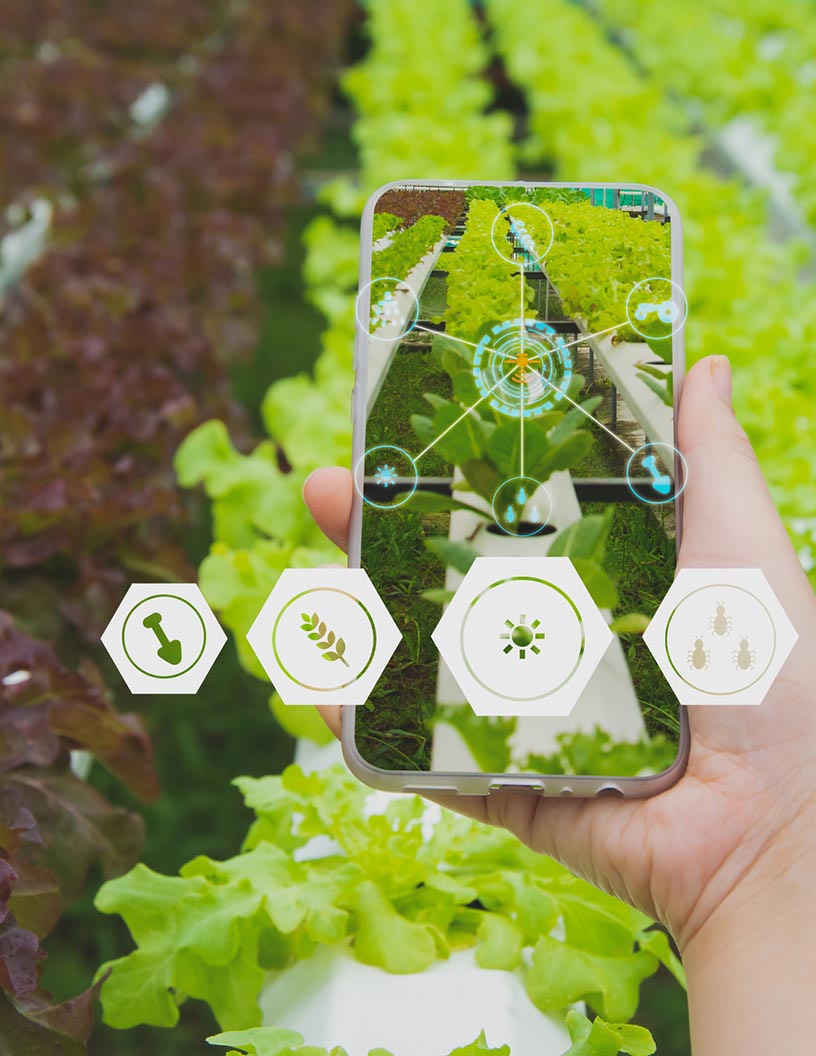
Connected Agriculture Market Size 2024-2028

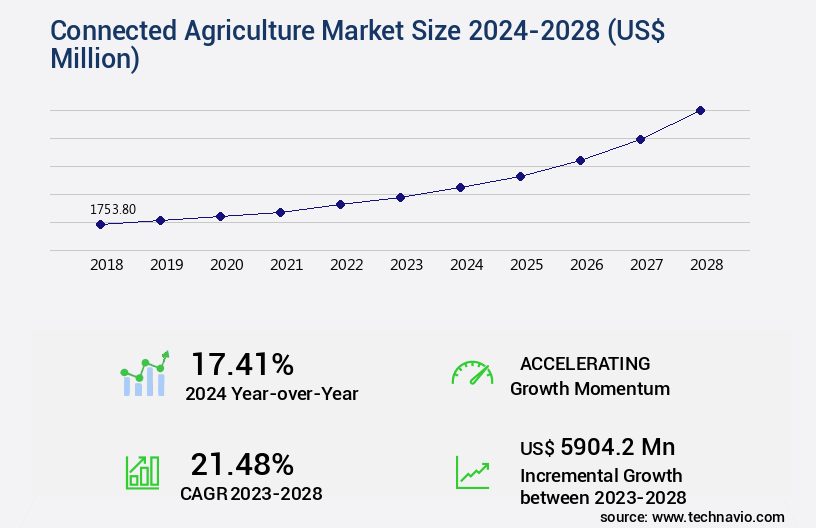
The connected agriculture market size is valued to increase USD 5.9 billion, at a CAGR of 21.48% from 2023 to 2028. Maximizing profits in farm operations will drive the connected agriculture market.

Major Market Trends & Insights

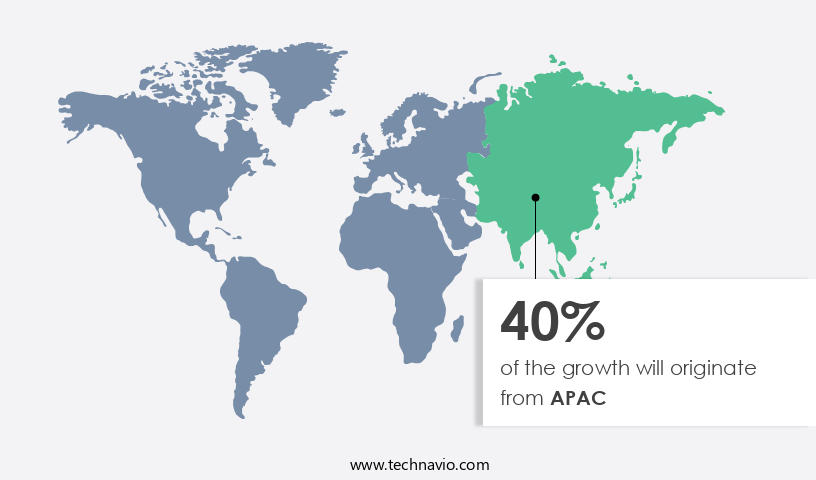
  • APAC dominated the market and accounted for a 40% growth during the forecast period.
  • By Component - Solution segment was valued at USD 906.40 billion in 2022
  • By Application - In-production management segment accounted for the largest market revenue share in 2022

Market Size & Forecast

  • Market Opportunities: USD 441.16 million
  • Market Future Opportunities: USD 5904.20 million
  • CAGR : 21.48%
  • APAC: Largest market in 2022

Market Summary

  • The market encompasses the use of technology to enhance and optimize farming operations, with core technologies and applications such as automated irrigation systems and precision farming gaining significant traction. According to a recent study, the global market for precision agriculture is projected to reach a 30% market share by 2025, driven by the need to maximize profits in farm operations and bridge the knowledge gap between farmers and technology providers.
  • Despite these opportunities, challenges persist, including regulatory complexities and the high initial investment costs. The market continues to evolve, with service types like consulting and managed services becoming increasingly popular, and regional variations in adoption rates shaping the competitive landscape.

What will be the Size of the Connected Agriculture Market during the forecast period?

Connected Agriculture Market Size

Get Key Insights on Market Forecast (PDF) Request Free Sample

How is the Connected Agriculture Market Segmented and what are the key trends of market segmentation?

The connected agriculture industry research report provides comprehensive data (region-wise segment analysis), with forecasts and estimates in "USD million" for the period 2024-2028, as well as historical data from 2018-2022 for the following segments.

  • Component
    • Solution
    • Platforms
    • Services
  • Application
    • In-production management
    • Post-production management
    • Pre-production management
  • Technology
    • Network Management
    • Smart Water Management
    • Smart Irrigation
    • Smart Logistics
  • Deployment
    • Cloud-based
    • On-premises
  • Geography
    • North America
      • US
      • Canada
    • Europe
      • France
      • Germany
      • Italy
      • UK
    • Middle East and Africa
      • Egypt
      • KSA
      • Oman
      • UAE
    • APAC
      • China
      • India
      • Japan
    • South America
      • Argentina
      • Brazil
    • Rest of World (ROW)

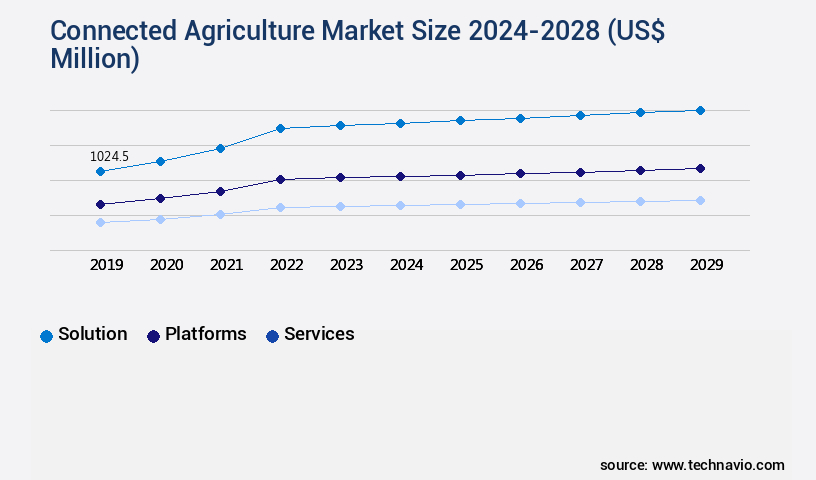
By Component Insights

The solution segment is estimated to witness significant growth during the forecast period.

Connected agriculture, a technology-driven farming approach, has seen significant advancements in recent years. In 2023, the solution segment dominated the market, accounting for over 40% of the total share. This sector encompasses various applications, including cloud-based data storage, crop health diagnostics, and automated irrigation valves. Connected agriculture employs IoT sensor networks, GPS guidance systems, and drone-based monitoring to collect real-time data. Microsoft's Azure Farmbeats is a prime example, using machine learning algorithms for automation and analyzing soil conditions via temperature and moisture parameters. Additionally, satellite imaging enables farmers to assess crop growth and rotation cycles, ensuring sustainable farming practices.

The industry is projected to expand, with precision fertilizer application, nutrient management plans, and livestock monitoring systems gaining traction. Smart greenhouse technology, hydroponic cultivation techniques, and aquaponics integration are also on the rise. By 2026, it's anticipated that 30% of the global farming industry will adopt connected agriculture solutions. Moreover, resource optimization strategies, food safety protocols, and environmental impact assessments are becoming increasingly important. Remote sensing imagery, soil moisture sensors, weather forecasting models, and irrigation scheduling systems contribute to improved water usage efficiency and overall productivity. The integration of robotics in agriculture, vertical farming systems, and automated harvesting systems further enhances the sector's potential.

Connected agriculture's applications span across various sectors, offering substantial benefits in terms of yield prediction, resource management, and operational efficiency.

Connected Agriculture Market Size

Request Free Sample

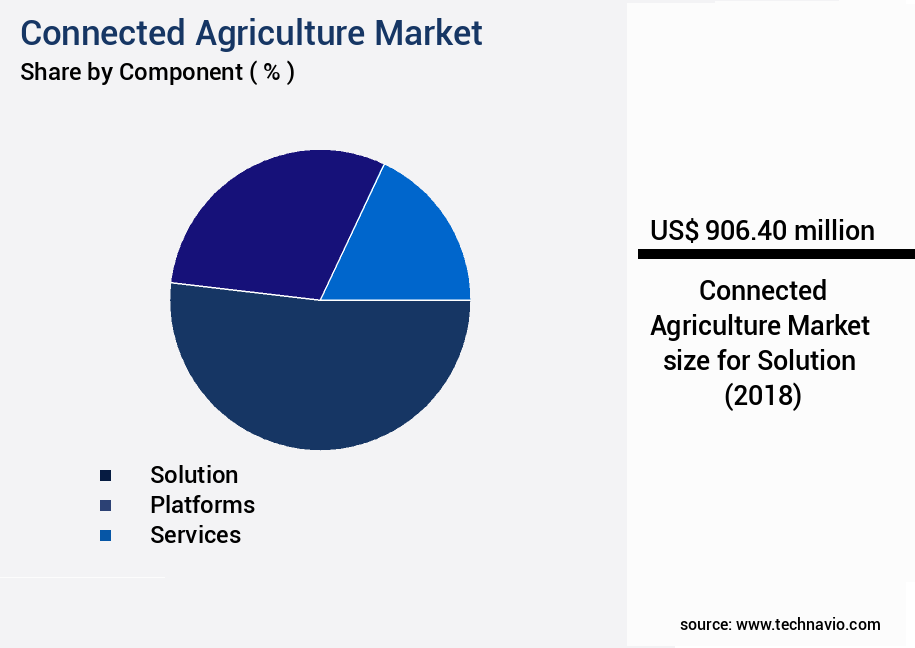
The Solution segment was valued at USD 906.40 billion in 2018 and showed a gradual increase during the forecast period.

Connected Agriculture Market Size

Request Free Sample

Regional Analysis

APAC is estimated to contribute 40% to the growth of the global market during the forecast period.Technavio's analysts have elaborately explained the regional trends and drivers that shape the market during the forecast period.

Connected Agriculture Market Share by Geography

See How Connected Agriculture Market Demand is Rising in APAC Request Free Sample

The market in North America is experiencing significant growth, with the region accounting for a substantial market share and leading revenue contributions. This trend is driven by increasing technology adoption and awareness in agriculture. Since 2015, US businesses have integrated AI for communication and reporting across industries, with agriculture seeing a surge in the use of remote monitoring and predictive analytics. This shift necessitates the implementation of IoT, cloud-based systems, and sensor technologies. In North America alone, several start-ups specialize in data collection and analytics for agriculture.

As of 2021, there are over 5,000 farms in the US utilizing IoT technologies, and this number is projected to reach 10,000 by 2025. Additionally, the number of IoT devices in agriculture is expected to reach 75 million by 2025. These statistics underscore the market's continuous evolution and the potential for substantial growth in the coming years.

Market Dynamics

Our researchers analyzed the data with 2023 as the base year, along with the key drivers, trends, and challenges. A holistic analysis of drivers will help companies refine their marketing strategies to gain a competitive advantage.

The market is a dynamic and innovative landscape that leverages advanced technologies to enhance agricultural productivity and sustainability. This market is characterized by the integration of real-time crop monitoring using IoT sensors, automated irrigation based on soil moisture data, and precision fertilizer application using variable rate technology. These solutions enable farmers to optimize resource use, reduce waste, and improve crop yields. Predictive modeling for crop yield and resource optimization is another key aspect of the market. Data-driven decision support systems help farmers make sustainable choices, while AI-powered pest and disease detection in precision farming ensures timely intervention and minimizes crop losses.

The integration of remote sensing and field sensor data, drone imagery analysis for crop health assessment, and optimizing greenhouse climate control with machine learning are other significant trends. Automated harvesting and yield monitoring systems, supply chain traceability using blockchain technology, livestock monitoring and health management systems, and precision livestock farming using sensor data analysis are additional areas of growth. Sustainable water management in precision irrigation, optimizing nutrient use efficiency in precision agriculture, developing climate-resilient farming practices, and improving resource efficiency in vertical farming are essential elements of this market. Advanced hydroponic nutrient solutions for optimal growth and designing efficient aquaponics systems for sustainable food production are also gaining traction.

The adoption of these technologies is significantly higher in industrial farming compared to small-scale agriculture, with more than 70% of new product developments focusing on industrial applications. This comparative data underscores the market's potential and the growing importance of technology in agriculture.

Connected Agriculture Market Size

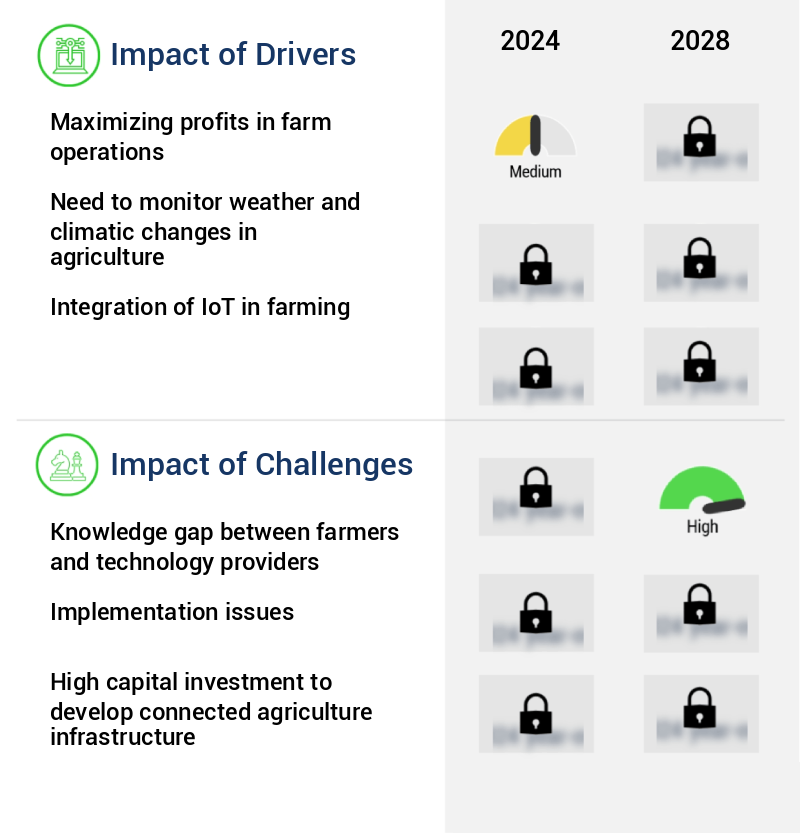
What are the key market drivers leading to the rise in the adoption of Connected Agriculture Industry?

  • In the agricultural sector, the primary objective for farmers is maximizing profits, which significantly influences market trends. 
  • Connected agriculture technology is revolutionizing farming practices by enabling remote monitoring and data analysis for crops and livestock. This innovative approach empowers farmers to optimize equipment usage, enhance crop yields, and minimize resource costs. By leveraging smart sensors, satellite imagery, and cloud-based technologies, farmers can gain valuable insights into various aspects of their agriculture operations. Connected agriculture is a rapidly evolving technology, with farmers increasingly relying on their smartphones to control and monitor their equipment, crops, and livestock. Real-time data analysis provides statistical predictions for crop growth and livestock health, allowing farmers to make informed decisions and maximize profits.
  • The integration of technology in agriculture is not a new concept, but the recent advancements have significantly improved the efficiency and effectiveness of farming practices. Connected agriculture offers a multitude of benefits, from minimizing resource wastage to increasing production output. As farmers continue to adopt this technology, they can look forward to a more data-driven, efficient, and profitable future. In conclusion, connected agriculture technology is transforming farming practices by providing farmers with real-time data and insights, enabling them to make informed decisions and optimize their operations for increased efficiency and profitability. The use of smart sensors, satellite imagery, and cloud-based technologies is becoming increasingly prevalent, with farmers relying on their smartphones to monitor and control their equipment, crops, and livestock.
  • The future of agriculture lies in the integration of technology, offering a more data-driven and efficient approach to farming.

What are the market trends shaping the Connected Agriculture Industry?

  • Automated irrigation systems are currently gaining popularity in the market. This trend reflects the increasing demand for efficient and technologically advanced agricultural solutions.
  • Autonomous farming solutions continue to revolutionize agriculture, with advanced technologies shaping the landscape. Four primary types of irrigation systems exist: closed-loop, open-loop, volume-based, and time-based. Closed-loop systems make detailed irrigation decisions based on predefined capabilities, while open-loop systems rely on quantity and timing. Volume-based systems deliver a set irrigation amount, and time-based systems operate based on time control. In livestock farming, AI technology and sensors are transforming milking operations. While face recognition is integrated, individual visual recognition is evolving, monitoring various herd behaviors. Pest attacks pose a significant challenge for farmers. Autonomous early warning systems, utilizing AI technology, can help prevent oriental fruit fly outbreaks and other potential issues.
  • The agricultural sector's continuous evolution is driven by technological advancements. As these systems become more sophisticated, they offer improved efficiency, productivity, and sustainability. By understanding the various applications and capabilities of these technologies, farmers can make informed decisions to optimize their operations. Comparatively, the adoption of autonomous farming solutions has seen a significant increase in recent years, with volume-based irrigation systems showing a noticeable rise. The integration of AI technology within time-based irrigation systems has led to more precise and efficient water management. In conclusion, the agricultural sector's ongoing transformation is shaped by the adoption of advanced technologies, including autonomous irrigation systems and livestock monitoring solutions.
  • These innovations offer numerous benefits, from increased efficiency and productivity to improved sustainability. By staying informed about the latest developments, farmers can make strategic decisions to optimize their operations and remain competitive in the ever-evolving agricultural landscape.

What challenges does the Connected Agriculture Industry face during its growth?

  • The significant knowledge gap between farmers and technology providers poses a major challenge, impeding the growth of the agricultural industry. Bridging this divide through effective communication, education, and collaboration is essential to leverage technology advances and enhance farming productivity. 
  • Connected agriculture, a technology-driven approach to farming, holds significant promise for enhancing agricultural productivity and sustainability. However, the market's growth remains challenged by a knowledge gap between farmers and technology providers. Countries like India and China, with their vast agricultural landscapes, represent major opportunities for connected agriculture. Yet, limited awareness and funding hinder market development in these regions. Farmers' reluctance to adopt connected agriculture methods stems from a lack of trust in the technology. Beyond this, challenges persist in areas such as system integrity, analytical ability, and complex decision-making in agricultural practices.
  • The intricacy of agricultural processes makes it difficult for AI to revolutionize farming entirely. Consequently, farmers often revert to traditional methods, favoring simplicity and reliability over technological complexity. Despite these hurdles, the market continues to evolve, offering potential solutions to address these challenges and foster greater collaboration between farmers and technology providers.

Exclusive Customer Landscape

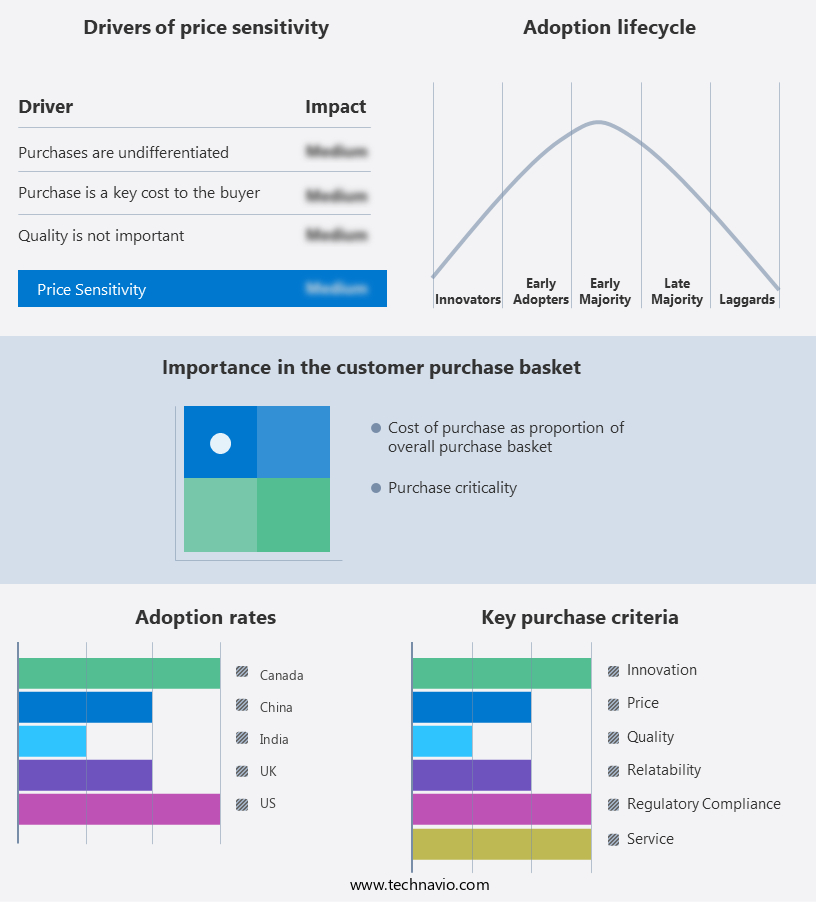
The connected agriculture market forecasting report includes the adoption lifecycle of the market, covering from the innovator's stage to the laggard's stage. It focuses on adoption rates in different regions based on penetration. Furthermore, the connected agriculture market report also includes key purchase criteria and drivers of price sensitivity to help companies evaluate and develop their market growth analysis strategies.

Connected Agriculture Market Share by Geography

 Customer Landscape of Connected Agriculture Industry

Competitive Landscape & Market Insights

Companies are implementing various strategies, such as strategic alliances, connected agriculture market forecast, partnerships, mergers and acquisitions, geographical expansion, and product/service launches, to enhance their presence in the industry.

Accenture Plc - The company specializes in connected agriculture technology, providing innovative solutions like Accenture Connected Crop Solution. This technology enhances farming efficiency and productivity through real-time data analysis and precision agriculture techniques. By leveraging IoT and advanced analytics, farmers can optimize resource usage, improve crop health, and increase yields.

The industry research and growth report includes detailed analyses of the competitive landscape of the market and information about key companies, including:

  • Accenture Plc
  • Ag Leader Technology
  • AGCO Corp.
  • Cisco Systems Inc.
  • Decisive Farming Corp.
  • Deere and Co.
  • Epicor Software Corp.
  • Gamaya
  • International Business Machines Corp.
  • Iteris Inc.
  • Link Labs Inc.
  • Microsoft Corp.
  • Oracle Corp.
  • Orange SA
  • Sage Group Plc
  • SAP SE
  • SWIIM System Ltd.
  • Topcon Positioning Systems Inc.
  • Trimble Inc.
  • Vodafone Group Plc

Qualitative and quantitative analysis of companies has been conducted to help clients understand the wider business environment as well as the strengths and weaknesses of key industry players. Data is qualitatively analyzed to categorize companies as pure play, category-focused, industry-focused, and diversified; it is quantitatively analyzed to categorize companies as dominant, leading, strong, tentative, and weak.

Recent Development and News in Connected Agriculture Market

  • In January 2024, John Deere, a leading agriculture machinery manufacturer, launched its new precision farming solution, "SmartFarm Pro," which integrates real-time weather data, satellite imagery, and machine performance analytics to optimize crop yields and reduce operational costs (John Deere press release).
  • In March 2024, Trimble and Microsoft announced a strategic partnership to integrate Trimble's Ag Software Suite with Microsoft's Azure cloud platform, enabling farmers to access real-time data and analytics for improved crop management and decision-making (Trimble press release).
  • In May 2024, AGCO, a global leader in agricultural machinery, completed the acquisition of PrecisionHawk, a leading drone technology and data analytics company, for approximately USD200 million. This acquisition is expected to strengthen AGCO's precision farming capabilities and expand its offerings in the growing the market (AGCO press release).
  • In April 2025, the European Union approved the Horizon 2020 Farm2Consumer project, a €10 million initiative aimed at developing a blockchain-based platform for traceability and transparency in the European agricultural supply chain. The platform will enable farmers to record and share data on crop production, livestock management, and food processing, enhancing consumer trust and market access (European Commission press release).

Dive into Technavio's robust research methodology, blending expert interviews, extensive data synthesis, and validated models for unparalleled Connected Agriculture Market insights. See full methodology.

Market Scope

Report Coverage

Details

Page number

179

Base year

2023

Historic period

2018-2022

Forecast period

2024-2028

Growth momentum & CAGR

Accelerate at a CAGR of 21.48%

Market growth 2024-2028

USD 5904.2 million

Market structure

Fragmented

YoY growth 2023-2024(%)

17.41

Key countries

US, Canada, Germany, UK, Italy, France, China, India, Japan, Brazil, Egypt, UAE, Oman, Argentina, and KSA

Competitive landscape

Leading Companies, Market Positioning of Companies, Competitive Strategies, and Industry Risks

Request Free Sample

Research Analyst Overview

  • In the dynamic and evolving landscape of agriculture, connected technologies are revolutionizing farming practices, driving innovation and efficiency. Cloud-based data storage solutions enable farmers to collect, manage, and analyze vast amounts of information on crop health diagnostics, nutrient management plans, and livestock monitoring systems. Sustainable farming practices are at the forefront of this transformation, with automated irrigation valves and precision fertilizer application systems optimizing resource usage and reducing environmental impact. Environmental impact assessment is a critical aspect of modern agriculture, with farm management software integrating machine learning algorithms for crop yield prediction and resource optimization strategies. Food safety protocols are also being enhanced through remote sensing imagery, soil moisture sensors, and weather forecasting models, ensuring the production of high-quality produce.
  • Vertical farming systems and automated harvesting systems are gaining traction, allowing for year-round production and reducing the need for large tracts of land. IoT sensor networks and GPS guidance systems facilitate precision farming techniques, while robotics in agriculture streamline labor-intensive tasks. The adoption of smart greenhouse technology, including greenhouse climate control and hydroponic cultivation techniques, is on the rise, enabling farmers to grow crops in controlled environments with optimal conditions. Big data processing and data analytics platforms are transforming the industry, providing valuable insights into market activities and evolving patterns. Variable rate technology and drone-based monitoring further enhance farming efficiency, with farmers able to apply inputs more accurately and cost-effectively.
  • Water usage efficiency is a key concern, with irrigation scheduling systems and aquaponics integration helping to minimize water waste. The market is a vibrant and continuously unfolding ecosystem, with ongoing advancements in technology and farming practices shaping the future of food production.

What are the Key Data Covered in this Connected Agriculture Market Research and Growth Report?

  • What is the expected growth of the Connected Agriculture Market between 2024 and 2028?

    • USD 5.9 billion, at a CAGR of 21.48%

  • What segmentation does the market report cover?

    • The report is segmented by Component (Solution, Platforms, and Services), Application (In-production management, Post-production management, and Pre-production management), Geography (North America, APAC, Europe, South America, and Middle East and Africa), Technology (Network Management, Smart Water Management, Smart Irrigation, Smart Logistics, Network Management, Smart Water Management, Smart Irrigation, and Smart Logistics), and Deployment (Cloud-based, On-premises, Cloud-based, and On-premises)

  • Which regions are analyzed in the report?

    • North America, APAC, Europe, South America, and Middle East and Africa

  • What are the key growth drivers and market challenges?

    • Maximizing profits in farm operations, Knowledge gap between farmers and technology providers

  • Who are the major players in the Connected Agriculture Market?

    • Accenture Plc, Ag Leader Technology, AGCO Corp., Cisco Systems Inc., Decisive Farming Corp., Deere and Co., Epicor Software Corp., Gamaya, International Business Machines Corp., Iteris Inc., Link Labs Inc., Microsoft Corp., Oracle Corp., Orange SA, Sage Group Plc, SAP SE, SWIIM System Ltd., Topcon Positioning Systems Inc., Trimble Inc., and Vodafone Group Plc

Market Research Insights

  • The market encompasses a range of advanced technologies and applications, including precision livestock farming, farm automation systems, crop modeling software, nutrient uptake analysis, and crop growth monitoring. According to recent estimates, the global market size for connected agriculture is projected to reach USD22.5 billion by 2025, growing at a compound annual growth rate (CAGR) of 12.2% from 2020. This growth is driven by the increasing demand for sustainable food production and resource conservation methods. In particular, the adoption of precision spraying technology and real-time data visualization has gained significant traction, with an estimated 25% of global farmland expected to use precision agriculture techniques by 2025.
  • This represents a substantial increase from the current 10%, highlighting the market's continuous evolution and potential for innovation. Additionally, the integration of AI-powered farming tools and sensor data fusion is expected to further optimize crop yields and livestock health management, contributing to the market's robust growth trajectory.

We can help! Our analysts can customize this connected agriculture market research report to meet your requirements.

Get in touch

1 Executive Summary

  • 1.1 Market overview
    • Executive Summary - Chart on Market Overview
    • Executive Summary - Data Table on Market Overview
    • Executive Summary - Chart on Global Market Characteristics
    • Executive Summary - Chart on Market by Geography
    • Executive Summary - Chart on Market Segmentation by Component
    • Executive Summary - Chart on Market Segmentation by Application
    • Executive Summary - Chart on Incremental Growth
    • Executive Summary - Data Table on Incremental Growth
    • Executive Summary - Chart on Company Market Positioning

2 Market Landscape

  • 2.1 Market ecosystem
    • Parent Market
    • Data Table on - Parent Market
  • 2.2 Market characteristics
    • Market characteristics analysis
  • 2.3 Value chain analysis
    • Value Chain Analysis

3 Market Sizing

  • 3.1 Market definition
    • Offerings of companies included in the market definition
  • 3.2 Market segment analysis
    • Market segments
  • 3.3 Market size 2023
    • 3.4 Market outlook: Forecast for 2023-2028
      • Chart on Global - Market size and forecast 2023-2028 ($ million)
      • Data Table on Global - Market size and forecast 2023-2028 ($ million)
      • Chart on Global Market: Year-over-year growth 2023-2028 (%)
      • Data Table on Global Market: Year-over-year growth 2023-2028 (%)

    4 Historic Market Size

    • 4.1 Global Connected Agriculture Market 2018 - 2022
      • Historic Market Size - Data Table on Global Connected Agriculture Market 2018 - 2022 ($ million)
    • 4.2 Component segment analysis 2018 - 2022
      • Historic Market Size - Component Segment 2018 - 2022 ($ million)
    • 4.3 Application segment analysis 2018 - 2022
      • Historic Market Size - Application Segment 2018 - 2022 ($ million)
    • 4.4 Geography segment analysis 2018 - 2022
      • Historic Market Size - Geography Segment 2018 - 2022 ($ million)
    • 4.5 Country segment analysis 2018 - 2022
      • Historic Market Size - Country Segment 2018 - 2022 ($ million)

    5 Five Forces Analysis

    • 5.1 Five forces summary
      • Five forces analysis - Comparison between 2023 and 2028
    • 5.2 Bargaining power of buyers
      • Bargaining power of buyers - Impact of key factors 2023 and 2028
    • 5.3 Bargaining power of suppliers
      • Bargaining power of suppliers - Impact of key factors in 2023 and 2028
    • 5.4 Threat of new entrants
      • Threat of new entrants - Impact of key factors in 2023 and 2028
    • 5.5 Threat of substitutes
      • Threat of substitutes - Impact of key factors in 2023 and 2028
    • 5.6 Threat of rivalry
      • Threat of rivalry - Impact of key factors in 2023 and 2028
    • 5.7 Market condition
      • Chart on Market condition - Five forces 2023 and 2028

    6 Market Segmentation by Component

    • 6.1 Market segments
      • Chart on Component - Market share 2023-2028 (%)
      • Data Table on Component - Market share 2023-2028 (%)
    • 6.2 Comparison by Component
      • Chart on Comparison by Component
      • Data Table on Comparison by Component
    • 6.3 Solution - Market size and forecast 2023-2028
      • Chart on Solution - Market size and forecast 2023-2028 ($ million)
      • Data Table on Solution - Market size and forecast 2023-2028 ($ million)
      • Chart on Solution - Year-over-year growth 2023-2028 (%)
      • Data Table on Solution - Year-over-year growth 2023-2028 (%)
    • 6.4 Platforms - Market size and forecast 2023-2028
      • Chart on Platforms - Market size and forecast 2023-2028 ($ million)
      • Data Table on Platforms - Market size and forecast 2023-2028 ($ million)
      • Chart on Platforms - Year-over-year growth 2023-2028 (%)
      • Data Table on Platforms - Year-over-year growth 2023-2028 (%)
    • 6.5 Services - Market size and forecast 2023-2028
      • Chart on Services - Market size and forecast 2023-2028 ($ million)
      • Data Table on Services - Market size and forecast 2023-2028 ($ million)
      • Chart on Services - Year-over-year growth 2023-2028 (%)
      • Data Table on Services - Year-over-year growth 2023-2028 (%)
    • 6.6 Market opportunity by Component
      • Market opportunity by Component ($ million)
      • Data Table on Market opportunity by Component ($ million)

    7 Market Segmentation by Application

    • 7.1 Market segments
      • Chart on Application - Market share 2023-2028 (%)
      • Data Table on Application - Market share 2023-2028 (%)
    • 7.2 Comparison by Application
      • Chart on Comparison by Application
      • Data Table on Comparison by Application
    • 7.3 In-production management - Market size and forecast 2023-2028
      • Chart on In-production management - Market size and forecast 2023-2028 ($ million)
      • Data Table on In-production management - Market size and forecast 2023-2028 ($ million)
      • Chart on In-production management - Year-over-year growth 2023-2028 (%)
      • Data Table on In-production management - Year-over-year growth 2023-2028 (%)
    • 7.4 Post-production management - Market size and forecast 2023-2028
      • Chart on Post-production management - Market size and forecast 2023-2028 ($ million)
      • Data Table on Post-production management - Market size and forecast 2023-2028 ($ million)
      • Chart on Post-production management - Year-over-year growth 2023-2028 (%)
      • Data Table on Post-production management - Year-over-year growth 2023-2028 (%)
    • 7.5 Pre-production management - Market size and forecast 2023-2028
      • Chart on Pre-production management - Market size and forecast 2023-2028 ($ million)
      • Data Table on Pre-production management - Market size and forecast 2023-2028 ($ million)
      • Chart on Pre-production management - Year-over-year growth 2023-2028 (%)
      • Data Table on Pre-production management - Year-over-year growth 2023-2028 (%)
    • 7.6 Market opportunity by Application
      • Market opportunity by Application ($ million)
      • Data Table on Market opportunity by Application ($ million)

    8 Market Segmentation by Technology

    • 8.1 Market segments
      • Chart on Technology - Market share (2023-2028) (%)
      • Data Table on Technology - Market share (2023-2028) (%)
    • 8.2 Comparison by Technology
      • Chart on Comparison by Technology
      • Data Table on Comparison by Technology
    • 8.3 Network Management - Market size and forecast (2023-2028)
      • Chart on Network Management - Market size and forecast (2023-2028) ($ million)
      • Data Table on Network Management - Market size and forecast (2023-2028) ($ million)
      • Chart on Network Management - Year-over-year growth (2023-2028) (%)
      • Data Table on Network Management - Year-over-year growth (2023-2028) (%)
    • 8.4 Smart Water Management - Market size and forecast (2023-2028)
      • Chart on Smart Water Management - Market size and forecast (2023-2028) ($ million)
      • Data Table on Smart Water Management - Market size and forecast (2023-2028) ($ million)
      • Chart on Smart Water Management - Year-over-year growth (2023-2028) (%)
      • Data Table on Smart Water Management - Year-over-year growth (2023-2028) (%)
    • 8.5 Smart Irrigation - Market size and forecast (2023-2028)
      • Chart on Smart Irrigation - Market size and forecast (2023-2028) ($ million)
      • Data Table on Smart Irrigation - Market size and forecast (2023-2028) ($ million)
      • Chart on Smart Irrigation - Year-over-year growth (2023-2028) (%)
      • Data Table on Smart Irrigation - Year-over-year growth (2023-2028) (%)
    • 8.6 Smart Logistics - Market size and forecast (2023-2028)
      • Chart on Smart Logistics - Market size and forecast (2023-2028) ($ million)
      • Data Table on Smart Logistics - Market size and forecast (2023-2028) ($ million)
      • Chart on Smart Logistics - Year-over-year growth (2023-2028) (%)
      • Data Table on Smart Logistics - Year-over-year growth (2023-2028) (%)
    • 8.7 Market opportunity by Technology
      • Market opportunity by $segment_name ($ million)
      • Data Table on Market opportunity by $segment_name ($ million)

    9 Market Segmentation by Deployment

    • 9.1 Market segments
      • Chart on Deployment - Market share (2023-2028) (%)
      • Data Table on Deployment - Market share (2023-2028) (%)
    • 9.2 Comparison by Deployment
      • Chart on Comparison by Deployment
      • Data Table on Comparison by Deployment
    • 9.3 Cloud-based - Market size and forecast (2023-2028)
      • Chart on Cloud-based - Market size and forecast (2023-2028) ($ million)
      • Data Table on Cloud-based - Market size and forecast (2023-2028) ($ million)
      • Chart on Cloud-based - Year-over-year growth (2023-2028) (%)
      • Data Table on Cloud-based - Year-over-year growth (2023-2028) (%)
    • 9.4 On-premises - Market size and forecast (2023-2028)
      • Chart on On-premises - Market size and forecast (2023-2028) ($ million)
      • Data Table on On-premises - Market size and forecast (2023-2028) ($ million)
      • Chart on On-premises - Year-over-year growth (2023-2028) (%)
      • Data Table on On-premises - Year-over-year growth (2023-2028) (%)
    • 9.5 Market opportunity by Deployment
      • Market opportunity by $segment_name ($ million)
      • Data Table on Market opportunity by $segment_name ($ million)

    10 Customer Landscape

    • 10.1 Customer landscape overview
      • Analysis of price sensitivity, lifecycle, customer purchase basket, adoption rates, and purchase criteria

    11 Geographic Landscape

    • 11.1 Geographic segmentation
      • Chart on Market share by geography 2023-2028 (%)
      • Data Table on Market share by geography 2023-2028 (%)
    • 11.2 Geographic comparison
      • Chart on Geographic comparison
      • Data Table on Geographic comparison
    • 11.3 North America - Market size and forecast 2023-2028
      • Chart on North America - Market size and forecast 2023-2028 ($ million)
      • Data Table on North America - Market size and forecast 2023-2028 ($ million)
      • Chart on North America - Year-over-year growth 2023-2028 (%)
      • Data Table on North America - Year-over-year growth 2023-2028 (%)
    • 11.4 APAC - Market size and forecast 2023-2028
      • Chart on APAC - Market size and forecast 2023-2028 ($ million)
      • Data Table on APAC - Market size and forecast 2023-2028 ($ million)
      • Chart on APAC - Year-over-year growth 2023-2028 (%)
      • Data Table on APAC - Year-over-year growth 2023-2028 (%)
    • 11.5 Europe - Market size and forecast 2023-2028
      • Chart on Europe - Market size and forecast 2023-2028 ($ million)
      • Data Table on Europe - Market size and forecast 2023-2028 ($ million)
      • Chart on Europe - Year-over-year growth 2023-2028 (%)
      • Data Table on Europe - Year-over-year growth 2023-2028 (%)
    • 11.6 South America - Market size and forecast 2023-2028
      • Chart on South America - Market size and forecast 2023-2028 ($ million)
      • Data Table on South America - Market size and forecast 2023-2028 ($ million)
      • Chart on South America - Year-over-year growth 2023-2028 (%)
      • Data Table on South America - Year-over-year growth 2023-2028 (%)
    • 11.7 Middle East and Africa - Market size and forecast 2023-2028
      • Chart on Middle East and Africa - Market size and forecast 2023-2028 ($ million)
      • Data Table on Middle East and Africa - Market size and forecast 2023-2028 ($ million)
      • Chart on Middle East and Africa - Year-over-year growth 2023-2028 (%)
      • Data Table on Middle East and Africa - Year-over-year growth 2023-2028 (%)
    • 11.8 US - Market size and forecast 2023-2028
      • Chart on US - Market size and forecast 2023-2028 ($ million)
      • Data Table on US - Market size and forecast 2023-2028 ($ million)
      • Chart on US - Year-over-year growth 2023-2028 (%)
      • Data Table on US - Year-over-year growth 2023-2028 (%)
    • 11.9 China - Market size and forecast 2023-2028
      • Chart on China - Market size and forecast 2023-2028 ($ million)
      • Data Table on China - Market size and forecast 2023-2028 ($ million)
      • Chart on China - Year-over-year growth 2023-2028 (%)
      • Data Table on China - Year-over-year growth 2023-2028 (%)
    • 11.10 India - Market size and forecast 2023-2028
      • Chart on India - Market size and forecast 2023-2028 ($ million)
      • Data Table on India - Market size and forecast 2023-2028 ($ million)
      • Chart on India - Year-over-year growth 2023-2028 (%)
      • Data Table on India - Year-over-year growth 2023-2028 (%)
    • 11.11 Canada - Market size and forecast 2023-2028
      • Chart on Canada - Market size and forecast 2023-2028 ($ million)
      • Data Table on Canada - Market size and forecast 2023-2028 ($ million)
      • Chart on Canada - Year-over-year growth 2023-2028 (%)
      • Data Table on Canada - Year-over-year growth 2023-2028 (%)
    • 11.12 UK - Market size and forecast 2023-2028
      • Chart on UK - Market size and forecast 2023-2028 ($ million)
      • Data Table on UK - Market size and forecast 2023-2028 ($ million)
      • Chart on UK - Year-over-year growth 2023-2028 (%)
      • Data Table on UK - Year-over-year growth 2023-2028 (%)
    • 11.13 Market opportunity by geography
      • Market opportunity by geography ($ million)
      • Data Tables on Market opportunity by geography ($ million)
    • 11.14 US - Market size and forecast (2023-2028)
      • Chart on US - Market size and forecast (2023-2028) ($ million)
      • Data Table on US - Market size and forecast (2023-2028) ($ million)
      • Chart on US - Year-over-year growth (2023-2028) (%)
      • Data Table on US - Year-over-year growth (2023-2028) (%)
    • 11.15 China - Market size and forecast (2023-2028)
      • Chart on China - Market size and forecast (2023-2028) ($ million)
      • Data Table on China - Market size and forecast (2023-2028) ($ million)
      • Chart on China - Year-over-year growth (2023-2028) (%)
      • Data Table on China - Year-over-year growth (2023-2028) (%)
    • 11.16 India - Market size and forecast (2023-2028)
      • Chart on India - Market size and forecast (2023-2028) ($ million)
      • Data Table on India - Market size and forecast (2023-2028) ($ million)
      • Chart on India - Year-over-year growth (2023-2028) (%)
      • Data Table on India - Year-over-year growth (2023-2028) (%)
    • 11.17 Canada - Market size and forecast (2023-2028)
      • Chart on Canada - Market size and forecast (2023-2028) ($ million)
      • Data Table on Canada - Market size and forecast (2023-2028) ($ million)
      • Chart on Canada - Year-over-year growth (2023-2028) (%)
      • Data Table on Canada - Year-over-year growth (2023-2028) (%)
    • 11.18 UK - Market size and forecast (2023-2028)
      • Chart on UK - Market size and forecast (2023-2028) ($ million)
      • Data Table on UK - Market size and forecast (2023-2028) ($ million)
      • Chart on UK - Year-over-year growth (2023-2028) (%)
      • Data Table on UK - Year-over-year growth (2023-2028) (%)

    12 Drivers, Challenges, and Opportunity/Restraints

    • 12.1 Market drivers
      • 12.2 Market challenges
        • 12.3 Impact of drivers and challenges
          • Impact of drivers and challenges in 2023 and 2028
        • 12.4 Market opportunities/restraints

          13 Competitive Landscape

          • 13.1 Overview
            • 13.2 Competitive Landscape
              • Overview on criticality of inputs and factors of differentiation
            • 13.3 Landscape disruption
              • Overview on factors of disruption
            • 13.4 Industry risks
              • Impact of key risks on business

            14 Competitive Analysis

            • 14.1 Companies profiled
              • Companies covered
            • 14.2 Market positioning of companies
              • Matrix on companies position and classification
            • 14.3 Accenture Plc
              • Accenture Plc - Overview
              • Accenture Plc - Business segments
              • Accenture Plc - Key news
              • Accenture Plc - Key offerings
              • Accenture Plc - Segment focus
            • 14.4 Ag Leader Technology
              • Ag Leader Technology - Overview
              • Ag Leader Technology - Product / Service
              • Ag Leader Technology - Key offerings
            • 14.5 Cisco Systems Inc.
              • Cisco Systems Inc. - Overview
              • Cisco Systems Inc. - Business segments
              • Cisco Systems Inc. - Key news
              • Cisco Systems Inc. - Key offerings
              • Cisco Systems Inc. - Segment focus
            • 14.6 Decisive Farming Corp.
              • Decisive Farming Corp. - Overview
              • Decisive Farming Corp. - Product / Service
              • Decisive Farming Corp. - Key offerings
            • 14.7 Deere and Co.
              • Deere and Co. - Overview
              • Deere and Co. - Business segments
              • Deere and Co. - Key news
              • Deere and Co. - Key offerings
              • Deere and Co. - Segment focus
            • 14.8 Gamaya
              • Gamaya - Overview
              • Gamaya - Product / Service
              • Gamaya - Key offerings
            • 14.9 International Business Machines Corp.
              • International Business Machines Corp. - Overview
              • International Business Machines Corp. - Business segments
              • International Business Machines Corp. - Key news
              • International Business Machines Corp. - Key offerings
              • International Business Machines Corp. - Segment focus
            • 14.10 Iteris Inc.
              • Iteris Inc. - Overview
              • Iteris Inc. - Business segments
              • Iteris Inc. - Key offerings
              • Iteris Inc. - Segment focus
            • 14.11 Link Labs Inc.
              • Link Labs Inc. - Overview
              • Link Labs Inc. - Product / Service
              • Link Labs Inc. - Key offerings
            • 14.12 Microsoft Corp.
              • Microsoft Corp. - Overview
              • Microsoft Corp. - Business segments
              • Microsoft Corp. - Key news
              • Microsoft Corp. - Key offerings
              • Microsoft Corp. - Segment focus
            • 14.13 Orange SA
              • Orange SA - Overview
              • Orange SA - Business segments
              • Orange SA - Key offerings
              • Orange SA - Segment focus
            • 14.14 SAP SE
              • SAP SE - Overview
              • SAP SE - Business segments
              • SAP SE - Key news
              • SAP SE - Key offerings
              • SAP SE - Segment focus
            • 14.15 Topcon Positioning Systems Inc.
              • Topcon Positioning Systems Inc. - Overview
              • Topcon Positioning Systems Inc. - Product / Service
              • Topcon Positioning Systems Inc. - Key offerings
            • 14.16 Trimble Inc.
              • Trimble Inc. - Overview
              • Trimble Inc. - Business segments
              • Trimble Inc. - Key offerings
              • Trimble Inc. - Segment focus
            • 14.17 Vodafone Group Plc
              • Vodafone Group Plc - Overview
              • Vodafone Group Plc - Business segments
              • Vodafone Group Plc - Key offerings
              • Vodafone Group Plc - Segment focus

            15 Appendix

            • 15.1 Scope of the report
              • 15.2 Inclusions and exclusions checklist
                • Inclusions checklist
                • Exclusions checklist
              • 15.3 Currency conversion rates for US$
                • Currency conversion rates for US$
              • 15.4 Research methodology
                • Research methodology
              • 15.5 Data procurement
                • Information sources
              • 15.6 Data validation
                • Data validation
              • 15.7 Validation techniques employed for market sizing
                • Validation techniques employed for market sizing
              • 15.8 Data synthesis
                • Data synthesis
              • 15.9 360 degree market analysis
                • 360 degree market analysis
              • 15.10 List of abbreviations
                • List of abbreviations

              Research Methodology

              Technavio presents a detailed picture of the market by way of study, synthesis, and summation of data from multiple sources. The analysts have presented the various facets of the market with a particular focus on identifying the key industry influencers. The data thus presented is comprehensive, reliable, and the result of extensive research, both primary and secondary.

              INFORMATION SOURCES

              Primary sources

              • Manufacturers and suppliers
              • Channel partners
              • Industry experts
              • Strategic decision makers

              Secondary sources

              • Industry journals and periodicals
              • Government data
              • Financial reports of key industry players
              • Historical data
              • Press releases

              DATA ANALYSIS

              Data Synthesis

              • Collation of data
              • Estimation of key figures
              • Analysis of derived insights

              Data Validation

              • Triangulation with data models
              • Reference against proprietary databases
              • Corroboration with industry experts

              REPORT WRITING

              Qualitative

              • Market drivers
              • Market challenges
              • Market trends
              • Five forces analysis

              Quantitative

              • Market size and forecast
              • Market segmentation
              • Geographical insights
              • Competitive landscape

              Interested in this report?

              Get your sample now to see our research methodology and insights!

              Download Now

              Frequently Asked Questions

              Connected Agriculture market growth will increase by $ 5904.2 mn during 2024-2028 .

              The Connected Agriculture market is expected to grow at a CAGR of 21.48% during 2024-2028 .

              Connected Agriculture market is segmented by Component( Solution, Platforms, Services) Application( In-production management, Post-production management, Pre-production management, South America, MEA)

              Accenture Plc, Ag Leader Technology, AGCO Corp., Cisco Systems Inc., Decisive Farming Corp., Deere and Co., Epicor Software Corp., Gamaya, International Business Machines Corp., Iteris Inc., Link Labs Inc., Microsoft Corp., Oracle Corp., Orange SA, Sage Group Plc, SAP SE, SWIIM System Ltd., Topcon Positioning Systems Inc., Trimble Inc., Vodafone Group Plc are a few of the key vendors in the Connected Agriculture market.

              APAC will register the highest growth rate of 40% among the other regions. Therefore, the Connected Agriculture market in APAC is expected to garner significant business opportunities for the vendors during the forecast period.

              US, Canada, Germany, UK, Italy, France, China, India, Japan, Brazil, Egypt, UAE, Oman, Argentina, KSA

              • Maximizing profits in farm operationsThe yield and output of crops and animals must be maximized to increase profits in farming. Connected agriculture technology enables farms to monitor and regulate remote operations and provide logical data to analyze several aspects of an agriculture farm. Connected agriculture is rapidly emerging as a technology that will help farmers enhance agricultures deliverables. With connected agriculture on the rise is the driving factor this market.
              • farmers can control and monitor the equipment is the driving factor this market.
              • crop is the driving factor this market.
              • and livestock through their smartphones and receive statistical predictions for crops and livestock. Smart sensors is the driving factor this market.
              • satellite imagery is the driving factor this market.
              • and other cloud-based technologies are highly beneficial for observing and recording data during crop planting is the driving factor this market.
              • harvesting is the driving factor this market.
              • maximizing production output is the driving factor this market.
              • and minimizing the cost of resources. In animal husbandry is the driving factor this market.
              • connected agriculture practices help in data collection through sensors and visual imaging is the driving factor this market.
              • which can quickly analyze the health and physical well-being of a particular animal and flag deviations in case of any disease or ailment. In this way is the driving factor this market.
              • the animal can be treated in due course without spreading the infection to other animals. Moreover is the driving factor this market.
              • the installation of machines allows automated milking of cattle is the driving factor this market.
              • which helps in increasing production and saving labor costs is the driving factor this market.
              • thus is the driving factor this market.
              • driving the growth of global connected agriculture market during the forecast period. is the driving factor this market.

              The Connected Agriculture market vendors should focus on grabbing business opportunities from the Solution segment as it accounted for the largest market share in the base year.