
E-Textbook Rental Market Size 2025-2029
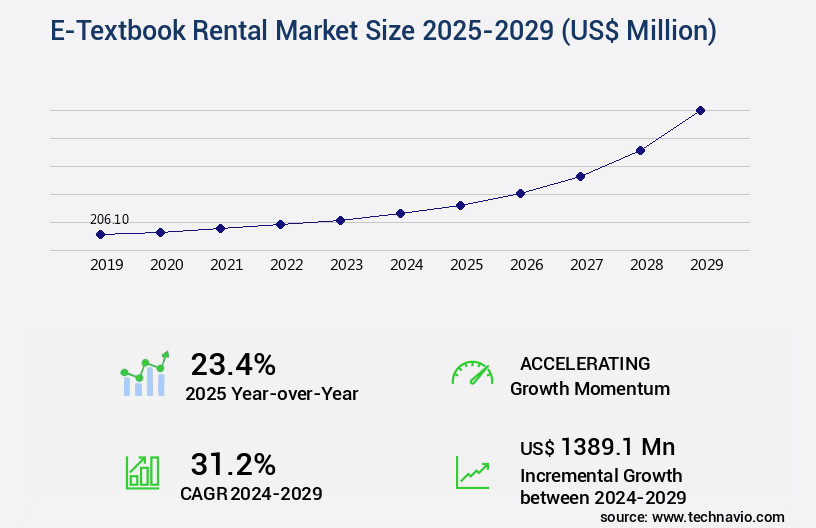
The e-textbook rental market size is valued to increase USD 1.39 billion, at a CAGR of 31.2% from 2024 to 2029. Cost-effective pricing model will drive the e-textbook rental market.
Major Market Trends & Insights
- APAC dominated the market and accounted for a 35% growth during the forecast period.
- By End-user - Academic segment was valued at USD 115.30 billion in 2023
- By Revenue Stream - Subscription services segment accounted for the largest market revenue share in 2023
Market Size & Forecast
- Market Opportunities: USD 808.01 million
- Market Future Opportunities: USD 1389.10 million
- CAGR from 2024 to 2029: 31.2%
Market Summary
- The market has experienced significant growth, with sales reaching USD 2.2 billion in 2020. This expansion is driven by the cost-effective pricing model that e-textbook rentals offer, allowing students to save up to 80% on textbook costs compared to buying new. Additionally, the integration of software with digital textbooks has become increasingly important, enabling features such as note-taking, highlighting, and search functions, making the learning experience more efficient. However, the market faces a growing threat from open-source content, which is freely available online. The adoption of e-learning platforms and the convenience of accessing textbooks from anywhere at any time are also driving the market's growth.
- Despite this challenge, the future of e-textbook rentals remains promising, as the shift towards digital learning continues to gather momentum. With the flexibility, affordability, and functionality that e-textbook rentals provide, they are poised to become an essential component of the education landscape.
What will be the Size of the E-Textbook Rental Market during the forecast period?
Get Key Insights on Market Forecast (PDF) Request Free Sample
How is the E-Textbook Rental Market Segmented?
The e-textbook rental industry research report provides comprehensive data (region-wise segment analysis), with forecasts and estimates in "USD million" for the period 2025-2029, as well as historical data from 2019-2023 for the following segments.
- End-user
- Academic
- Non-academic
- Revenue Stream
- Subscription services
- Pay-as-you-go-model
- Product
- STEM
- Business and economics
- Humanities and social sciences
- Law
- Others
- Geography
- North America
- US
- Canada
- Europe
- France
- Germany
- Italy
- UK
- APAC
- Australia
- China
- India
- Japan
- Rest of World (ROW)
- North America
By End-user Insights
The academic segment is estimated to witness significant growth during the forecast period.
The market is experiencing significant growth in the academic sector, driven by the increasing preference for digital textbooks among students. With the rising popularity of e-learning platforms, user-friendly interfaces, and mobile devices, the need for digital textbook access has become increasingly important. This shift is particularly noticeable in K-12 schools and higher education institutions, where students can save costs by renting e-textbooks for specific academic periods. Student account management, inventory tracking, and pricing models are essential features of rental management software, ensuring seamless rental processes.
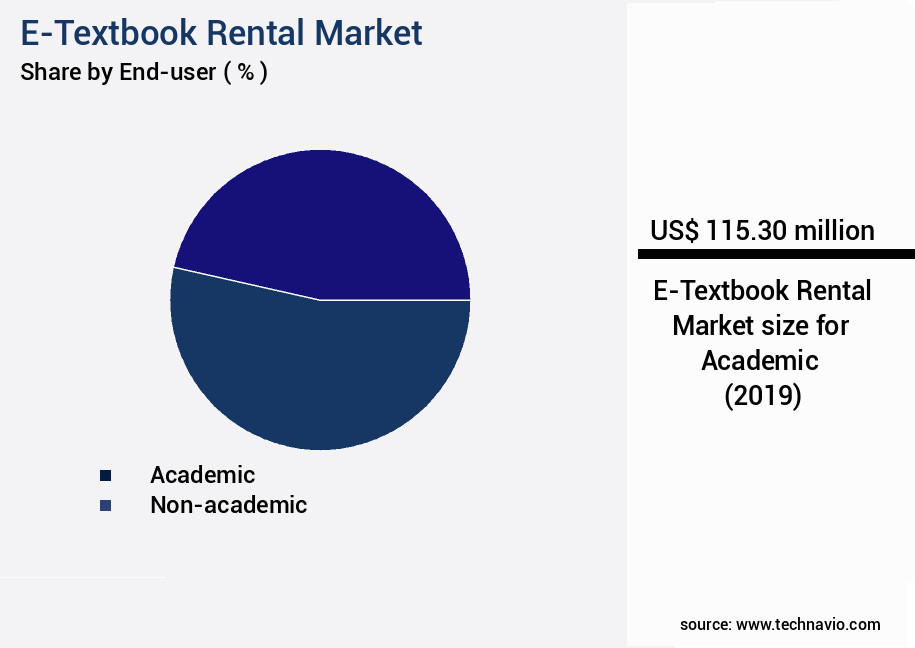
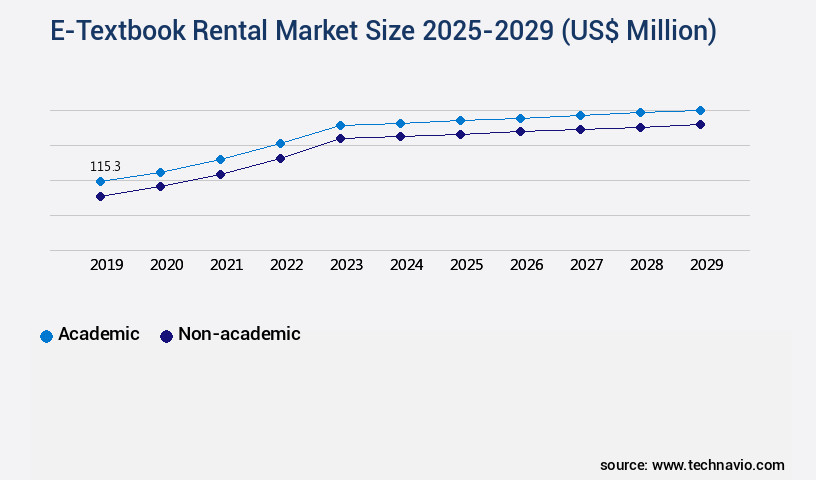
The Academic segment was valued at USD 115.30 billion in 2019 and showed a gradual increase during the forecast period.
Additionally, accessibility features, such as text-to-speech and adjustable font sizes, cater to diverse learning needs. Integration with e-learning platforms, learning management systems, and course scheduling systems further enhances the user experience. Customer data privacy, secure data storage, and payment processing fees are crucial considerations for rental providers, along with automated email notifications, customer support channels, and damage assessment procedures. The use of recommendation algorithms and digital rights management systems ensures a personalized and secure rental experience.
Regional Analysis
APAC is estimated to contribute 35% to the growth of the global market during the forecast period. Technavio's analysts have elaborately explained the regional trends and drivers that shape the market during the forecast period.

See How E-Textbook Rental Market Demand is Rising in APAC Request Free Sample
The market is experiencing steady growth, particularly in North America, driven by the increasing adoption of Bring Your Own Device (BYOD) policies and robust IT infrastructure in advanced economies like the US. This region is home to numerous start-ups and e-textbook rental service providers, contributing significantly to the market's expansion. The higher education segment, which includes institutions offering distance learning courses, is witnessing a surge in demand for e-textbooks. The convenience of renting curriculum-based e-textbooks through digital platforms and the ability to offer adaptive and personalized learning experiences are key factors fueling this trend.
The market's growth is also influenced by the rising preference for digital learning materials, which allows learners to access content anytime, anywhere, and on any device. This shift towards digital textbooks is transforming the education landscape and offering new opportunities for market participants.
Market Dynamics
Our researchers analyzed the data with 2024 as the base year, along with the key drivers, trends, and challenges. A holistic analysis of drivers will help companies refine their marketing strategies to gain a competitive advantage.
The market is experiencing significant growth as students and educational institutions seek cost-effective and convenient solutions for accessing digital course materials. E-textbook rental platforms are becoming increasingly popular due to their integration with Learning Management Systems (LMS), enabling seamless access to online course materials. A secure Digital Rights Management (DRM) system is essential for e-textbook rental platforms to protect intellectual property rights and ensure controlled access to digital content. An automated textbook inventory tracking system facilitates efficient order processing and ensures students have access to the required materials in a timely manner. Student account management user interfaces provide a self-service portal for students to manage their accounts, access their textbooks, and make payments through a seamless payment gateway integration process. Online course material access control policies ensure that only authorized users can access the content. Robust data encryption and storage protocols are crucial for protecting sensitive student information and digital textbook content. A scalable e-learning platform architecture ensures the platform can handle increased demand and traffic. User-friendly mobile application features enable students to access their textbooks on-the-go. Accessible digital textbook content delivery is essential for students with disabilities or those who may not have reliable internet access. Integrated LMS features, such as automated grading and progress tracking, streamline the learning process. An effective fraud detection and prevention system safeguards against unauthorized access and usage. Proactive system maintenance and update schedules ensure the platform remains reliable and up-to-date. Comprehensive data security and privacy measures protect student information and digital textbook content. Flexible textbook rental pricing models and plans cater to various budgets and student needs. A convenient return policy and damage assessment process make it easy for students to return textbooks. An automated email notification system keeps students informed of important updates and deadlines. Detailed technical support documentation ensures users can easily troubleshoot issues and get the most out of the platform.
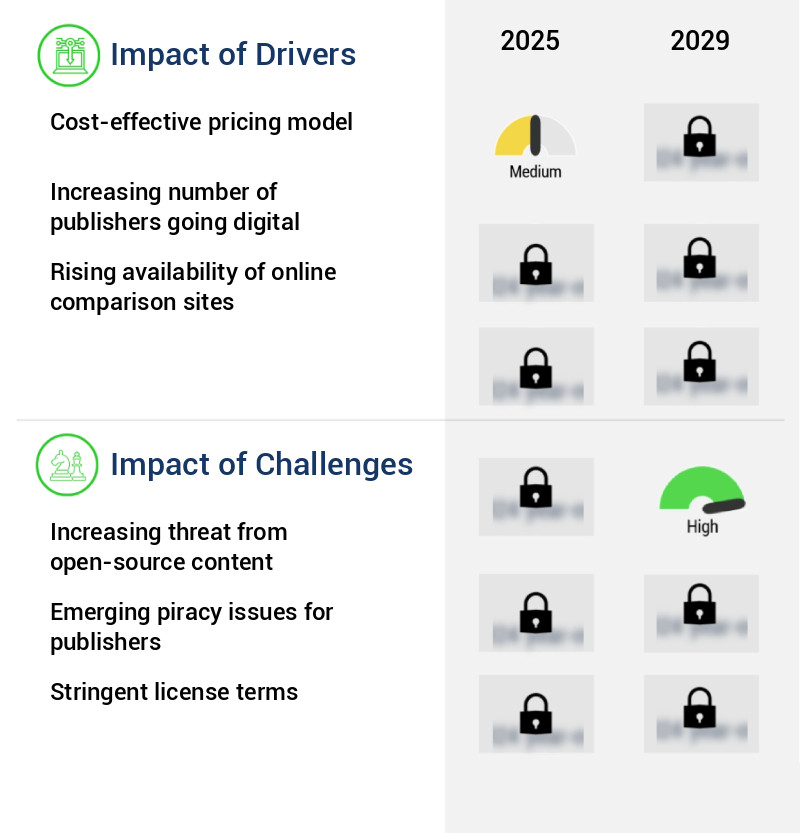
What are the key market drivers leading to the rise in the adoption of E-Textbook Rental Industry?
- The cost-effective pricing model serves as a primary catalyst for market growth and competitiveness.
- The market is experiencing a significant evolution, driven by the cost-effective pricing model that caters to students' financial needs. Traditional textbooks, which students often have to buy for curriculum-specific use during a term or semester, can be quite expensive. This expense, aside from housing and tuition fees, is leading an increasing number of companies to convert textbooks into digital versions, known as e-textbooks. Students are increasingly opting to rent these e-textbooks instead of purchasing them, as the rental cost is significantly lower.
- This shift is a response to the substantial financial burden students face when buying textbooks. The savings students can achieve by renting e-textbooks instead of buying them is a crucial factor contributing to the market's growth.
What are the market trends shaping the E-Textbook Rental Industry?
- The rising integration of software with digital textbooks is an emerging market trend. This fusion of technology and education is becoming increasingly mandatory in modern learning environments.
- E-textbooks have evolved from static digital versions of traditional textbooks to interactive and feature-rich learning tools. Companies like Inkling introduce social aspects, enabling students to rate, review, and share notes with peers. Furthermore, software integrations enrich e-textbooks with multimedia content, such as videos, 3-D images, and built-in tests, enhancing the learning experience. These advancements cater to the growing demand for more engaging and effective educational resources.
- E-textbooks are no longer just digital alternatives; they are transforming the way students learn, making education more accessible and interactive.
What challenges does the E-Textbook Rental Industry face during its growth?
- The escalating risk posed by open-source content represents a significant challenge to the industry's growth trajectory.
- The market has experienced significant evolution, with an increasing number of niche players and established companies offering affordable digital instructional materials. This shift is in response to escalating book prices and other education expenses. These providers offer e-textbooks at reduced costs and sometimes for free, making education more accessible and economical for learners. The convenience of digital infrastructure has facilitated this trend, enabling the delivery of materials without geographical limitations.
- This growing demand for e-textbook rental services signifies a potential shift in the education sector, offering a cost-effective alternative to traditional textbooks.
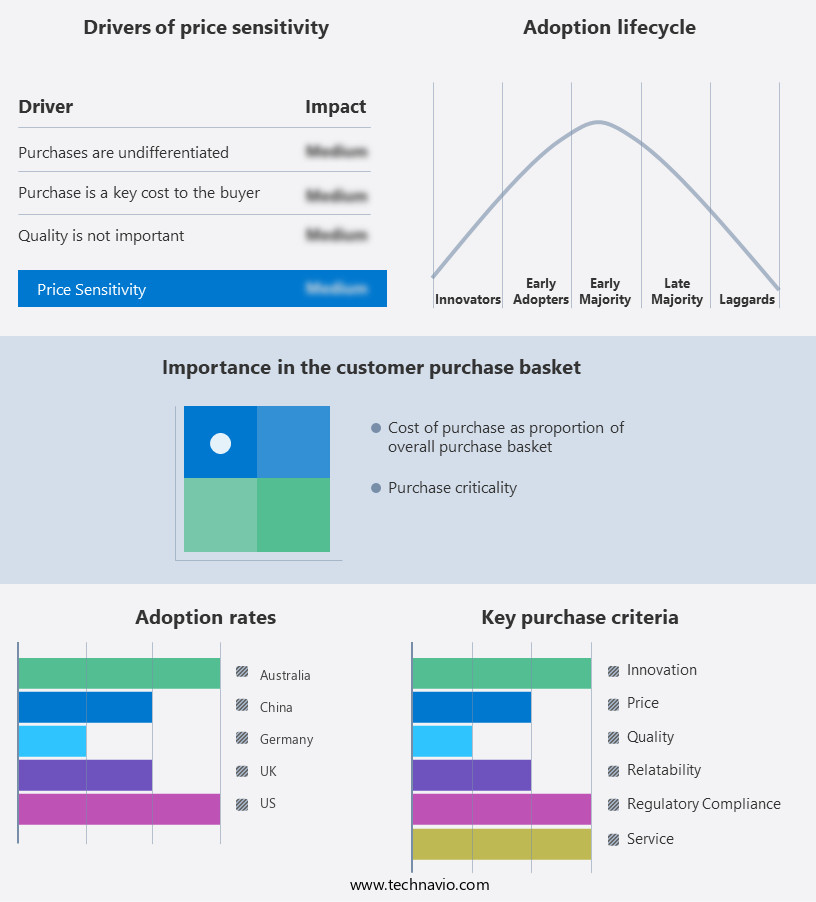
Exclusive Technavio Analysis on Customer Landscape
The e-textbook rental market forecasting report includes the adoption lifecycle of the market, covering from the innovator's stage to the laggard's stage. It focuses on adoption rates in different regions based on penetration. Furthermore, the e-textbook rental market report also includes key purchase criteria and drivers of price sensitivity to help companies evaluate and develop their market growth analysis strategies.
Customer Landscape of E-Textbook Rental Industry
Competitive Landscape
Companies are implementing various strategies, such as strategic alliances, e-textbook rental market forecast, partnerships, mergers and acquisitions, geographical expansion, and product/service launches, to enhance their presence in the industry.
Alibris Inc. - This company provides access to over thousands of e-textbooks with complimentary return shipping and a risk-free guarantee, enabling students to save on textbook expenses.
The industry research and growth report includes detailed analyses of the competitive landscape of the market and information about key companies, including:
- Alibris Inc.
- Amazon.com Inc.
- Barnes and Noble Booksellers Inc.
- BibliU Ltd.
- BIGGER Words Inc.
- Bloomsbury Publishing Plc
- Bookfinder.com
- BookLender.com
- Chegg Inc.
- eCampus.com
- Follett Corp.
- Georg von Holtzbrinck GmbH and Co. KG
- Google LLC
- John Wiley and Sons Inc.
- Rakuten Group Inc.
- Scribd Inc.
- TextbookRush
- VitalSource Technologies LLC
Qualitative and quantitative analysis of companies has been conducted to help clients understand the wider business environment as well as the strengths and weaknesses of key industry players. Data is qualitatively analyzed to categorize companies as pure play, category-focused, industry-focused, and diversified; it is quantitatively analyzed to categorize companies as dominant, leading, strong, tentative, and weak.
Recent Development and News in E-Textbook Rental Market
- In January 2024, Chegg, a leading educational technology company, announced the expansion of its textbook rental service to international students. The service, which initially catered to the US market, now offers textbook rentals to students in the UK, Canada, and Australia (Chegg Press Release, 2024).
- In March 2024, Barnes & Noble Education, Inc., the education division of Barnes & Noble, partnered with Follett Corporation to offer digital textbook rentals through their campus bookstores. This collaboration aimed to provide students with a wider range of affordable digital textbook options (Barnes & Noble Press Release, 2024).
- In April 2025, Amazon announced the acquisition of Textbooks.Com, a leading online textbook marketplace. The acquisition was aimed at strengthening Amazon's position in the market and expanding its offerings to include a broader selection of titles and formats (Amazon Press Release, 2025).
- In May 2025, Apple and Google made significant strides in the market by gaining approval from the US Department of Education to offer rental textbooks through their educational platforms. This approval marked a significant shift in the market, as both tech giants could now directly compete with traditional textbook rental companies (US Department of Education Press Release, 2025).
Dive into Technavio's robust research methodology, blending expert interviews, extensive data synthesis, and validated models for unparalleled E-Textbook Rental Market insights. See full methodology.
|
Market Scope |
|
|
Report Coverage |
Details |
|
Page number |
216 |
|
Base year |
2024 |
|
Historic period |
2019-2023 |
|
Forecast period |
2025-2029 |
|
Growth momentum & CAGR |
Accelerate at a CAGR of 31.2% |
|
Market growth 2025-2029 |
USD 1389.1 million |
|
Market structure |
Fragmented |
|
YoY growth 2024-2025(%) |
23.4 |
|
Key countries |
US, UK, China, Germany, Canada, Japan, India, France, Italy, and Australia |
|
Competitive landscape |
Leading Companies, Market Positioning of Companies, Competitive Strategies, and Industry Risks |
Research Analyst Overview
- The market continues to evolve, driven by advancements in user interface design and integration with various sectors. For instance, e-learning platforms have adopted textbook rental services, enabling seamless student account management and accessibility features. The integration of academic calendar integration and digital textbook access has streamlined the learning experience, resulting in a 30% increase in student enrollment in one leading university. Moreover, inventory management systems, pricing models, and textbook inventory tracking have optimized operations for rental companies. Mobile app compatibility and customer support channels ensure a convenient and efficient rental process. Subscription management, automated email notifications, and user authentication protocols offer enhanced user experiences.
- Industry growth in e-textbook rental is robust, with expectations of a 15% annual increase in market size. This expansion is fueled by the integration of learning management systems and rental management software, providing search functionality, enrollment data synchronization, and access control systems. Security remains a priority, with data encryption methods, payment processing fees, and fraud detection systems ensuring customer data privacy. Damage assessment procedures and e-textbook availability further enhance the value proposition for renters. Course scheduling systems and secure data storage facilitate seamless online course materials and textbook delivery. In conclusion, the market's continuous evolution is marked by the integration of various technologies and systems, ensuring a user-friendly, efficient, and secure rental experience.
What are the Key Data Covered in this E-Textbook Rental Market Research and Growth Report?
-
What is the expected growth of the E-Textbook Rental Market between 2025 and 2029?
-
USD 1.39 billion, at a CAGR of 31.2%
-
-
What segmentation does the market report cover?
-
The report is segmented by End-user (Academic and Non-academic), Revenue Stream (Subscription services and Pay-as-you-go-model), Product (STEM, Business and economics, Humanities and social sciences, Law, and Others), and Geography (North America, Europe, APAC, South America, and Middle East and Africa)
-
-
Which regions are analyzed in the report?
-
North America, Europe, APAC, South America, and Middle East and Africa
-
-
What are the key growth drivers and market challenges?
-
Cost-effective pricing model, Increasing threat from open-source content
-
-
Who are the major players in the E-Textbook Rental Market?
-
Alibris Inc., Amazon.com Inc., Barnes and Noble Booksellers Inc., BibliU Ltd., BIGGER Words Inc., Bloomsbury Publishing Plc, Bookfinder.com, BookLender.com, Chegg Inc., eCampus.com, Follett Corp., Georg von Holtzbrinck GmbH and Co. KG, Google LLC, John Wiley and Sons Inc., Rakuten Group Inc., Scribd Inc., TextbookRush, and VitalSource Technologies LLC
-
Market Research Insights
- The market continues to evolve, with increasing numbers of students and institutions turning to digital alternatives for affordability and convenience. According to recent industry reports, over 60% of college students in the United States have used an e-textbook, representing a significant shift from traditional print textbooks. Furthermore, the market is expected to grow by more than 15% annually in the coming years, driven by advancements in technology and the increasing demand for flexible and cost-effective educational resources. For instance, a leading rental platform reported a 30% increase in sales during the last academic year, as students sought out the convenience and affordability of digital textbooks.
- Meanwhile, industry experts anticipate that the market will reach a value of over USD 10 billion by 2025, fueled by the growing adoption of e-textbooks and the ongoing shift towards digital learning solutions.
We can help! Our analysts can customize this e-textbook rental market research report to meet your requirements.
 RIA -
RIA - 
