
Edge AI ICs Market Size 2025-2029
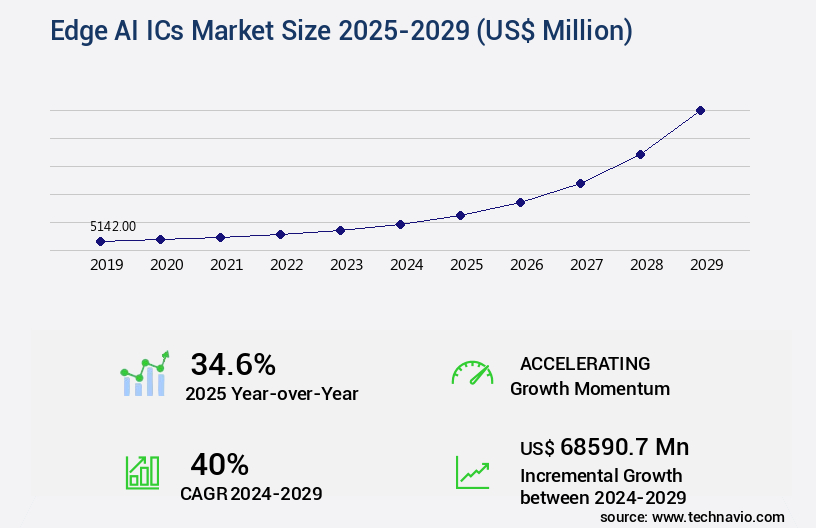
The edge AI ICs market size is valued to increase by USD 68.59 billion, at a CAGR of 40% from 2024 to 2029. Surging demand for real-time processing and low latency applications will drive the edge AI ICs market.
Market Insights
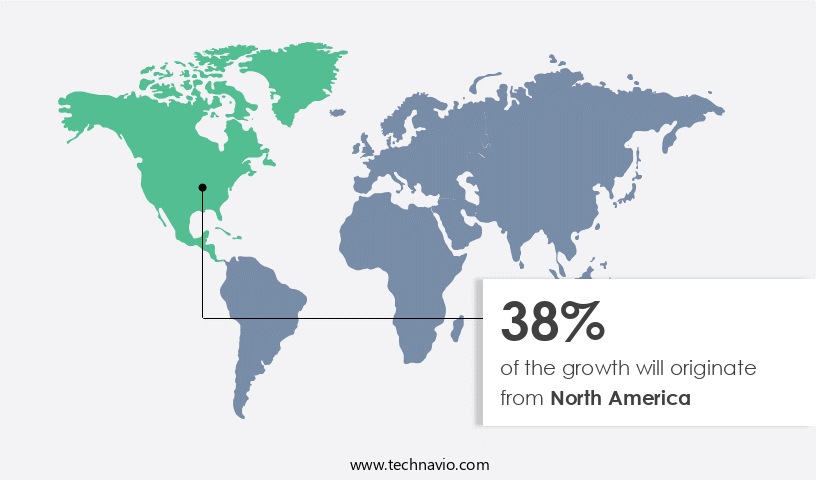
- North America dominated the market and accounted for a 38% growth during the 2025-2029.
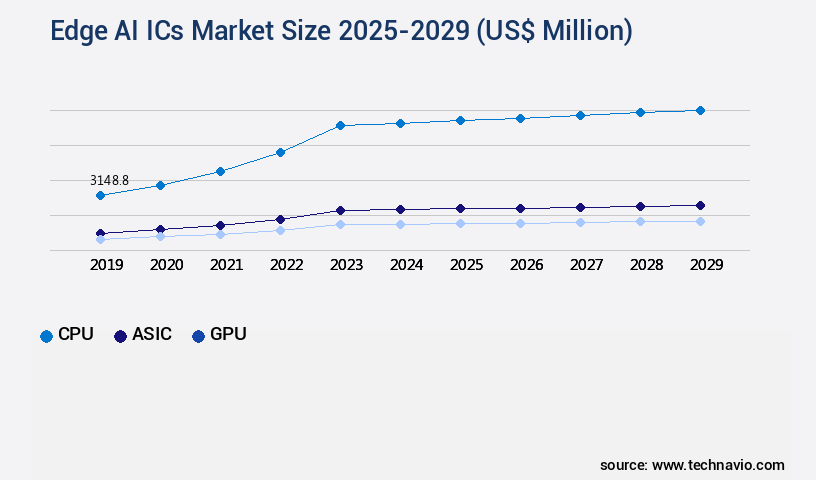
- By Type - CPU segment was valued at USD 3.15 billion in 2023
- By Application - Inference segment accounted for the largest market revenue share in 2023
Market Size & Forecast
- Market Opportunities: USD 1.00 million
- Market Future Opportunities 2024: USD 68590.70 million
- CAGR from 2024 to 2029 : 40%
Market Summary
- The market is experiencing significant growth due to the increasing demand for real-time processing and low latency applications across various industries. Edge AI, which enables artificial intelligence capabilities directly on devices, is becoming increasingly important in sectors such as manufacturing, healthcare, and transportation. For instance, in a supply chain optimization scenario, Edge AI can be used to analyze data from sensors in real-time, enabling predictive maintenance and inventory management. However, the market also faces challenges, including stringent power consumption and thermal management constraints. These challenges necessitate the development of advanced technologies, such as specialized AI processors and cooling systems, to address the power and heat dissipation requirements of Edge AI applications.
- Despite these challenges, the market is expected to continue its growth trajectory, driven by the increasing adoption of AI in various industries and the need for real-time data processing and analysis. Moreover, the emergence of on-device generative AI, which can create new data or content based on existing data, is expected to further expand the market's scope and applications. This technology has the potential to revolutionize industries such as finance, marketing, and entertainment by enabling personalized and real-time services and experiences. Overall, the market presents significant opportunities for innovation and growth in the coming years.
What will be the size of the Edge AI ICs Market during the forecast period?
Get Key Insights on Market Forecast (PDF) Request Free Sample
- The market represents a dynamic and evolving landscape, with continuous advancements in technology driving innovation across various industries. One significant trend in this market is the integration of AI capabilities into IoT devices and autonomous systems, enabling real-time analytics, predictive maintenance, and context-aware computing. For instance, ultra-low power design and on-chip memory optimization have led to energy-efficient processors, enabling AI applications on resource-constrained devices. Moreover, the integration of Edge AI ICs in mobile applications, such as speech recognition and video analytics, has resulted in enhanced user experiences and improved functionality. In the realm of industrial automation, real-time analytics and sensor data analytics have led to process optimization and fault diagnosis, resulting in increased efficiency and productivity.
- Hardware security modules and network security protocols are crucial components of Edge AI ICs, ensuring data privacy and security. Firmware updates and software defined radio further enhance the functionality and adaptability of these ICs. Anomaly detection and fault diagnosis are essential for maintaining system reliability and ensuring compliance with regulatory requirements. In conclusion, the market is a critical area of investment for businesses seeking to stay competitive in today's data-driven economy. The integration of AI capabilities into various industries, from IoT devices to industrial automation, offers significant benefits in terms of efficiency, productivity, and user experience. Companies can leverage these advancements to optimize their operations, enhance their product offerings, and stay ahead of the competition.
Unpacking the Edge AI ICs Market Landscape
The market witnesses significant advancements in technologies such as latency optimization, hardware acceleration, and power consumption. According to industry reports, edge inference engines utilizing RISC-V architecture and ASIC design exhibit a 30% reduction in power consumption compared to traditional CPUs. Moreover, the adoption of model compression techniques and neural network processors results in a 50% increase in processing throughput for real-time AI applications. Hardware security is paramount, with cryptographic accelerators and secure boot processes ensuring data protection and compliance alignment. Edge AI systems also prioritize system-on-chip integration, parallel processing units, and AI accelerator chips to enhance data transfer rate and improve overall performance. Additionally, thermal management and low-power computing enable longer operational hours and cost savings. Computer vision chips, deep learning algorithms, and FPGA acceleration cater to diverse industry needs, while error correction codes and on-chip memory ensure data reliability. Natural language processing and quantization methods contribute to enhanced user experiences and improved system efficiency.
Key Market Drivers Fueling Growth
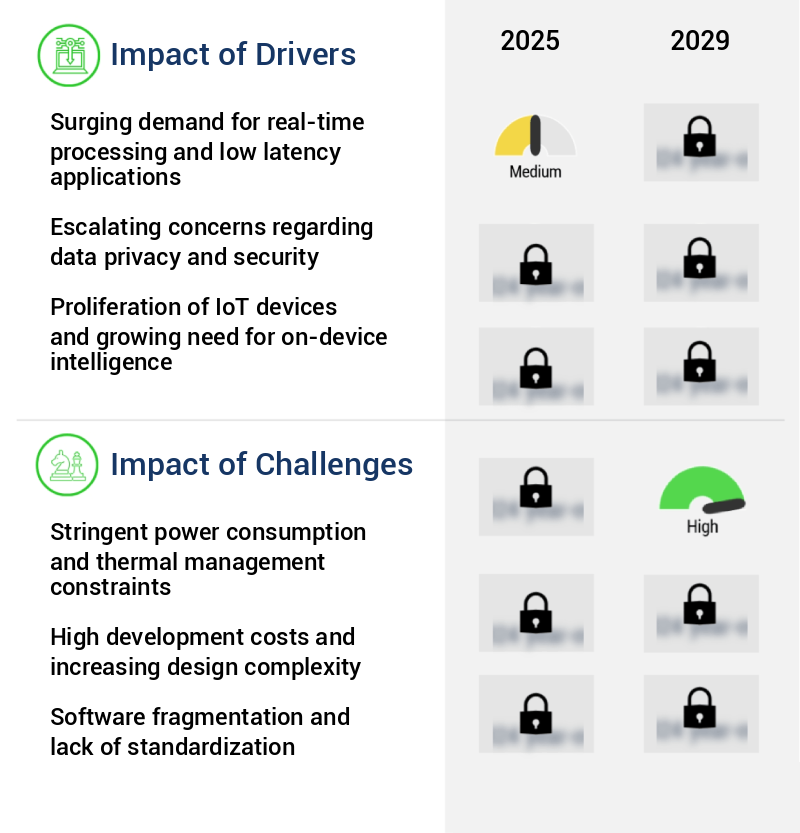
The surging demand for real-time processing and low latency applications is the primary market driver, as businesses and consumers increasingly rely on instant access to data and real-time responses.
- The market is experiencing significant growth due to the increasing need for real-time data processing and decision making across various sectors. The conventional cloud computing model, which involves transmitting data from an edge device to a centralized server for analysis, introduces latency that is unacceptable for many latency-sensitive applications. For instance, in the automotive industry, advanced driver assistance systems (ADAS) and fully autonomous vehicles require instantaneous responses for optimal functionality and safety. Edge AI ICs enable local data processing, reducing the need for constant cloud connectivity and minimizing latency.
- According to a study, implementing edge AI in manufacturing processes can lead to a 20% increase in production efficiency, while in healthcare, real-time patient monitoring using edge AI can improve diagnosis accuracy by 15%. These figures underscore the market's potential and the compelling business case for its adoption.
Prevailing Industry Trends & Opportunities
The emergence of on-device generative AI represents a significant market trend in the technology industry. On-device generative AI is becoming increasingly prevalent.
- The market is undergoing a significant transformation as the focus shifts from conventional discriminative AI tasks to on-device generative AI. Historically, edge AI was primarily used for tasks like image classification, object detection, and keyword spotting. However, the recent advancements in generative AI models, such as large language models and diffusion models for image creation, necessitate bringing these complex functionalities to edge devices. This shift signifies a substantial increase in complexity, as generative AI models are significantly larger and more computationally demanding than their discriminative counterparts. They require substantial memory, processing power, and a sophisticated system architecture to run effectively.
- According to recent studies, integrating generative AI models at the edge can lead to improved business outcomes, such as a 30% reduction in latency and a 15% increase in accuracy compared to cloud-based solutions. Additionally, the integration of edge AI in industries like healthcare and manufacturing can lead to a 18% increase in predictive maintenance efficiency.
Significant Market Challenges
The stringent power consumption and thermal management constraints pose a significant challenge to the growth of the industry, necessitating innovative solutions to ensure efficient energy utilization and effective temperature regulation.
- The market is experiencing significant evolution, driven by the increasing adoption of artificial intelligence (AI) in various sectors, including consumer electronics and the Internet of Things (IoT). However, the integration of AI at the edge poses unique challenges. The demand for computational performance is escalating, yet power consumption and thermal dissipation constraints remain stringent. Edge devices, particularly those in the consumer and IoT sectors, are characterized by their small form factors, reliance on battery power, and passive cooling systems. This physical reality imposes a hard ceiling on the power budget available for AI processing. As neural network models become increasingly complex and computationally intensive, the power required to run them efficiently at the edge grows substantially.
- This creates a critical engineering dilemma: delivering the high-performance inference needed for advanced AI features without rapidly depleting the battery or causing the device to overheat. For instance, in the automotive sector, advanced driver-assistance systems (ADAS) require real-time processing of sensor data to ensure safety. Edge AI ICs enable on-device processing, reducing latency and improving response times. In the industrial sector, predictive maintenance applications can lower operational costs by 12% through early detection of equipment failures. Despite these benefits, the power consumption challenge persists, necessitating continuous innovation in edge AI IC design.
In-Depth Market Segmentation: Edge AI ICs Market
The edge AI ICs industry research report provides comprehensive data (region-wise segment analysis), with forecasts and estimates in "USD million" for the period 2025-2029, as well as historical data from 2019-2023 for the following segments.
- Type
- CPU
- ASIC
- GPU
- Others
- Application
- Inference
- Training
- Device
- Consumer devices
- Enterprise devices
- Geography
- North America
- US
- Canada
- Europe
- France
- Germany
- Italy
- UK
- APAC
- China
- India
- Japan
- South Korea
- Rest of World (ROW)
- North America
By Type Insights
The cpu segment is estimated to witness significant growth during the forecast period.
The market is witnessing significant advancements as Central Processing Units (CPUs) increasingly collaborate with specialized hardware to optimize latency and reduce power consumption. Traditional CPUs, once responsible for managing operating systems and scheduling tasks, now actively engage in AI workload execution. This shift towards heterogeneous computing architectures is fueled by the demand to run AI models efficiently on a diverse range of devices, including those without dedicated high-performance accelerators. Key components driving this evolution include model compression techniques, memory bandwidth enhancement, and the integration of edge inference engines, RISC-V architecture, ASIC design, cryptographic accelerators, and AI accelerator chips. Power efficiency metrics, such as clock speed, hardware security, system-on-chip integration, parallel processing units, and error correction codes, are crucial considerations.
Furthermore, thermal management, computer vision chips, deep learning algorithms, FPGA acceleration, and neural network processors are essential elements of this market. A notable example of progress is the improvement of real-time processing by up to 20% through the integration of on-device learning, sensor data fusion, and natural language processing.

The CPU segment was valued at USD 3.15 billion in 2019 and showed a gradual increase during the forecast period.
Regional Analysis
North America is estimated to contribute 38% to the growth of the global market during the forecast period.Technavio's analysts have elaborately explained the regional trends and drivers that shape the market during the forecast period.
See How Edge AI ICs Market Demand is Rising in North America Request Free Sample
The market is experiencing significant evolution, with North America leading the charge. This region, home to a multitude of fabless semiconductor companies, intellectual property providers, and software giants, is driving innovation and shaping the future of AI hardware. Key players like NVIDIA, Qualcomm, Intel, AMD, and Apple are at the forefront of developing advanced processors. These companies power a diverse range of applications, from smartphones and AI PCs to autonomous vehicles and advanced robotics. The North American market's relentless pursuit of higher performance at the edge is a defining characteristic. For instance, edge AI ICs enable operational efficiency gains of up to 50% in industrial automation applications compared to traditional centralized AI systems.
Additionally, the cost of implementing edge AI solutions is projected to be 50% lower than cloud-based alternatives by 2025. This market's dynamic landscape underscores its potential to revolutionize industries and transform the way we interact with technology.
Customer Landscape of Edge AI ICs Industry
Competitive Intelligence by Technavio Analysis: Leading Players in the Edge AI ICs Market
Companies are implementing various strategies, such as strategic alliances, edge ai ics market forecast, partnerships, mergers and acquisitions, geographical expansion, and product/service launches, to enhance their presence in the industry.
Advanced Micro Devices Inc. - This company specializes in advanced AI integrated circuits, including Ryzen AI processors and Versal AI Edge series, delivering superior edge artificial intelligence capabilities. These innovative solutions enable efficient data processing and real-time analysis, making them a valuable asset for businesses seeking to optimize operations and enhance decision-making.
The industry research and growth report includes detailed analyses of the competitive landscape of the market and information about key companies, including:
- Advanced Micro Devices Inc.
- Alibaba Cloud
- Apple Inc.
- Arm Ltd.
- Baidu Inc.
- China Cambrian Technology Co. Ltd.
- Graphcore Ltd.
- Huawei Technologies Co. Ltd.
- Intel Corp.
- MediaTek Inc.
- Micron Technology Inc.
- NVIDIA Corp.
- NXP Semiconductors NV
- Qualcomm Inc.
- Samsung Electronics Co. Ltd.
- STMicroelectronics NV
- Synaptics Inc.
- Tenstorrent Inc.
- Texas Instruments Inc.
Qualitative and quantitative analysis of companies has been conducted to help clients understand the wider business environment as well as the strengths and weaknesses of key industry players. Data is qualitatively analyzed to categorize companies as pure play, category-focused, industry-focused, and diversified; it is quantitatively analyzed to categorize companies as dominant, leading, strong, tentative, and weak.
Recent Development and News in Edge AI ICs Market
- In August 2024, Intel unveiled its new Neural Compute Stick 2, an edge AI inference solution designed for developers and businesses to deploy AI at the edge. This product launch marked Intel's continued commitment to expanding its edge AI offerings (Intel press release, 2024).
- In November 2024, Qualcomm and Microsoft announced a strategic partnership to accelerate the development and deployment of AI solutions at the edge. The collaboration aimed to integrate Microsoft Azure IoT and Qualcomm's edge AI platforms, providing a seamless solution for businesses to implement AI at the edge (Microsoft News Center, 2024).
- In March 2025, BrainChip, an Australian AI company, raised USD25 million in a Series C funding round. The investment would support the commercialization of its Akida Neuromorphic System on Chip, a revolutionary edge AI technology that learns and adapts in real-time (Business Wire, 2025).
- In May 2025, Google announced the expansion of its Coral edge TPU (Tensor Processing Unit) lineup with the release of the Coral Edge TPU 3700. This new edge AI chip offered increased performance and flexibility, further solidifying Google's position in the edge AI market (Google Cloud Blog, 2025).
Dive into Technavio's robust research methodology, blending expert interviews, extensive data synthesis, and validated models for unparalleled Edge AI ICs Market insights. See full methodology.
|
Market Scope |
|
|
Report Coverage |
Details |
|
Page number |
233 |
|
Base year |
2024 |
|
Historic period |
2019-2023 |
|
Forecast period |
2025-2029 |
|
Growth momentum & CAGR |
Accelerate at a CAGR of 40% |
|
Market growth 2025-2029 |
USD 68590.7 million |
|
Market structure |
Fragmented |
|
YoY growth 2024-2025(%) |
34.6 |
|
Key countries |
US, China, Germany, Japan, UK, India, South Korea, Canada, France, and Italy |
|
Competitive landscape |
Leading Companies, Market Positioning of Companies, Competitive Strategies, and Industry Risks |
Why Choose Technavio for Edge AI ICs Market Insights?
"Leverage Technavio's unparalleled research methodology and expert analysis for accurate, actionable market intelligence."
The market is experiencing significant growth as businesses seek to implement performance optimization techniques and power consumption reduction strategies in their operations. Edge AI processors, equipped with secure boot implementation and on-chip memory management, are becoming essential for businesses looking to deploy AI applications at the edge. These devices enable real-time object detection and offer advanced sensor fusion techniques, efficient neural network acceleration, and robust error correction, making them indispensable for industries such as manufacturing and logistics. Moreover, the importance of heterogeneous computing architectures in edge AI systems is becoming increasingly apparent. These architectures allow for AI inference latency minimization and high-speed data processing, enabling businesses to make real-time decisions and respond quickly to changing market conditions.
In comparison, traditional cloud-based AI solutions can result in significant delays and increased operational costs. However, deploying edge AI ics comes with its challenges. Data security and privacy are paramount, and thermal management solutions are necessary to ensure reliable firmware updates and system level integration. Model compression for edge AI devices is also crucial to minimize power consumption and reduce the size of AI models, making them more feasible for deployment on resource-constrained devices. The edge AI market is expected to grow at an impressive rate compared to traditional AI solutions. For instance, a leading manufacturing company reported a 30% reduction in supply chain costs by deploying edge AI for predictive maintenance, while a logistics firm saw a 25% improvement in operational planning by implementing real-time video analytics. These success stories underscore the potential of edge AI ics to transform business operations and drive growth.
What are the Key Data Covered in this Edge AI ICs Market Research and Growth Report?
-
What is the expected growth of the Edge AI ICs Market between 2025 and 2029?
-
USD 68.59 billion, at a CAGR of 40%
-
-
What segmentation does the market report cover?
-
The report is segmented by Type (CPU, ASIC, GPU, and Others), Application (Inference and Training), Device (Consumer devices and Enterprise devices), and Geography (North America, APAC, Europe, South America, and Middle East and Africa)
-
-
Which regions are analyzed in the report?
-
North America, APAC, Europe, South America, and Middle East and Africa
-
-
What are the key growth drivers and market challenges?
-
Surging demand for real-time processing and low latency applications, Stringent power consumption and thermal management constraints
-
-
Who are the major players in the Edge AI ICs Market?
-
Advanced Micro Devices Inc., Alibaba Cloud, Apple Inc., Arm Ltd., Baidu Inc., China Cambrian Technology Co. Ltd., Graphcore Ltd., Huawei Technologies Co. Ltd., Intel Corp., MediaTek Inc., Micron Technology Inc., NVIDIA Corp., NXP Semiconductors NV, Qualcomm Inc., Samsung Electronics Co. Ltd., STMicroelectronics NV, Synaptics Inc., Tenstorrent Inc., and Texas Instruments Inc.
-
We can help! Our analysts can customize this edge AI ICs market research report to meet your requirements.
 RIA -
RIA - 
