
US Education PC And Tablet Market Size 2025-2029
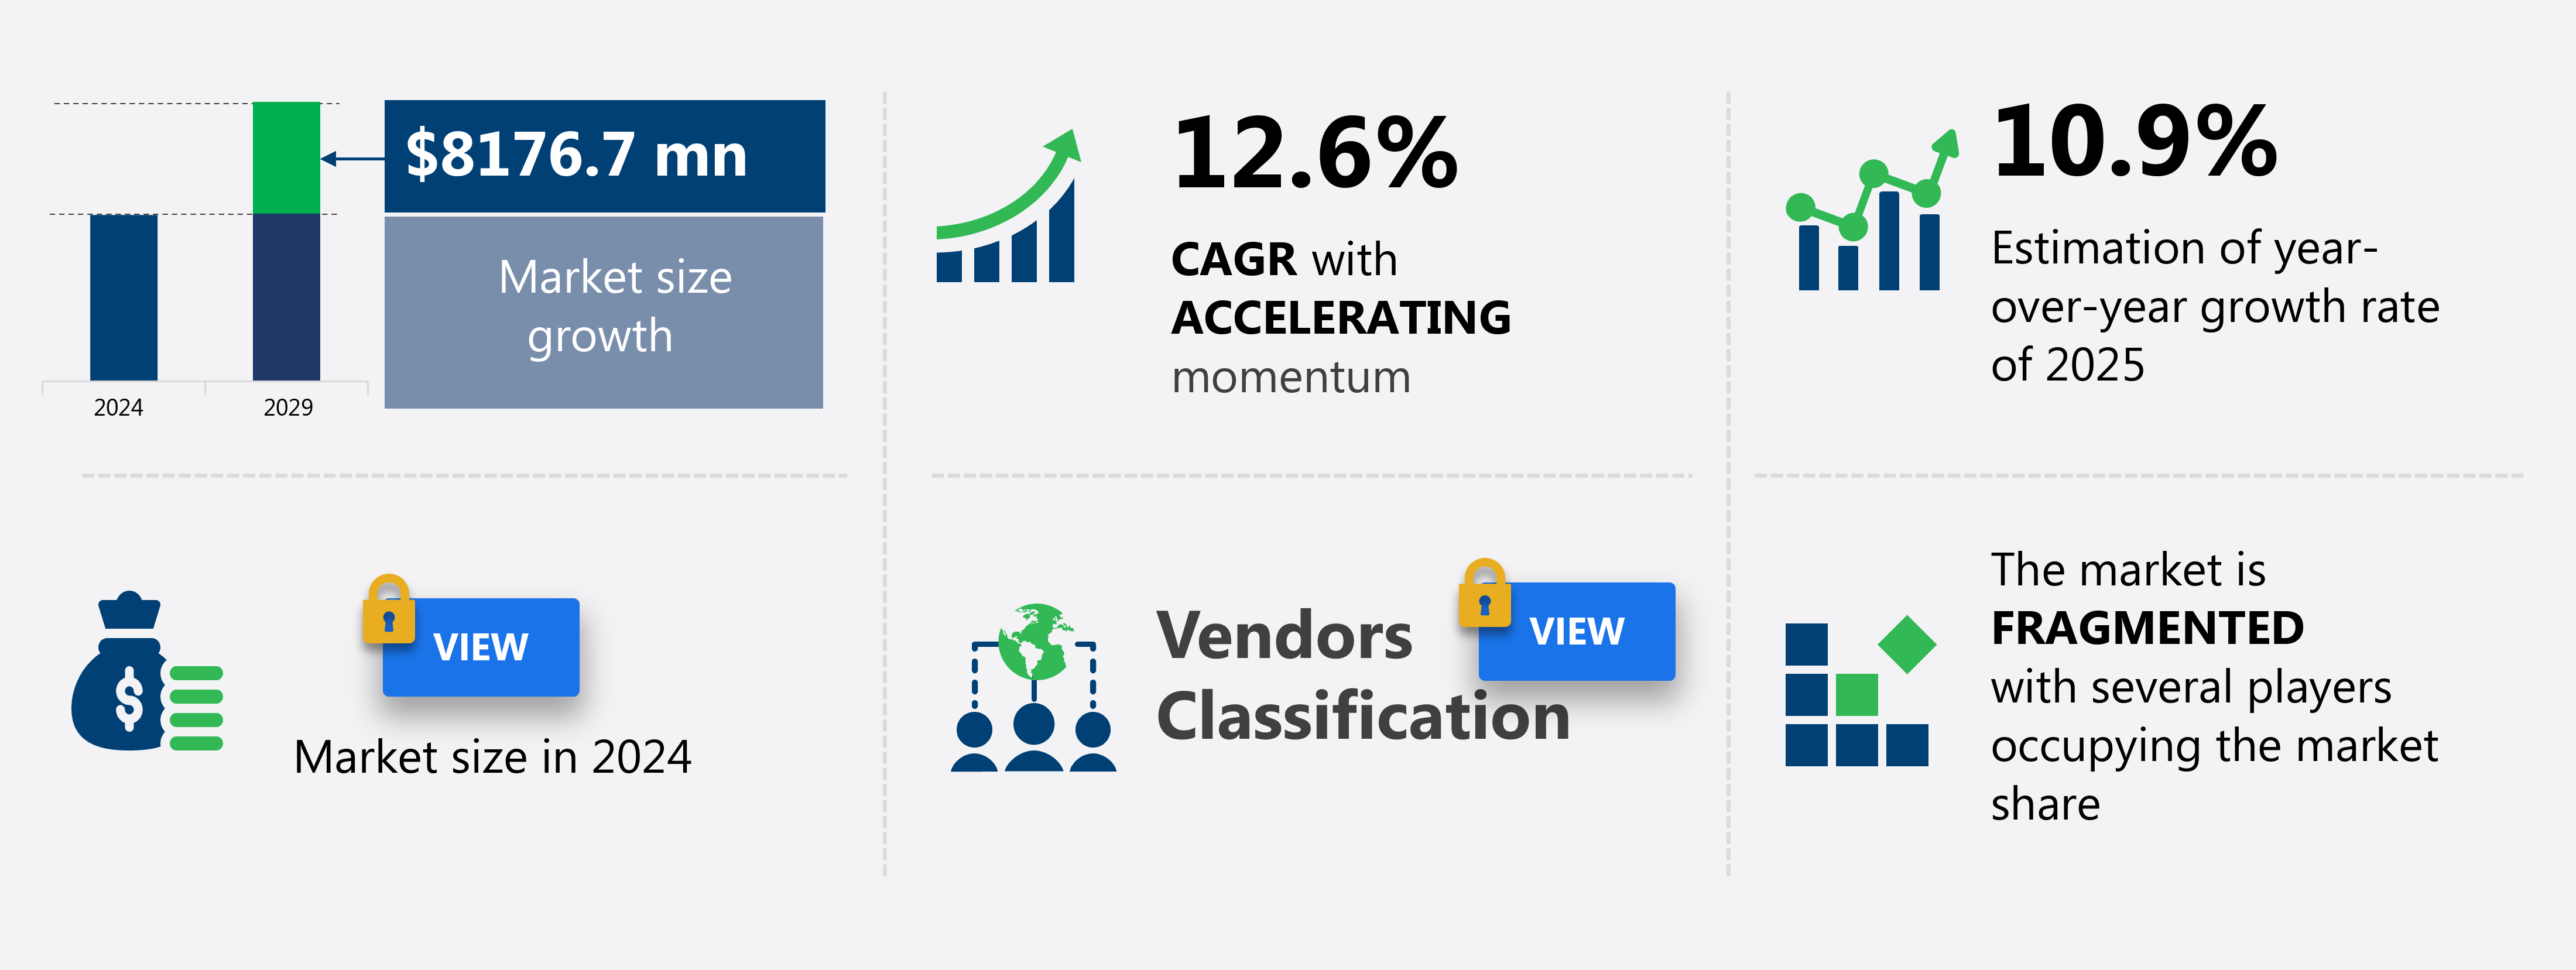
The US education PC and tablet market size is forecast to increase by USD 8.18 billion at a CAGR of 12.6% between 2024 and 2029.
- The market witness significant growth due to the strong demand for online learning and the increasing adoption of wearables and IoT in education. The integration of technology in education has transformed the learning experience, enabling students to access educational content from anywhere at any time. Moreover, the use of wearables and IoT devices in education enhances the learning process by providing real-time feedback and interactive learning experiences.
- However, the market faces challenges such as inadequate cybersecurity measures, which pose a threat to the privacy and security of student data. As technology continues to evolve, it is essential for stakeholders to address these challenges to ensure the safe and effective use of technology in education.
What will be the US Education PC And Tablet Market Size During the Forecast Period?
- In the contemporary educational landscape, digital learning solutions have emerged as a game-changer, revolutionizing the way knowledge is imparted and absorbed. Smart teaching techniques, such as animated videos, presentations, and e-books, have become essential tools for educational institutions to enhance student engagement and facilitate effective learning. Portable devices, including PCs and tablets, have become indispensable in this digital transformation. The elearning industry has witnessed an increase in the demand for multi-purpose computers, enabling students to access digital content in various formats, such as PDFs and portable document formats. Career decisions have become more informed with the availability of vast digital resources, allowing learners to explore various subjects and topics at their own pace.
- Moreover, the integration of extended reality technologies, including augmented reality and virtual reality, has added a new dimension to digital learning. These technologies provide enriching experiences, making learning more interactive and engaging. Application developers have been at the forefront of creating innovative solutions, integrating video, animation, and 3D animation to make learning more visually appealing and effective. The internet has become an integral part of digital learning, providing access to a wealth of information and resources. Smart teaching platforms have emerged as a popular choice for educational institutions, offering a range of features, including interactive tools, assessment capabilities, and collaborative learning opportunities.
How is this market segmented and which is the largest segment?
The market research report provides comprehensive data (region-wise segment analysis), with forecasts and estimates in "USD billion" for the period 2025-2029, as well as historical data from 2019-2023 for the following segments.
- Distribution Channel
- Offline
- Online
- Product
- Laptop
- Tablet
- Desktop
- End-user
- K-12
- Higher education
- Geography
- US
By Distribution Channel Insights
- The offline segment is estimated to witness significant growth during the forecast period.
The market witnessed significant growth through offline distribution channels in 2024. This segment includes the sale of products through retail outlets, such as department stores, hypermarkets, and supermarkets. Retail stores remain the dominant players due to their wide product range and accessibility. Department stores, in particular, drive market growth due to the availability of a diverse selection of education PCs and tablets. Consumers prefer these shopping destinations for their convenience and the ability to compare and purchase multiple digital learning tools in one visit. The offline distribution channel's popularity is expected to continue growing, contributing to the expansion of the education technology market in the US.

Get a glance at the market report of share of various segments Request Free Sample
Market Dynamics
Our market researchers analyzed the data with 2024 as the base year, along with the key drivers, trends, and challenges. A holistic analysis of drivers will help companies refine their marketing strategies to gain a competitive advantage.
What are the key market drivers leading to the rise in adoption of US Education PC And Tablet Market?
strong demand for online education is the key driver of the market.
- The market have witnessed significant growth due to the increasing adoption of digital learning solutions in educational institutions. Smart teaching techniques, such as animated videos, e-books, and presentations, have become essential components of modern education. These digital learning tools offer numerous benefits, including increased student engagement, real-time doubt resolution, and improved access to information. Laptops and desktops, as multi-purpose computer devices, have become indispensable for students and educators alike. They enable the use of learning management systems, virtual reality, augmented reality, and artificial intelligence to facilitate next-generation education. Moreover, high-speed internet and cloud computing have made digital learning more accessible, allowing for remote working and distance education.
- The education industry's digitization has led to the emergence of solid-state drives, extended reality technologies, and application developers, creating a vast array of digital content. Three-dimensional (3D) animation and video have become essential components of e-learning platforms, enhancing the learning experience for students. Furthermore, the use of laptops, desktops, and tablets in primary, secondary, and higher education has become ubiquitous. The growth of digital learning methods has been fueled by the increasing broadband penetration and the availability of affordable consumer electronic products. The e-learning industry has seen an increase in demand for digital literacy and career decisions, making it a crucial sector for innovation and development.
What are the market trends shaping the US Education PC And Tablet Market?
Rising adoption of wearables and IoT is the upcoming trend in the market.
- The market is experiencing significant growth due to the integration of advanced digital learning solutions in educational institutions. Smart teaching techniques, such as animated videos, presentations, and e-books, have become essential tools for enhancing student engagement and facilitating information access. Personal computers, including desktops and laptops, and tablets have emerged as popular consumer electronic products for digital learning. Three-dimensional (3D) animation, virtual reality, augmented reality, and artificial intelligence are next-generation products transforming the education sector. These technologies enable real-time doubt resolution, creativity, and enriching learning experiences. Learning management systems, solid-state drives, and cloud computing are digital platforms that support these advanced educational systems.
- Moreover, the e-learning industry is witnessing a shift towards digital literacy and online learning, with an increasing number of schools, universities, and colleges adopting digital learning methods. High-speed internet and digital content are crucial components of these digital learning platforms. The use of application developers, extended reality technologies, and machine learning is also on the rise to create interactive and personalized learning experiences. The integration of IoT technology in education is creating smart classrooms, where devices like smart desks, interactive whiteboards, and document cameras facilitate an enhanced interactive and engaging learning environment. The use of wearable technology and digital learning tools, such as notebooks, is also gaining popularity.
What challenges does US Education PC And Tablet Market face during the growth?
Inadequate cybersecurity measures is a key challenge affecting the market growth.
- The market has experienced significant growth in the past five years due to the integration of digital learning solutions in educational institutions. Smart teaching techniques, such as animated videos, presentations, and e-books, have become essential tools for enhancing student engagement and facilitating information access. Digital learning tools like laptops and desktops, as well as tablets, have become indispensable for both students and educators. However, the education sector's increasing reliance on digital platforms presents new challenges. Cybersecurity is a critical concern, as the protection of software, hardware, and student data is paramount. Digital literacy and the availability of high-speed internet are also essential for effective implementation of digital learning methods.
- Furthermore, three-dimensional (3D) animation, virtual reality, augmented reality, artificial intelligence, and machine learning are next-generation products transforming the education landscape. Learning management systems, solid-state drives, and cloud computing are also crucial components of the e-learning industry. The education PC and tablet market's growth is driven by the demand for personalized learning experiences, real-time doubt resolution, and career decision support. The market's dynamics are influenced by factors like broadband penetration, digital content creation, and the availability of e-learning platforms. Primary, secondary, and higher education institutions, including schools, universities, and colleges, are adopting digital learning methods for distance education and remote working. The education PC and tablet market's future is promising, with the potential to revolutionize the way we learn and teach.
Exclusive Customer Landscape
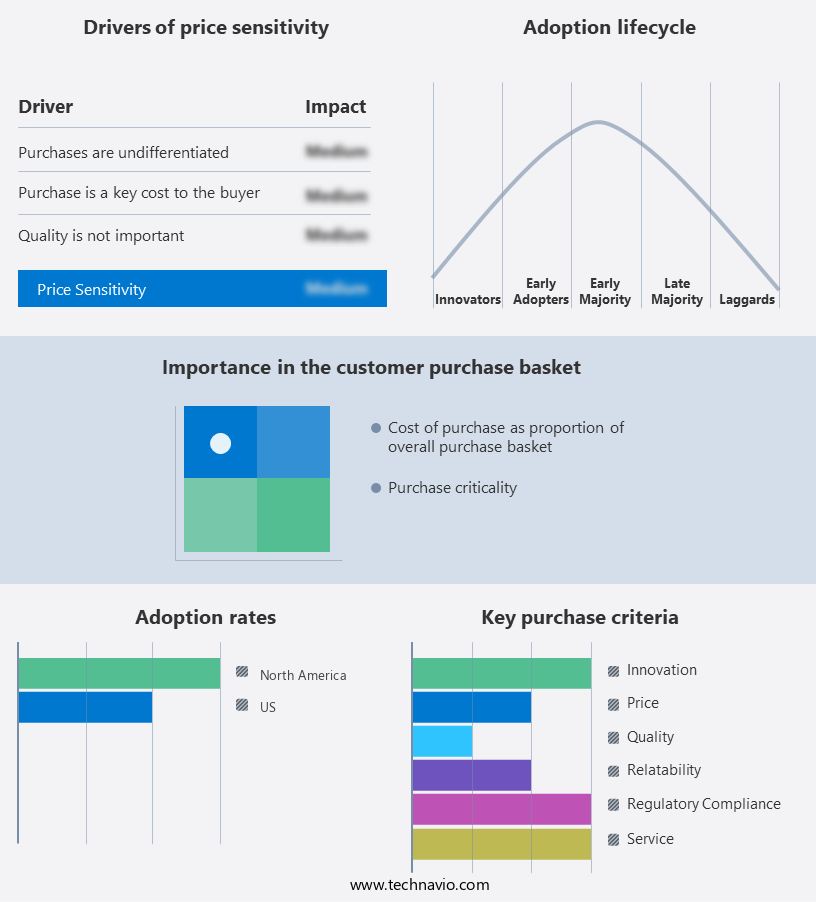
The market forecasting report includes the adoption lifecycle of the market, covering from the innovator's stage to the laggard's stage. It focuses on adoption rates in different regions based on penetration. Furthermore, the market report also includes key purchase criteria and drivers of price sensitivity to help companies evaluate and develop their market growth analysis strategies.
Customer Landscape
Key Companies & Market Insights
Companies are implementing various strategies, such as strategic alliances, market forecast, partnerships, mergers and acquisitions, geographical expansion, and product/service launches, to enhance their presence in the market.
Acer Inc. - The company offers education pc and tablet such as acer one tablet, acer swift laptop and acer aspire 3 spin laptops.
The market research and growth report includes detailed analyses of the competitive landscape of the market and information about key companies, including:
- Advantech Co. Ltd.
- Alphabet Inc.
- Apple Inc.
- ASUSTeK Computer Inc.
- Dell Technologies Inc.
- Estone Group LLC
- HCL Technologies Ltd.
- HP Inc.
- Lenovo Group Ltd.
- LG Corp.
- Microsoft Corp.
- NEC Corp.
- Nexstgo Co. Ltd.
- Nokia Corp.
- Panasonic Holdings Corp.
- Samsung Electronics Co. Ltd.
- Sony Group Corp.
- Toshiba Corp.
- Xiaomi Inc.
Qualitative and quantitative analysis of companies has been conducted to help clients understand the wider business environment as well as the strengths and weaknesses of key market players. Data is qualitatively analyzed to categorize companies as pure play, category-focused, industry-focused, and diversified; it is quantitatively analyzed to categorize companies as dominant, leading, strong, tentative, and weak.
Research Analyst Overview
The education sector has undergone a significant transformation in recent years, with the integration of digital learning solutions becoming increasingly prevalent. This shift towards technology-enhanced education has been driven by the need to improve student engagement, enhance information access, and promote creativity in the learning process. Digital learning solutions encompass a wide range of tools and platforms designed to facilitate effective teaching and learning. These include animated videos, presentations, e-books, and portable document formats. These resources offer numerous advantages, such as real-time doubt resolution, increased student engagement, and the ability to access information from anywhere, at any time.
Moreover, personal computers (PCs) and tablets have emerged as the go-to devices for digital learning, offering a versatile and convenient platform for both educators and students. The PC industry has responded to this trend by producing a range of multi-purpose computers and laptops specifically designed for educational institutions. These devices offer long battery life, strong build quality, and a user-friendly interface, making them ideal for use in schools, universities, and colleges. Tablets, on the other hand, offer the added benefit of portability, enabling students to learn on the go. They are particularly popular in primary and secondary education, where the ability to access digital resources outside of the classroom is essential.
In addition, the integration of digital learning tools has led to the emergence of smart teaching platforms, which leverage technologies such as virtual reality, augmented reality, artificial intelligence, and three-dimensional (3D) animation to create enriching and interactive learning experiences. These platforms have been shown to improve student engagement and promote creativity, making them an invaluable resource for educators. The rise of digital learning solutions has also led to the growth of the e-learning industry, with learning management systems and e-learning platforms becoming essential tools for educational institutions. These platforms offer a range of features, including the ability to deliver content online, track student progress, and facilitate remote working and crisis management strategies.
|
US Education PC And Tablet Market Scope |
|
|
Report Coverage |
Details |
|
Page number |
167 |
|
Base year |
2024 |
|
Historic period |
2019-2023 |
|
Forecast period |
2025-2029 |
|
Growth momentum & CAGR |
Accelerate at a CAGR of 12.6% |
|
Market growth 2025-2029 |
USD 8.18 billion |
|
Market structure |
Fragmented |
|
YoY growth 2024-2025(%) |
10.9 |
|
Competitive landscape |
Leading Companies, Market Positioning of Companies, Competitive Strategies, and Industry Risks |
What are the Key Data Covered in this Market Research and Growth Report?
- CAGR of the market during the forecast period
- Detailed information on factors that will drive the market growth and forecasting between 2025 and 2029
- Precise estimation of the size of the market and its contribution of the market in focus to the parent market
- Accurate predictions about upcoming market growth and trends and changes in consumer behaviour
- Growth of the market across US
- Thorough analysis of the market's competitive landscape and detailed information about companies
- Comprehensive analysis of factors that will challenge the growth of market companies
We can help! Our analysts can customize this market research report to meet your requirements. Get in touch
 RIA -
RIA - 
