eHealth Software and Services Market Analysis North America, Europe, Asia, Rest of World (ROW) - US, Canada, Germany, UK, China - Size and Forecast 2024-2028

eHealth Software and Services Market Analysis North America, Europe, Asia, Rest of World (ROW) - US, Canada, Germany, UK, China - Size and Forecast 2024-2028

Published: Jan 2024 162 Pages SKU: IRTNTR77297

Market Overview at a Glance

$138.38 B
Market Opportunity
15.72%
CAGR
14.6
YoY growth 2023-2024(%)

eHealth Software and Services Market Size 2024-2028

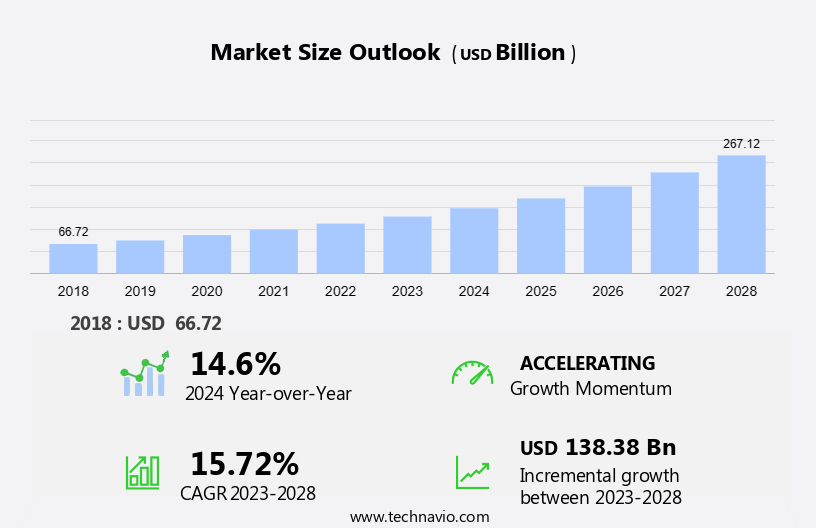
The ehealth software and services market size is forecast to increase by USD 138.38 billion at a CAGR of 15.72% between 2023 and 2028.

  • The market is experiencing significant growth due to the digitization of the healthcare industry. With the increasing adoption of connected devices and technologies, there is a surge In the demand for efficient and effective healthcare solutions. However, the market also faces challenges from open-source service providers, who offer cost-effective alternatives to proprietary software. The trend towards remote patient monitoring and telehealth services is expected to drive market growth, as more patients seek convenient and accessible healthcare options.
  • Additionally, the integration of artificial intelligence and machine learning technologies in healthcare applications is revolutionizing diagnosis and treatment methods, providing personalized care to patients.Overall, the market is poised for robust growth In the coming years, as it addresses the evolving needs of the healthcare industry and consumers.

What will be the Size of the eHealth Software and Services Market During the Forecast Period?

eHealth Software and Services Market Size

 Request Free Sample

  • The market encompasses a range of solutions and services that enable the remote management of health parameters through telemedicine consultation, diagnosis, treatment, prevention, and monitoring. This market is experiencing significant growth due to the increasing demand for patient-centric care, digitization, and the integration of qualitative tools for managing chronic conditions such as diabetes and hypertension. Tele-health and mHealth technologies, including self-monitoring devices for vital signs and physiological parameters like blood pressure and blood sugar levels, are driving innovation in this sector. Regulatory requirements and compliance risks present challenges for market participants, particularly In the areas of Medicaid and R&D expenditures.
  • The market is segmented by specialty, with consultation and diagnosis services leading the way, while treatment and prevention segments are also gaining traction. The market's direction is towards more integrated, automated, and user-friendly solutions that improve access to care and enhance the overall patient experience.

How is this eHealth Software and Services Industry segmented and which is the largest segment?

The ehealth software and services industry research report provides comprehensive data (region-wise segment analysis), with forecasts and estimates in "USD billion" for the period 2024-2028, as well as historical data from 2018-2022 for the following segments.
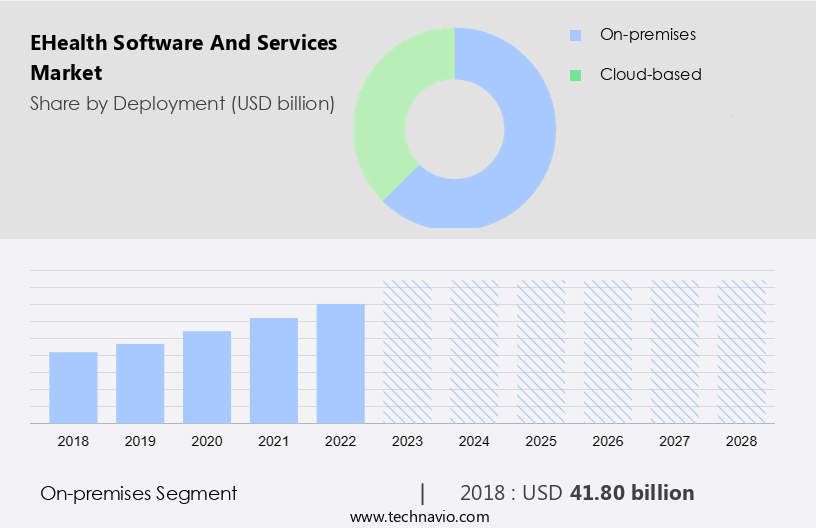
  • Deployment
    • On-premises
    • Cloud-based
  • Type
    • Services
    • Software
  • Geography
    • North America
      • Canada
      • US
    • Europe
      • Germany
      • UK
    • Asia
      • China
    • Rest of World (ROW)

By Deployment Insights

  • The on-premises segment is estimated to witness significant growth during the forecast period.

On-premises deployment of eHealth software and services enables healthcare organizations to host and manage their entire infrastructure withIn their premises, providing them with direct control over hardware, software configurations, and data management. This approach caters to the unique needs and regulatory requirements of certain healthcare environments, particularly those with stringent compliance and security concerns. With on-premises deployment, organizations can customize their eHealth systems to meet specific needs, ensuring regulatory compliance and maintaining data security. This level of control is essential for delivering patient-centric care, digitizing tele-health and mHealth services, and implementing qualitative tools for consultation, diagnosis, treatment, prevention, and monitoring of health parameters such as blood pressure and blood sugar levels.

Despite the initial investment, on-premises deployment offers long-term benefits, including improved patient outcomes, data interoperability, and compliance with regulatory requirements in outpatient care settings. However, healthcare organizations must consider potential legal liabilities and regulatory apprehensions when implementing on-premises eHealth solutions. Insurers, healthcare providers, and payers are increasingly adopting eHealth solutions to enhance patient care and reduce costs In the era of the Affordable Care Act.

eHealth Software and Services Market Size

Get a glance at the market report of various segments Request Free Sample

The On-premises segment was valued at USD 41.80 bn in 2018 and showed a gradual increase during the forecast period.

Regional Analysis

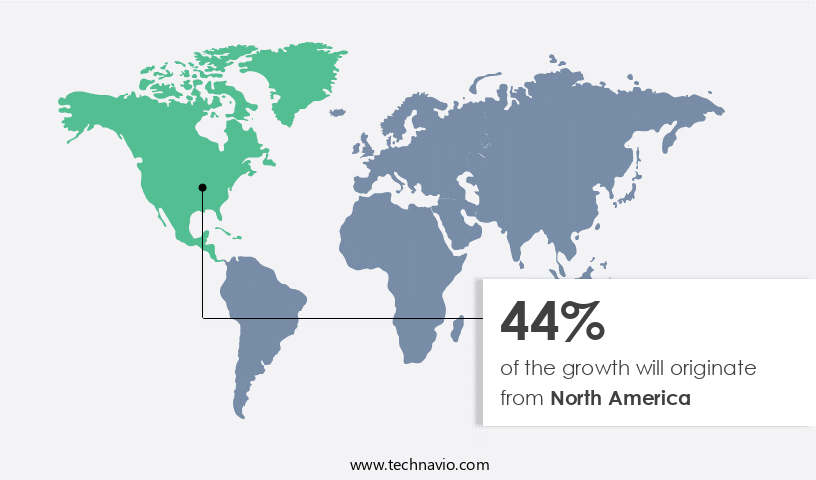
  • North America is estimated to contribute 44% to the growth of the global market during the forecast period.

Technavio's analysts have elaborately explained the regional trends and drivers that shape the market during the forecast period.

eHealth Software and Services Market Share by Geography

For more insights on the market size of various regions, Request Free Sample

The North American the market is a significant contributor to the global industry, driven by stringent regulatory requirements and incentivizing policies. With advanced healthcare IT solutions widely adopted In the US and Canada, these countries lead the region's market growth. Regulatory frameworks mandating the use of eHealth software and services are rigorous in North America. Tele-health, mHealth, and qualitative tools are integral components of this market, enabling remote patient consultation, diagnosis, treatment, and prevention. ERAD, Sectra, Evident, and Allscripts Care Director are notable providers of diagnostic services and monitoring segments, including hypertension, diabetes, and physiological parameters like blood pressure and blood sugar levels.

Insurers, healthcare providers, and payers are key stakeholders in this market, with the Affordable Care Act further boosting its expansion. Data interoperability, patient-centric care, and outpatient care models are critical trends shaping the market's future. Despite regulatory apprehensions and legal liabilities, the market's growth is expected to continue, fueled by the digitization of healthcare services and telemedicine.

Market Dynamics

Our  researchers analyzed the data with 2023 as the base year, along with the key drivers, trends, and challenges. A holistic analysis of drivers will help companies refine their marketing strategies to gain a competitive advantage.

What are the key market drivers leading to the rise In the adoption of eHealth Software and Services Industry?

Growing digitization of healthcare industry is the key driver of the market.

  • The healthcare industry's shift towards digitization is significantly impacting the market for eHealth software and services. Tele-Health and mHealth solutions enable remote consultations, diagnosis, and treatment through advanced devices and technologies. Hospital systems are increasingly adopting these digital tools to manage patient data centrally, enhancing patient-centric care. EPrescribing (eRX), telemedicine services, and electronic intensive care units (eICUs) are leading the charge in this digital transformation. Telemedicine, including Smartphone applications and monitoring services, allows for real-time patient monitoring and consultation, while diagnostic services segment offers advanced diagnostic tools and services. Healthcare providers and payers are investing heavily in R&D expenditures to develop and implement these solutions.
  • Patient outcomes are improved through better monitoring and adherence to treatment plans. However, regulatory requirements and compliance risks pose challenges. In the monitoring segment, self-monitoring devices for health parameters like blood pressure and blood sugar levels are gaining popularity. Specialty areas like hypertension and diabetes are prime targets for these solutions. Diagnostic services segment offers advanced diagnostic tools and services, enabling early detection and intervention. Medicaid and other insurers are increasingly covering telemedicine services, making them more accessible to a wider population. Data interoperability remains a concern, but advancements in technology are addressing these challenges. Outpatient care settings are adopting these digital solutions to improve efficiency and patient care. Healthcare consumers are embracing these services for their convenience and affordability. The Affordable Care Act and regulatory apprehensions present legal liabilities, but the benefits of eHealth software and services far outweigh the risks.

What are the market trends shaping the eHealth Software and Services Industry?

Growing use of connected devices and technologies is the upcoming market trend.

  • The market is experiencing significant growth due to the increasing adoption of tele-Health and mHealth solutions. Telemedicine services enable consultation, diagnosis, and treatment through digital communication channels, while mHealth involves the use of smartphone applications and self-monitoring devices for patient-centric care. Qualitative tools such as Sectra, Evident, and eRAD facilitate data interoperability and regulatory compliance, addressing regulatory requirements and compliance risks. R&D expenditures In the healthcare sector are driving the digitization of healthcare services, including the monitoring segment for physiological parameters like blood pressure, blood sugar levels, and vital signs. Specialty areas like diabetes and hypertension benefit from adherence monitoring and diagnostic services.
  • Insurers, healthcare providers, and healthcare payers are collaborating to offer affordable care act-compliant outpatient care settings, strengthening services through ePrescribing and monitoring services. The Affordable Care Act and regulatory apprehensions necessitate legal liabilities for healthcare organizations, making the adoption of eHealth software and services crucial for patient outcomes. The IoT, including telemedicine and monitoring services, plays a significant role In the market's growth by providing real-time patient data and improving accessibility to healthcare services. The diagnostic services segment is expected to grow due to the increasing demand for accurate and timely diagnosis.

What challenges does the eHealth Software and Services Industry face during its growth?

Threat from open-source service providers is a key challenge affecting the industry growth.

  • The market is witnessing significant growth due to the increasing adoption of tele-Health and mHealth solutions. Telemedicine services, including consultation, diagnosis, treatment, and prevention, are becoming increasingly popular, especially in patient-centric care models. Tele-Health solutions enable the remote monitoring of health parameters such as blood pressure, blood sugar levels, and vital signs using self-monitoring devices and manual methods. Qualitative tools like Sectra, Evident, and eRAD are used for diagnostic services, while Allscripts Care Director focuses on adherence monitoring and outpatient care. R&D expenditures In the healthcare industry are driving the digitization of healthcare services, making regulatory requirements and compliance risks more prominent.
  • Medicaid, healthcare payers, and insurers are investing in eHealth solutions to improve data interoperability and patient outcomes. The affordable care act has further accelerated the adoption of eHealth services in healthcare settings, with healthcare providers and payers embracing telemedicine, smartphone applications, monitoring services, and diagnostic services. The market dynamics are influenced by regulatory apprehensions and legal liabilities, making it essential for companies to ensure compliance with regulatory frameworks. The monitoring segment, including physiological parameters and diagnostic services, is expected to dominate the market due to the increasing demand for remote patient monitoring and early disease detection. Healthcare consumers are becoming more engaged In their healthcare, leading to the strengthening of healthcare services through ePrescribing and other digital solutions.

Exclusive Customer Landscape

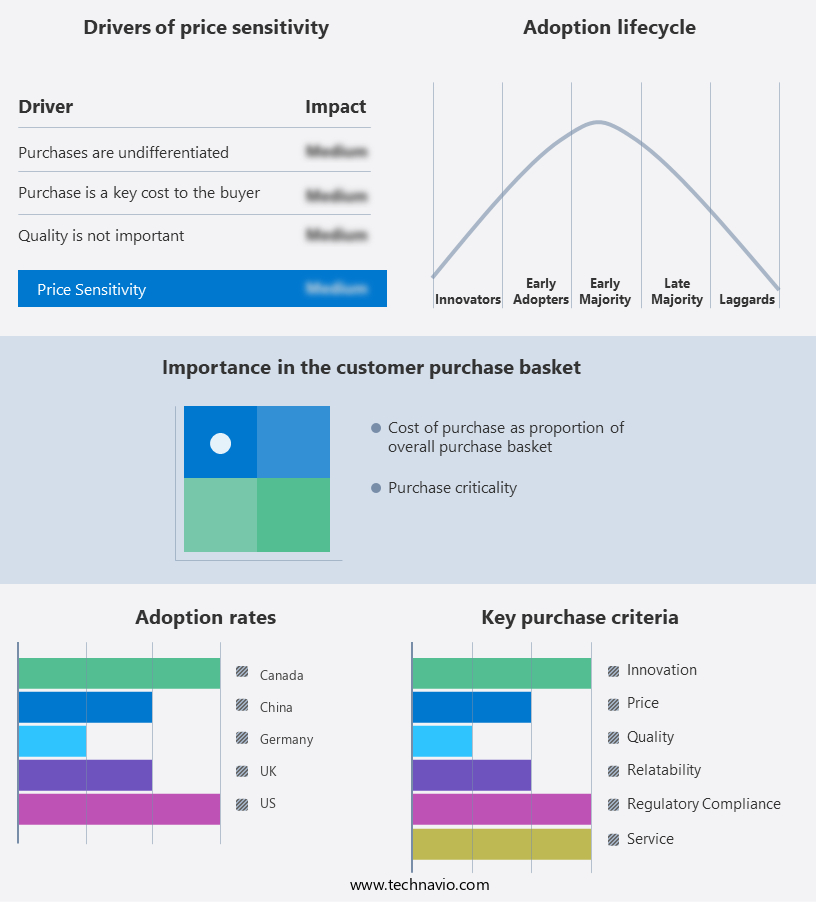
The ehealth software and services market forecasting report includes the adoption lifecycle of the market, covering from the innovator's stage to the laggard's stage. It focuses on adoption rates in different regions based on penetration. Furthermore, the ehealth software and services market report also includes key purchase criteria and drivers of price sensitivity to help companies evaluate and develop their market growth analysis strategies.

eHealth Software and Services Market Share by Geography

 Customer Landscape

Key Companies & Market Insights

Companies are implementing various strategies, such as strategic alliances, ehealth software and services market forecast, partnerships, mergers and acquisitions, geographical expansion, and product/service launches, to enhance their presence In the industry.

AdvancedMD Inc. - The company provides a comprehensive eHealth software and services solution, featuring the AdvancedMD clinical app. This innovative application prioritizes tasks with donuts, offers patient cards, and includes a physician dashboard to streamline practice operations for various roles, thereby enhancing clinical care and fostering a more personalized patient experience.

The industry research and growth report includes detailed analyses of the competitive landscape of the market and information about key companies, including:

  • AdvancedMD Inc.
  • Aerotel Medical Systems Ltd.
  • Alphabet Inc.
  • American Well Corp.
  • Apple Inc.
  • athenahealth Inc.
  • E HealthLine.Com Inc.
  • eHealth Global Technologies Inc.
  • Esaote Spa
  • GE Healthcare Technologies Inc.
  • Included Health Inc.
  • Intelerad Medical Systems Inc.
  • KareXpert Technologies Pvt. Ltd.
  • Konica Minolta Inc.
  • Koninklijke Philips N.V.
  • McKesson Corp.
  • Medisafe Project Ltd.
  • Microsoft Corp.
  • Onex Corp.
  • Oracle Corp.
  • Pro Medicus Ltd.
  • RamSoft Inc.
  • ScImage Inc.
  • Siemens AG
  • Veradigm LLC

Qualitative and quantitative analysis of companies has been conducted to help clients understand the wider business environment as well as the strengths and weaknesses of key industry players. Data is qualitatively analyzed to categorize companies as pure play, category-focused, industry-focused, and diversified; it is quantitatively analyzed to categorize companies as dominant, leading, strong, tentative, and weak.

Research Analyst Overview

The market encompasses a range of tele-health and mHealth solutions designed to enhance patient-centric care and digitize various aspects of healthcare delivery. This dynamic industry is characterized by continuous innovation, driven by the growing demand for efficient, accessible, and cost-effective healthcare solutions. Tele-health and mHealth services enable consultation, diagnosis, treatment, prevention, and monitoring of health parameters outside traditional healthcare settings. These solutions leverage qualitative tools to facilitate remote patient-provider communication and data exchange. The market is witnessing significant investment in Research and Development (R&D) to expand the capabilities of these solutions and address the evolving needs of care providers and healthcare payers.

The shift towards patient-centric care and digitization has led to the proliferation of telemedicine services, which enable the remote monitoring of various health parameters, including blood pressure, blood sugar levels, and vital signs. Self-monitoring devices and smartphone applications play a crucial role in this segment, empowering patients to take an active role in managing their health. The diagnostic services segment of the market is another area of growth, as these solutions enable accurate and timely diagnosis, reducing the need for manual methods and improving overall patient outcomes. Telemedicine and monitoring services are key components of this segment, offering diagnostic services remotely and in real-time.

Regulatory requirements and compliance risks are critical considerations In the market. Ensuring data interoperability and security is essential for maintaining the trust and confidence of healthcare consumers and adhering to regulatory standards. Insurers and healthcare payers are increasingly recognizing the value of these solutions and are investing In their implementation in outpatient care settings. Despite the numerous benefits of eHealth software and services, there are regulatory apprehensions and legal liabilities associated with their use. Healthcare providers must ensure compliance with relevant regulations and standards to mitigate risks and protect patient privacy. The Affordable Care Act and other healthcare strengthening services have further emphasized the importance of these solutions in improving healthcare access and affordability.

In conclusion, the market is a dynamic and innovative industry, driven by the growing demand for efficient, accessible, and cost-effective healthcare solutions. The market is characterized by continuous innovation, driven by the need to address the evolving needs of care providers, healthcare payers, and healthcare consumers. The use of telemedicine services, self-monitoring devices, and diagnostic services is transforming healthcare delivery, enabling remote consultation, diagnosis, treatment, and monitoring of various health parameters. Regulatory requirements and compliance risks are critical considerations in this market, and healthcare providers must ensure compliance with relevant standards to mitigate risks and protect patient privacy.

Market Scope

Report Coverage

Details

Page number

162

Base year

2023

Historic period

2018-2022

Forecast period

2024-2028

Growth momentum & CAGR

Accelerate at a CAGR of 15.72%

Market growth 2024-2028

USD 138.38 billion

Market structure

Fragmented

YoY growth 2023-2024(%)

14.6

Key countries

US, Canada, Germany, UK, and China

Competitive landscape

Leading Companies, Market Positioning of Companies, Competitive Strategies, and Industry Risks

Request Free Sample

What are the Key Data Covered in this eHealth Software and Services Market Research and Growth Report?

  • CAGR of the eHealth Software and Services industry during the forecast period
  • Detailed information on factors that will drive the growth and forecasting between 2024 and 2028
  • Precise estimation of the size of the market and its contribution of the industry in focus to the parent market
  • Accurate predictions about upcoming growth and trends and changes in consumer behaviour
  • Growth of the market across North America, Europe, Asia, and Rest of World (ROW)
  • Thorough analysis of the market's competitive landscape and detailed information about companies
  • Comprehensive analysis of factors that will challenge the ehealth software and services market growth of industry companies

We can help! Our analysts can customize this ehealth software and services market research report to meet your requirements.

Get in touch

1 Executive Summary

  • 1.1 Market overview
    • Exhibit 01: Executive Summary – Chart on Market Overview
    • Exhibit 02: Executive Summary – Data Table on Market Overview
    • Exhibit 03: Executive Summary – Chart on Global Market Characteristics
    • Exhibit 04: Executive Summary – Chart on Market by Geography
    • Exhibit 05: Executive Summary – Chart on Market Segmentation by Deployment
    • Exhibit 06: Executive Summary – Chart on Market Segmentation by Type
    • Exhibit 07: Executive Summary – Chart on Incremental Growth
    • Exhibit 08: Executive Summary – Data Table on Incremental Growth
    • Exhibit 09: Executive Summary – Chart on Vendor Market Positioning

2 Market Landscape

  • 2.1 Market ecosystem
    • Exhibit 10: Parent market
    • Exhibit 11: Market Characteristics

3 Market Sizing

  • 3.1 Market definition
    • Exhibit 12: Offerings of vendors included in the market definition
  • 3.2 Market segment analysis
    • Exhibit 13: Market segments
  • 3.3 Market size 2023
    • 3.4 Market outlook: Forecast for 2023-2028
      • Exhibit 14: Chart on Global - Market size and forecast 2023-2028 ($ billion)
      • Exhibit 15: Data Table on Global - Market size and forecast 2023-2028 ($ billion)
      • Exhibit 16: Chart on Global Market: Year-over-year growth 2023-2028 (%)
      • Exhibit 17: Data Table on Global Market: Year-over-year growth 2023-2028 (%)

    4 Historic Market Size

    • 4.1 Global e-Health software and services market 2018 - 2022
      • Exhibit 18: Historic Market Size – Data Table on global e-health software and services market 2018 - 2022 ($ billion)
    • 4.2 Deployment Segment Analysis 2018 - 2022
      • Exhibit 19: Historic Market Size – Deployment Segment 2018 - 2022 ($ billion)
    • 4.3 Type Segment Analysis 2018 - 2022
      • Exhibit 20: Historic Market Size – Type Segment 2018 - 2022 ($ billion)
    • 4.4 Geography Segment Analysis 2018 - 2022
      • Exhibit 21: Historic Market Size – Geography Segment 2018 - 2022 ($ billion)
    • 4.5 Country Segment Analysis 2018 - 2022
      • Exhibit 22: Historic Market Size – Country Segment 2018 - 2022 ($ billion)

    5 Five Forces Analysis

    • 5.1 Five forces summary
      • Exhibit 23: Five forces analysis - Comparison between 2023 and 2028
    • 5.2 Bargaining power of buyers
      • Exhibit 24: Chart on Bargaining power of buyers – Impact of key factors 2023 and 2028
    • 5.3 Bargaining power of suppliers
      • Exhibit 25: Bargaining power of suppliers – Impact of key factors in 2023 and 2028
    • 5.4 Threat of new entrants
      • Exhibit 26: Threat of new entrants – Impact of key factors in 2023 and 2028
    • 5.5 Threat of substitutes
      • Exhibit 27: Threat of substitutes – Impact of key factors in 2023 and 2028
    • 5.6 Threat of rivalry
      • Exhibit 28: Threat of rivalry – Impact of key factors in 2023 and 2028
    • 5.7 Market condition
      • Exhibit 29: Chart on Market condition - Five forces 2023 and 2028

    6 Market Segmentation by Deployment

    • 6.1 Market segments
      • Exhibit 30: Chart on Deployment - Market share 2023-2028 (%)
      • Exhibit 31: Data Table on Deployment - Market share 2023-2028 (%)
    • 6.2 Comparison by Deployment
      • Exhibit 32: Chart on Comparison by Deployment
      • Exhibit 33: Data Table on Comparison by Deployment
    • 6.3 On-premises - Market size and forecast 2023-2028
      • Exhibit 34: Chart on On-premises - Market size and forecast 2023-2028 ($ billion)
      • Exhibit 35: Data Table on On-premises - Market size and forecast 2023-2028 ($ billion)
      • Exhibit 36: Chart on On-premises - Year-over-year growth 2023-2028 (%)
      • Exhibit 37: Data Table on On-premises - Year-over-year growth 2023-2028 (%)
    • 6.4 Cloud-based - Market size and forecast 2023-2028
      • Exhibit 38: Chart on Cloud-based - Market size and forecast 2023-2028 ($ billion)
      • Exhibit 39: Data Table on Cloud-based - Market size and forecast 2023-2028 ($ billion)
      • Exhibit 40: Chart on Cloud-based - Year-over-year growth 2023-2028 (%)
      • Exhibit 41: Data Table on Cloud-based - Year-over-year growth 2023-2028 (%)
    • 6.5 Market opportunity by Deployment
      • Exhibit 42: Market opportunity by Deployment ($ billion)
      • Exhibit 43: Data Table on Market opportunity by Deployment ($ billion)

    7 Market Segmentation by Type

    • 7.1 Market segments
      • Exhibit 44: Chart on Type - Market share 2023-2028 (%)
      • Exhibit 45: Data Table on Type - Market share 2023-2028 (%)
    • 7.2 Comparison by Type
      • Exhibit 46: Chart on Comparison by Type
      • Exhibit 47: Data Table on Comparison by Type
    • 7.3 Services - Market size and forecast 2023-2028
      • Exhibit 48: Chart on Services - Market size and forecast 2023-2028 ($ billion)
      • Exhibit 49: Data Table on Services - Market size and forecast 2023-2028 ($ billion)
      • Exhibit 50: Chart on Services - Year-over-year growth 2023-2028 (%)
      • Exhibit 51: Data Table on Services - Year-over-year growth 2023-2028 (%)
    • 7.4 Software - Market size and forecast 2023-2028
      • Exhibit 52: Chart on Software - Market size and forecast 2023-2028 ($ billion)
      • Exhibit 53: Data Table on Software - Market size and forecast 2023-2028 ($ billion)
      • Exhibit 54: Chart on Software - Year-over-year growth 2023-2028 (%)
      • Exhibit 55: Data Table on Software - Year-over-year growth 2023-2028 (%)
    • 7.5 Market opportunity by Type
      • Exhibit 56: Market opportunity by Type ($ billion)
      • Exhibit 57: Data Table on Market opportunity by Type ($ billion)

    8 Customer Landscape

    • 8.1 Customer landscape overview
      • Exhibit 58: Analysis of price sensitivity, lifecycle, customer purchase basket, adoption rates, and purchase criteria

    9 Geographic Landscape

    • 9.1 Geographic segmentation
      • Exhibit 59: Chart on Market share by geography 2023-2028 (%)
      • Exhibit 60: Data Table on Market share by geography 2023-2028 (%)
    • 9.2 Geographic comparison
      • Exhibit 61: Chart on Geographic comparison
      • Exhibit 62: Data Table on Geographic comparison
    • 9.3 North America - Market size and forecast 2023-2028
      • Exhibit 63: Chart on North America - Market size and forecast 2023-2028 ($ billion)
      • Exhibit 64: Data Table on North America - Market size and forecast 2023-2028 ($ billion)
      • Exhibit 65: Chart on North America - Year-over-year growth 2023-2028 (%)
      • Exhibit 66: Data Table on North America - Year-over-year growth 2023-2028 (%)
    • 9.4 Europe - Market size and forecast 2023-2028
      • Exhibit 67: Chart on Europe - Market size and forecast 2023-2028 ($ billion)
      • Exhibit 68: Data Table on Europe - Market size and forecast 2023-2028 ($ billion)
      • Exhibit 69: Chart on Europe - Year-over-year growth 2023-2028 (%)
      • Exhibit 70: Data Table on Europe - Year-over-year growth 2023-2028 (%)
    • 9.5 Asia - Market size and forecast 2023-2028
      • Exhibit 71: Chart on Asia - Market size and forecast 2023-2028 ($ billion)
      • Exhibit 72: Data Table on Asia - Market size and forecast 2023-2028 ($ billion)
      • Exhibit 73: Chart on Asia - Year-over-year growth 2023-2028 (%)
      • Exhibit 74: Data Table on Asia - Year-over-year growth 2023-2028 (%)
    • 9.6 Rest of World (ROW) - Market size and forecast 2023-2028
      • Exhibit 75: Chart on Rest of World (ROW) - Market size and forecast 2023-2028 ($ billion)
      • Exhibit 76: Data Table on Rest of World (ROW) - Market size and forecast 2023-2028 ($ billion)
      • Exhibit 77: Chart on Rest of World (ROW) - Year-over-year growth 2023-2028 (%)
      • Exhibit 78: Data Table on Rest of World (ROW) - Year-over-year growth 2023-2028 (%)
    • 9.7 US - Market size and forecast 2023-2028
      • Exhibit 79: Chart on US - Market size and forecast 2023-2028 ($ billion)
      • Exhibit 80: Data Table on US - Market size and forecast 2023-2028 ($ billion)
      • Exhibit 81: Chart on US - Year-over-year growth 2023-2028 (%)
      • Exhibit 82: Data Table on US - Year-over-year growth 2023-2028 (%)
    • 9.8 China - Market size and forecast 2023-2028
      • Exhibit 83: Chart on China - Market size and forecast 2023-2028 ($ billion)
      • Exhibit 84: Data Table on China - Market size and forecast 2023-2028 ($ billion)
      • Exhibit 85: Chart on China - Year-over-year growth 2023-2028 (%)
      • Exhibit 86: Data Table on China - Year-over-year growth 2023-2028 (%)
    • 9.9 Germany - Market size and forecast 2023-2028
      • Exhibit 87: Chart on Germany - Market size and forecast 2023-2028 ($ billion)
      • Exhibit 88: Data Table on Germany - Market size and forecast 2023-2028 ($ billion)
      • Exhibit 89: Chart on Germany - Year-over-year growth 2023-2028 (%)
      • Exhibit 90: Data Table on Germany - Year-over-year growth 2023-2028 (%)
    • 9.10 Canada - Market size and forecast 2023-2028
      • Exhibit 91: Chart on Canada - Market size and forecast 2023-2028 ($ billion)
      • Exhibit 92: Data Table on Canada - Market size and forecast 2023-2028 ($ billion)
      • Exhibit 93: Chart on Canada - Year-over-year growth 2023-2028 (%)
      • Exhibit 94: Data Table on Canada - Year-over-year growth 2023-2028 (%)
    • 9.11 UK - Market size and forecast 2023-2028
      • Exhibit 95: Chart on UK - Market size and forecast 2023-2028 ($ billion)
      • Exhibit 96: Data Table on UK - Market size and forecast 2023-2028 ($ billion)
      • Exhibit 97: Chart on UK - Year-over-year growth 2023-2028 (%)
      • Exhibit 98: Data Table on UK - Year-over-year growth 2023-2028 (%)
    • 9.12 Market opportunity by geography
      • Exhibit 99: Market opportunity by geography ($ billion)
      • Exhibit 100: Data Tables on Market opportunity by geography ($ billion)

    10 Drivers, Challenges, and Trends

    • 10.1 Market drivers
      • 10.2 Market challenges
        • 10.3 Impact of drivers and challenges
          • Exhibit 101: Impact of drivers and challenges in 2023 and 2028
        • 10.4 Market trends

          11 Vendor Landscape

          • 11.1 Overview
            • 11.2 Vendor landscape
              • Exhibit 102: Overview on Criticality of inputs and Factors of differentiation
            • 11.3 Landscape disruption
              • Exhibit 103: Overview on factors of disruption
            • 11.4 Industry risks
              • Exhibit 104: Impact of key risks on business

            12 Vendor Analysis

            • 12.1 Vendors covered
              • Exhibit 105: Vendors covered
            • 12.2 Market positioning of vendors
              • Exhibit 106: Matrix on vendor position and classification
            • 12.3 AdvancedMD Inc.
              • Exhibit 107: AdvancedMD Inc. - Overview
              • Exhibit 108: AdvancedMD Inc. - Product / Service
              • Exhibit 109: AdvancedMD Inc. - Key offerings
            • 12.4 American Well Corp.
              • Exhibit 110: American Well Corp. - Overview
              • Exhibit 111: American Well Corp. - Product / Service
              • Exhibit 112: American Well Corp. - Key offerings
            • 12.5 athenahealth Inc.
              • Exhibit 113: athenahealth Inc. - Overview
              • Exhibit 114: athenahealth Inc. - Product / Service
              • Exhibit 115: athenahealth Inc. - Key offerings
            • 12.6 E HealthLine.Com Inc.
              • Exhibit 116: E HealthLine.Com Inc. - Overview
              • Exhibit 117: E HealthLine.Com Inc. - Product / Service
              • Exhibit 118: E HealthLine.Com Inc. - Key offerings
            • 12.7 eHealth Global Technologies Inc.
              • Exhibit 119: eHealth Global Technologies Inc. - Overview
              • Exhibit 120: eHealth Global Technologies Inc. - Product / Service
              • Exhibit 121: eHealth Global Technologies Inc. - Key offerings
            • 12.8 Esaote Spa
              • Exhibit 122: Esaote Spa - Overview
              • Exhibit 123: Esaote Spa - Product / Service
              • Exhibit 124: Esaote Spa - Key offerings
            • 12.9 GE Healthcare Technologies Inc.
              • Exhibit 125: GE Healthcare Technologies Inc. - Overview
              • Exhibit 126: GE Healthcare Technologies Inc. - Business segments
              • Exhibit 127: GE Healthcare Technologies Inc. - Key offerings
              • Exhibit 128: GE Healthcare Technologies Inc. - Segment focus
            • 12.10 Included Health Inc.
              • Exhibit 129: Included Health Inc. - Overview
              • Exhibit 130: Included Health Inc. - Product / Service
              • Exhibit 131: Included Health Inc. - Key offerings
            • 12.11 KareXpert Technologies Pvt. Ltd.
              • Exhibit 132: KareXpert Technologies Pvt. Ltd. - Overview
              • Exhibit 133: KareXpert Technologies Pvt. Ltd. - Product / Service
              • Exhibit 134: KareXpert Technologies Pvt. Ltd. - Key offerings
            • 12.12 Koninklijke Philips N.V.
              • Exhibit 135: Koninklijke Philips N.V. - Overview
              • Exhibit 136: Koninklijke Philips N.V. - Business segments
              • Exhibit 137: Koninklijke Philips N.V. - Key news
              • Exhibit 138: Koninklijke Philips N.V. - Key offerings
              • Exhibit 139: Koninklijke Philips N.V. - Segment focus
            • 12.13 McKesson Corp.
              • Exhibit 140: McKesson Corp. - Overview
              • Exhibit 141: McKesson Corp. - Business segments
              • Exhibit 142: McKesson Corp. - Key offerings
              • Exhibit 143: McKesson Corp. - Segment focus
            • 12.14 Oracle Corp.
              • Exhibit 144: Oracle Corp. - Overview
              • Exhibit 145: Oracle Corp. - Business segments
              • Exhibit 146: Oracle Corp. - Key news
              • Exhibit 147: Oracle Corp. - Key offerings
              • Exhibit 148: Oracle Corp. - Segment focus
            • 12.15 RamSoft Inc.
              • Exhibit 149: RamSoft Inc. - Overview
              • Exhibit 150: RamSoft Inc. - Product / Service
              • Exhibit 151: RamSoft Inc. - Key offerings
            • 12.16 Siemens AG
              • Exhibit 152: Siemens AG - Overview
              • Exhibit 153: Siemens AG - Business segments
              • Exhibit 154: Siemens AG - Key news
              • Exhibit 155: Siemens AG - Key offerings
              • Exhibit 156: Siemens AG - Segment focus
            • 12.17 Veradigm LLC
              • Exhibit 157: Veradigm LLC - Overview
              • Exhibit 158: Veradigm LLC - Business segments
              • Exhibit 159: Veradigm LLC - Key offerings
              • Exhibit 160: Veradigm LLC - Segment focus

            13 Appendix

            • 13.1 Scope of the report
              • 13.2 Inclusions and exclusions checklist
                • Exhibit 161: Inclusions checklist
                • Exhibit 162: Exclusions checklist
              • 13.3 Currency conversion rates for US$
                • Exhibit 163: Currency conversion rates for US$
              • 13.4 Research methodology
                • Exhibit 164: Research methodology
                • Exhibit 165: Validation techniques employed for market sizing
                • Exhibit 166: Information sources
              • 13.5 List of abbreviations
                • Exhibit 167: List of abbreviations

              Research Methodology

              Technavio presents a detailed picture of the market by way of study, synthesis, and summation of data from multiple sources. The analysts have presented the various facets of the market with a particular focus on identifying the key industry influencers. The data thus presented is comprehensive, reliable, and the result of extensive research, both primary and secondary.

              INFORMATION SOURCES

              Primary sources

              • Manufacturers and suppliers
              • Channel partners
              • Industry experts
              • Strategic decision makers

              Secondary sources

              • Industry journals and periodicals
              • Government data
              • Financial reports of key industry players
              • Historical data
              • Press releases

              DATA ANALYSIS

              Data Synthesis

              • Collation of data
              • Estimation of key figures
              • Analysis of derived insights

              Data Validation

              • Triangulation with data models
              • Reference against proprietary databases
              • Corroboration with industry experts

              REPORT WRITING

              Qualitative

              • Market drivers
              • Market challenges
              • Market trends
              • Five forces analysis

              Quantitative

              • Market size and forecast
              • Market segmentation
              • Geographical insights
              • Competitive landscape

              Interested in this report?

              Get your sample now to see our research methodology and insights!

              Download Now

              Frequently Asked Questions

              eHealth Software and Services market growth will increase by $ 138.38 bn during 2024-2028 .

              The eHealth Software and Services market is expected to grow at a CAGR of 15.72% during 2024-2028 .

              eHealth Software and Services market is segmented by Deployment( On-premises, Cloud-based) Type( Services, Software)

              AdvancedMD Inc., Aerotel Medical Systems Ltd., Alphabet Inc., American Well Corp., Apple Inc., athenahealth Inc., E HealthLine.Com Inc., eHealth Global Technologies Inc., Esaote Spa, GE Healthcare Technologies Inc., Included Health Inc., Intelerad Medical Systems Inc., KareXpert Technologies Pvt. Ltd., Konica Minolta Inc., Koninklijke Philips N.V., McKesson Corp., Medisafe Project Ltd., Microsoft Corp., Onex Corp., Oracle Corp., Pro Medicus Ltd., RamSoft Inc., ScImage Inc., Siemens AG, Veradigm LLC are a few of the key vendors in the eHealth Software and Services market.

              North America will register the highest growth rate of 44% among the other regions. Therefore, the eHealth Software and Services market in North America is expected to garner significant business opportunities for the vendors during the forecast period.

              US, Canada, Germany, UK, China

              • Growing digitization of healthcare industryWith the digitization trend changing the market landscape in various industries is the driving factor this market.
              • the healthcare industry is also embracing this change and is moving toward eHealth software and services. In eHealth software and services is the driving factor this market.
              • healthcare services such as prescriptions is the driving factor this market.
              • appointments is the driving factor this market.
              • and even diagnoses are made remotely with the use of the latest devices and technologies. This digital health trend is also driving the demand for eHealth software and services as more hospital systems turn digital and use eHealth software and services to collect and store data from different ends in a centralized place. Electronic prescribing (eRX) is the driving factor this market.
              • mHealth is the driving factor this market.
              • and electronic intensive care units (eICUs) are all examples of how digitization is changing the healthcare industry landscape. In eRX is the driving factor this market.
              • the medical prescription is converted into a digital format is the driving factor this market.
              • stored in an EHR system is the driving factor this market.
              • and then can be accessed easily through mobile devices or other wireless devices. E-prescriptions reduce medication errors and ensure the safety of patients. As e-prescriptions are convenient for both doctors and patients is the driving factor this market.
              • their adoption will increase during the forecast period is the driving factor this market.
              • positively impacting the adoption of eHealth software and services as well. Similarly is the driving factor this market.
              • the growing adoption of mHealth technologies is another significant factor that will contribute to the growth of the global eHealth software and services market during the forecast period. With the rising penetration of smartphones and the Internet is the driving factor this market.
              • the demand for mHealth technologies is also rising as consumers are using mHealth technologies and supporting apps to track and manage their health data. This data would be helpful in the long run; hence is the driving factor this market.
              • it should be stored in a centralized place to be accessed by physicians is the driving factor this market.
              • patients is the driving factor this market.
              • and insurance companies. Hence is the driving factor this market.
              • with the use of eHealth software and services is the driving factor this market.
              • healthcare professionals can also easily access patient information and diagnose diseases through mHealth apps on smartphones. Moreover is the driving factor this market.
              • mHealth technologies are being used by hospitals and clinics to improve their workflow efficiency and disseminate essential medical information among healthcare professionals. Factors such as the rising geriatric population is the driving factor this market.
              • increasing prevalence of chronic diseases is the driving factor this market.
              • and the shortage of primary healthcare facilities have increased the need for information sharing. Moreover is the driving factor this market.
              • as remote monitoring and diagnostic services become important is the driving factor this market.
              • hospitals will increase the adoption of eHealth software and services is the driving factor this market.
              • which will make the entire process much easier and quicker. Owing to all these factors is the driving factor this market.
              • the adoption of eHealth software and services will rise during the forecast period is the driving factor this market.
              • thereby driving the growth of the global eHealth software and services market during the forecast period. is the driving factor this market.

              The eHealth Software and Services market vendors should focus on grabbing business opportunities from the On-premises segment as it accounted for the largest market share in the base year.