Embedded Products Market Analysis, Size, and Forecast 2024-2028: North America (US, Canada), Europe (Germany, UK, Italy, France), APAC (China, India, Japan), South America (Brazil), Middle East & Africa

Embedded Products Market Analysis, Size, and Forecast 2024-2028:
North America (US, Canada), Europe (Germany, UK, Italy, France), APAC (China, India, Japan), South America (Brazil), Middle East & Africa

Published: Aug 2024 188 Pages SKU: IRTNTR71155

Market Overview at a Glance

$99.2 B
Market Opportunity
6.79%
CAGR
6.23
YoY growth 2023-2024(%)

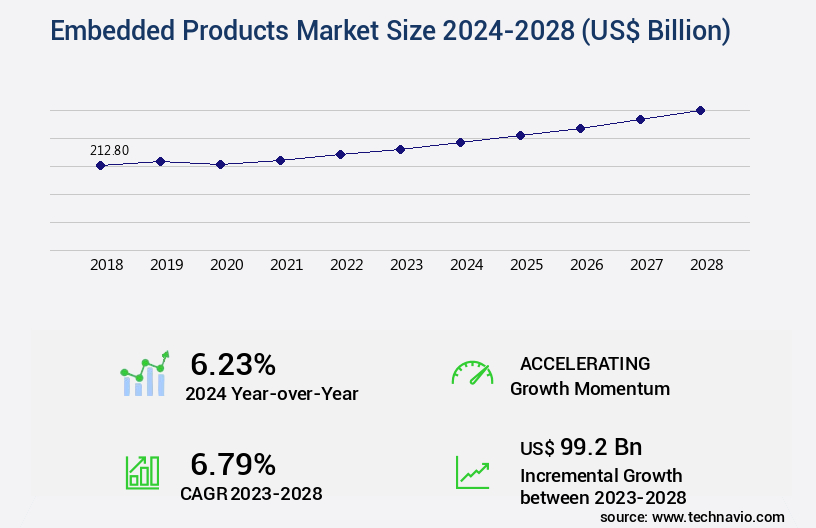
Embedded Products Market Size 2024-2028

The embedded products market size is valued to increase USD 99.2 billion, at a CAGR of 6.79% from 2023 to 2028. Demand for smart appliances will drive the embedded products market.

Major Market Trends & Insights

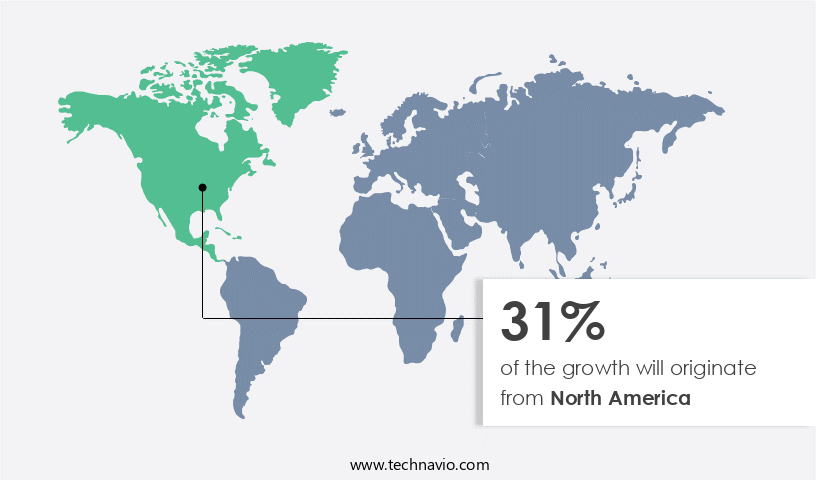
  • North America dominated the market and accounted for a 31% growth during the forecast period.
  • By Application - Consumer electronics segment was valued at USD 77.20 billion in 2022
  • By Product - Hardware segment accounted for the largest market revenue share in 2022

Market Size & Forecast

  • Market Opportunities: USD 66.54 billion
  • Market Future Opportunities: USD 99.20 billion
  • CAGR : 6.79%
  • North America: Largest market in 2022

Market Summary

  • The market encompasses a dynamic and ever-evolving landscape of technologies and applications. Core technologies, such as the Internet of Things (IoT) and artificial intelligence (AI), are driving the development of advanced embedded products. For instance, the demand for smart appliances is on the rise, with IoT technology enabling these devices to connect and communicate with each other and their users. Additionally, the emergence of 5G-based embedded devices is poised to revolutionize industries by providing faster connectivity and enabling real-time data processing.
  • However, challenges persist, including the high energy consumption of compact embedded products and the need for stringent regulations to ensure data security and privacy. According to a recent report, the global market share for embedded systems is projected to reach 35% by 2026, highlighting the significant growth potential in this sector.

What will be the Size of the Embedded Products Market during the forecast period?

Embedded Products Market Size

Get Key Insights on Market Forecast (PDF) Request Free Sample

How is the Embedded Products Market Segmented and what are the key trends of market segmentation?

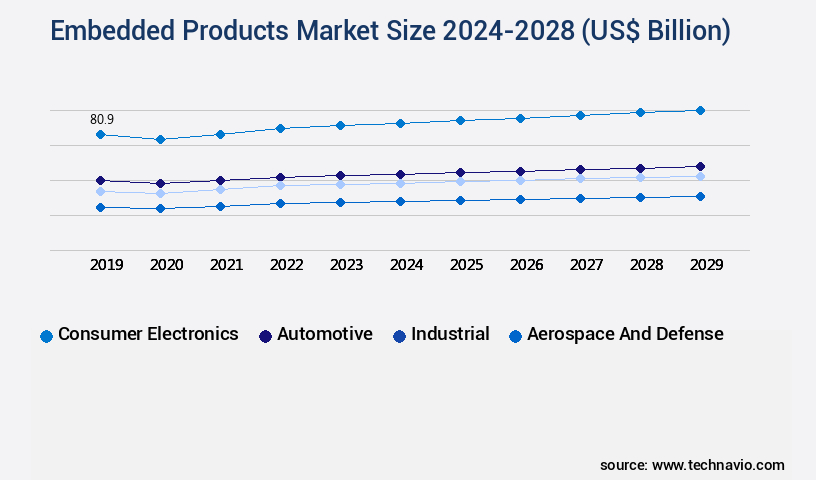
The embedded products industry research report provides comprehensive data (region-wise segment analysis), with forecasts and estimates in "USD billion" for the period 2024-2028, as well as historical data from 2018-2022 for the following segments.

  • Application
    • Consumer electronics
    • Automotive
    • Industrial
    • Aerospace and defense
    • Others
  • Product
    • Hardware
    • Software
  • Functionality
    • Real-Time Embedded Systems
    • Standalone Embedded Systems
    • Networked Embedded Systems
    • Mobile Embedded Systems
  • System Size
    • Small-scale
    • Medium-scale
    • Large-scale
  • End User
    • Commercial
    • Residential
    • Government and Defense
  • Geography
    • North America
      • US
      • Canada
    • Europe
      • France
      • Germany
      • Italy
      • UK
    • Middle East and Africa
      • Egypt
      • KSA
      • Oman
      • UAE
    • APAC
      • China
      • India
      • Japan
    • South America
      • Argentina
      • Brazil
    • Rest of World (ROW)

By Application Insights

The consumer electronics segment is estimated to witness significant growth during the forecast period.

Embedded products play a pivotal role in various sectors, including agriculture. These advanced technologies are revolutionizing farming practices by enhancing phosphorus utilization, improving soil structure, and enabling disease resistance mechanisms. Gene expression analysis and crop stress mitigation are crucial applications, enabling farmers to optimize resources and boost yields. Moreover, embedded products facilitate plant-microbe interactions and plant hormone biosynthesis, contributing to soil health improvement. Remote sensing applications offer valuable insights into microbial community analysis and yield prediction models, while microbial interactions and carbon sequestration potential promote agricultural sustainability. Precision farming technologies, such as sensor data integration, plant growth promotion, and growth modeling techniques, have gained significant traction.

Automation in agriculture, including enzyme activity assays and integrated pest management, further enhances efficiency and productivity. The market for embedded agricultural products is expected to grow substantially, with an estimated 30% of farmers adopting these technologies by 2025. Additionally, the market is projected to expand by 25% in the next five years, driven by the increasing demand for resource optimization systems, in-field diagnostics, and rhizosphere microbiome analysis. Water use efficiency, potassium management, and environmental impact assessment are other key areas of growth, with farmers seeking to minimize waste and maximize yields while reducing their carbon footprint. The integration of advanced technologies, such as metabolite profiling techniques and root colonization dynamics, is expected to further drive market expansion.

In conclusion, the market in agriculture is evolving rapidly, with numerous applications and innovations shaping the industry. From phosphorus utilization to yield optimization strategies, these advanced technologies are transforming farming practices and enhancing agricultural sustainability.

Embedded Products Market Size

Request Free Sample

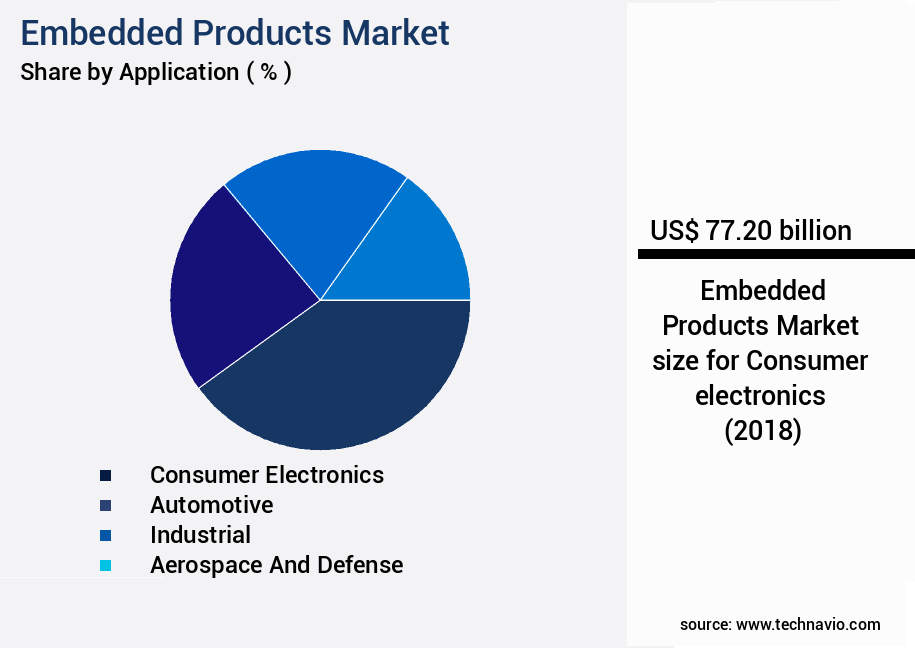
The Consumer electronics segment was valued at USD 77.20 billion in 2018 and showed a gradual increase during the forecast period.

Embedded Products Market Size

Request Free Sample

Regional Analysis

North America is estimated to contribute 31% to the growth of the global market during the forecast period.Technavio's analysts have elaborately explained the regional trends and drivers that shape the market during the forecast period.

Embedded Products Market Share by Geography

See How Embedded Products Market Demand is Rising in North America Request Free Sample

In North America, the market experiences significant expansion due to several key factors. Primarily, there is a heightened demand for quicker time-to-market and cost reduction in manufacturing processes. Additionally, managing complex control systems more efficiently is a significant driver. The adoption of tablets and netbooks in the industrial sector further propels market growth in this region. The United States, as a leading country in North America, is a global pioneer in research, innovation, design, manufacture, branding, and marketing of electronic consumer goods.

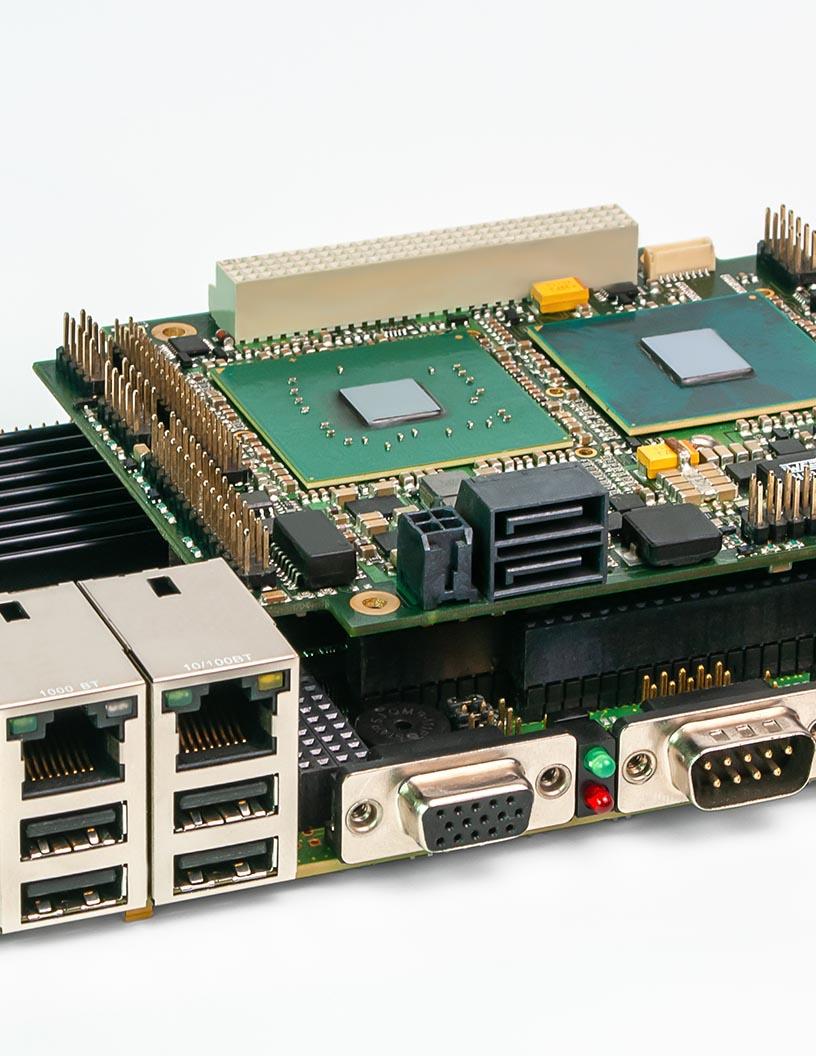
Embedded products are integral to various electronics, including those used in automobiles, telephones, modems, home appliances, toys, security systems, pacemakers, set-top boxes, and digital watches.

Market Dynamics

Our researchers analyzed the data with 2023 as the base year, along with the key drivers, trends, and challenges. A holistic analysis of drivers will help companies refine their marketing strategies to gain a competitive advantage.

The market plays a pivotal role in enhancing nutrient uptake efficiency and improving water use efficiency in crops, thereby contributing to sustainable agricultural practices. This market encompasses various technologies, including those that optimize fertilizer application rates, mitigate crop stress using technology, predict crop yields using data analytics, and assess soil health using remote sensing. Moreover, monitoring plant health using sensors and developing effective pest control strategies are integral components of this market. The implementation of disease management practices and applying biotechnology solutions in agriculture are also key areas of focus. Furthermore, using data-driven decision support systems and developing precision agriculture tools are essential for optimizing irrigation scheduling strategies and modeling plant growth and development.

Notably, investigating plant-microbe interactions and analyzing microbial community composition are emerging trends in the market. These approaches aim to improve nitrogen use efficiency techniques and enhancing phosphorus utilization in plants, as well as improving soil structure and organic matter. Compared to traditional farming methods, the adoption of embedded products has shown significant advancements. For instance, more than 70% of new product developments in the agricultural technology sector focus on precision agriculture. This segment accounts for a significantly larger share than the academic segment, indicating a clear industry trend towards commercialization and implementation of these technologies. In conclusion, the market is a dynamic and evolving landscape, driven by the need for sustainable agricultural practices and technological advancements.

Its impact on enhancing nutrient uptake efficiency, improving water use efficiency, optimizing fertilizer application rates, and mitigating crop stress using technology is substantial and continues to grow.

Embedded Products Market Size

What are the key market drivers leading to the rise in the adoption of Embedded Products Industry?

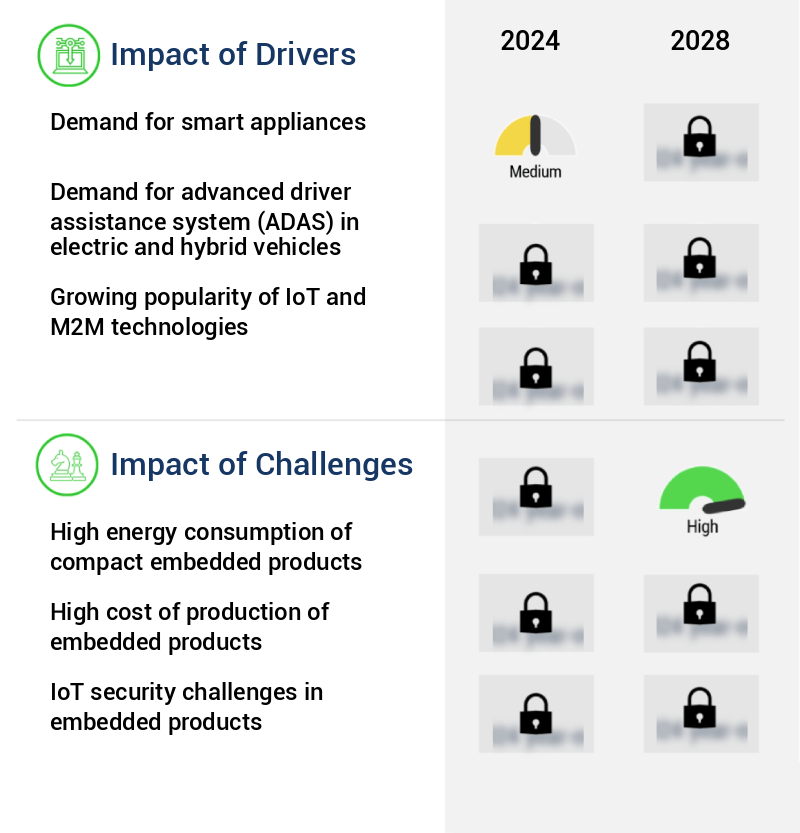
  • The significant demand for smart appliances serves as the primary market driver. 
  • In the ever-evolving digital landscape, smart electronic systems have become a significant trend, integrating Internet connectivity to enhance user experiences. These systems, including in-house security infrastructure such as automated door locks, are increasingly common in sectors like home automation. Google Home, Amazon Echo, and Apple HomeKit are prime examples of smart home applications. In the recent market activity, Amazon introduced Echo Dot with Clock and Echo Glow. The former is a speaker equipped with additional features, like a digital clock and a touch-sensitive top.
  • The latter is a smart home lamp that can be activated and color-customized. The integration of software-controlled ICs is essential for the hardware functions of these systems. The market for smart electronic systems continues to expand, with numerous applications and advancements.

What are the market trends shaping the Embedded Products Industry?

  • The development of 5G-based embedded devices is a mandated market trend that is on the rise. (Alternatively,) The rising trend in the market is the development of 5G-enabled embedded devices.
  • During the forecasted years, the embedded goods market is poised to experience significant advancements due to the integration of 5G technology. According to the Global System for Mobile Communications (GSMA), the 5G industry is projected to generate approximately 5.3% of the global GDP growth by 2034, equating to USD2.2 trillion. This economic impact will significantly enhance the production capacity of embedded goods. In the realm of smart video surveillance systems in automobiles, 5G's quick response times enable seamless functionality. Moreover, 5G's capability to facilitate rapid image processing will address the challenges posed by industrial automation and smart farming.

What challenges does the Embedded Products Industry face during its growth?

  • The high energy consumption of compact embedded products poses a significant challenge to the industry's growth, necessitating continuous research and development efforts to create more energy-efficient solutions. 
  • Embedded systems, which integrate multiple functionalities into compact devices, face a significant challenge due to their high energy consumption. This issue arises from the complexity of their design architectures. The energy consumption of embedded products is sensitive to temperature, increasing as the device warms up. Consequently, this negatively impacts the overall performance and lifecycle of these products. As the market for embedded systems continues to evolve, addressing this challenge becomes increasingly important. The energy consumption issue is a pressing concern across various sectors, including automotive, healthcare, and industrial automation.
  • To mitigate this challenge, researchers and manufacturers are exploring energy-efficient design techniques and technologies, such as low-power processors and energy harvesting systems. This proactive approach is expected to drive innovation and growth in the market.

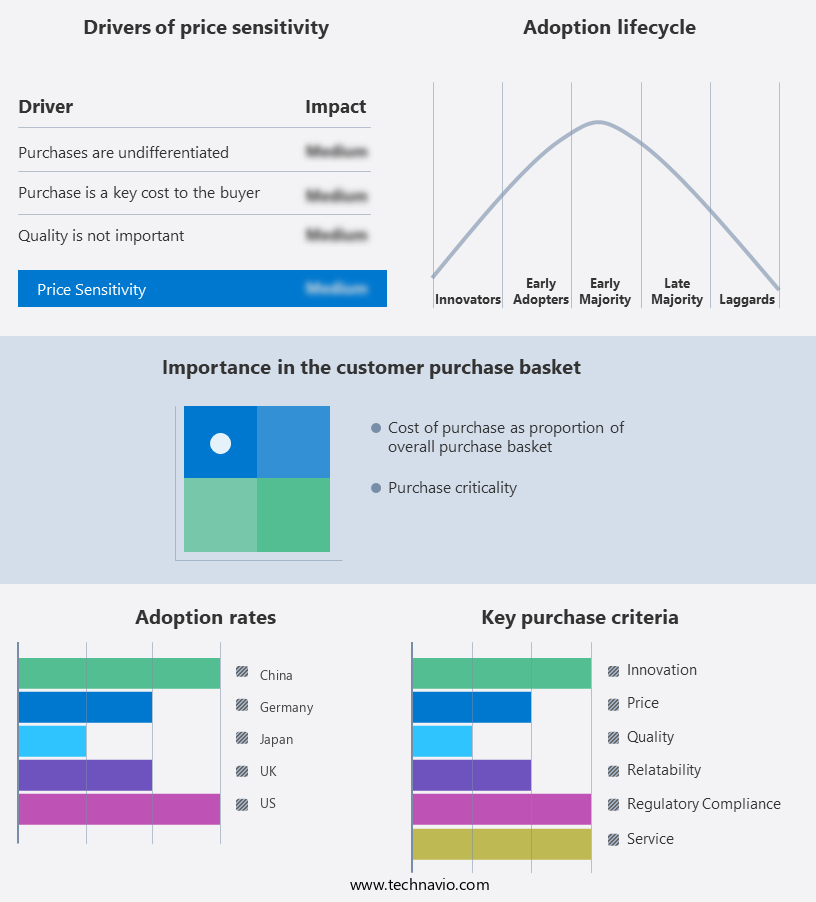
Exclusive Technavio Analysis on Customer Landscape

The embedded products market forecasting report includes the adoption lifecycle of the market, covering from the innovator's stage to the laggard's stage. It focuses on adoption rates in different regions based on penetration. Furthermore, the embedded products market report also includes key purchase criteria and drivers of price sensitivity to help companies evaluate and develop their market growth analysis strategies.

Embedded Products Market Share by Geography

 Customer Landscape of Embedded Products Industry

Competitive Landscape

Companies are implementing various strategies, such as strategic alliances, embedded products market forecast, partnerships, mergers and acquisitions, geographical expansion, and product/service launches, to enhance their presence in the industry.

Advantech Co. Ltd. - This company specializes in providing embedded solutions, including EPC S201, EPC S101, EPC S202, EPC T1215, and EPC T1217. These offerings enhance product functionality and efficiency, catering to diverse industries and applications. As a research analyst, I observe the company's innovative approach to delivering advanced technology, setting it apart in the competitive market.

The industry research and growth report includes detailed analyses of the competitive landscape of the market and information about key companies, including:

  • Advantech Co. Ltd.
  • AMETEK Inc.
  • ARBOR Technology Corp.
  • ASUSTeK Computer Inc.
  • Axiomtek Co. Ltd.
  • congatec GmbH
  • Curtiss Wright Corp
  • Digi International Inc.
  • EUROTECH Spa
  • Fujitsu Ltd.
  • Intel Corp.
  • Kontron AG
  • NVIDIA Corp.
  • NXP Semiconductors NV
  • Qualcomm Inc.
  • Radisys Corp.
  • SMART Global Holdings Inc.
  • Super Micro Computer Inc.
  • TechNexion Ltd.
  • Texas Instruments Inc.
  • Toradex AG

Qualitative and quantitative analysis of companies has been conducted to help clients understand the wider business environment as well as the strengths and weaknesses of key industry players. Data is qualitatively analyzed to categorize companies as pure play, category-focused, industry-focused, and diversified; it is quantitatively analyzed to categorize companies as dominant, leading, strong, tentative, and weak.

Recent Development and News in Embedded Products Market

  • In January 2024, Intel Corporation announced the launch of its new Embedded Atom processor series, designed specifically for edge computing applications in IoT devices and industrial automation systems (Intel press release). In March 2024, Microsoft and Amazon Web Services (AWS) formed a strategic partnership to integrate Microsoft's Azure IoT services with AWS's Greengrass platform, enabling seamless edge-to-cloud connectivity for embedded systems (Microsoft news center).
  • In April 2024, NXP Semiconductors completed the acquisition of Marvell's Wi-Fi, Bluetooth, and Zigbee connectivity business for approximately USD1.8 billion, significantly expanding its portfolio in wireless connectivity solutions for embedded products (NXP Semiconductors press release). In May 2025, the European Union passed the Digital Services Act, which includes regulations for ensuring cybersecurity and data protection in embedded systems, setting new standards for the industry (European Commission press release).

Dive into Technavio's robust research methodology, blending expert interviews, extensive data synthesis, and validated models for unparalleled Embedded Products Market insights. See full methodology.

Market Scope

Report Coverage

Details

Page number

188

Base year

2023

Historic period

2018-2022

Forecast period

2024-2028

Growth momentum & CAGR

Accelerate at a CAGR of 6.79%

Market growth 2024-2028

USD 99.2 billion

Market structure

Fragmented

YoY growth 2023-2024(%)

6.23

Key countries

US, Canada, Germany, UK, Italy, France, China, India, Japan, Brazil, Egypt, UAE, Oman, Argentina, and KSA

Competitive landscape

Leading Companies, Market Positioning of Companies, Competitive Strategies, and Industry Risks

Request Free Sample

Research Analyst Overview

  • The market encompasses a diverse range of innovations transforming agriculture, with a focus on enhancing phosphorus utilization, improving soil structure, and bolstering disease resistance mechanisms. These advancements are achieved through various means, including gene expression analysis, crop stress mitigation, and plant-microbe interactions. Phosphorus utilization is a critical concern, with the market responding with solutions that optimize this essential nutrient's absorption and reduce losses. Soil health improvement is another priority, with technologies addressing soil structure and organic matter improvement, as well as carbon sequestration potential. Remote sensing applications play a significant role, enabling yield prediction models and in-field diagnostics, while precision farming technologies integrate sensor data and automation to optimize water use efficiency and potassium management.
  • Rhizosphere microbiome analysis is a key area of research, shedding light on microbial community dynamics and plant growth promotion. Microbial interactions and enzyme activity assays are essential components of integrated pest management strategies, contributing to nutrient uptake enhancement and nitrogen use efficiency. Plant hormone biosynthesis and growth modeling techniques further support yield optimization strategies, while metabolite profiling and root colonization dynamics provide valuable insights into plant health and resource optimization systems. Environmental impact assessment is a growing concern, with the market responding with solutions that minimize the agricultural sector's footprint. These advancements include water use efficiency, potassium management, and automation in agriculture.
  • Overall, the market continues to evolve, addressing the complex challenges of agricultural sustainability through data-driven decision support and innovative technologies.

What are the Key Data Covered in this Embedded Products Market Research and Growth Report?

  • What is the expected growth of the Embedded Products Market between 2024 and 2028?

    • USD 99.2 billion, at a CAGR of 6.79%

  • What segmentation does the market report cover?

    • The report segmented by Application (Consumer electronics, Automotive, Industrial, Aerospace and defense, and Others), Product (Hardware and Software), Geography (North America, APAC, Europe, South America, and Middle East and Africa), Functionality (Real-Time Embedded Systems, Standalone Embedded Systems, Networked Embedded Systems, Mobile Embedded Systems, Real-Time Embedded Systems, Standalone Embedded Systems, Networked Embedded Systems, and Mobile Embedded Systems), System Size (Small-scale, Medium-scale, Large-scale, Small-scale, Medium-scale, and Large-scale), and End User (Commercial, Residential, Government and Defense, Commercial, Residential, and Government and Defense)

  • Which regions are analyzed in the report?

    • North America, APAC, Europe, South America, and Middle East and Africa

  • What are the key growth drivers and market challenges?

    • Demand for smart appliances, High energy consumption of compact embedded products

  • Who are the major players in the Embedded Products Market?

    • Key Companies Advantech Co. Ltd., AMETEK Inc., ARBOR Technology Corp., ASUSTeK Computer Inc., Axiomtek Co. Ltd., congatec GmbH, Curtiss Wright Corp, Digi International Inc., EUROTECH Spa, Fujitsu Ltd., Intel Corp., Kontron AG, NVIDIA Corp., NXP Semiconductors NV, Qualcomm Inc., Radisys Corp., SMART Global Holdings Inc., Super Micro Computer Inc., TechNexion Ltd., Texas Instruments Inc., and Toradex AG

Market Research Insights

  • The market encompasses a diverse range of technologies and applications, including fertilizer application optimization, pest control strategies, and economic optimization models, among others. According to recent estimates, the market for precision agriculture tools, such as crop modeling approaches and yield mapping techniques, is projected to reach USD12.5 billion by 2025, representing a compound annual growth rate of 11.5%. In contrast, the market for agricultural robotics, including farm management software and irrigation scheduling optimization, is projected to reach USD22.5 billion by the same year, growing at a faster rate of 13.5%. These figures underscore the significant potential for innovation and growth in the market, with applications spanning from proteomics studies and plant stress physiology to biofertilizer application and environmental monitoring tools.
  • The integration of data analytics platforms, nutrient delivery systems, and controlled release technology is driving the development of sustainable agriculture practices, while genetic engineering approaches and functional genomics analysis offer new opportunities for crop modeling and disease management practices. Resource allocation models and soil amendment strategies are also gaining traction, as farmers seek to optimize their operations and improve crop yields in a resource-constrained world.

We can help! Our analysts can customize this embedded products market research report to meet your requirements.

Get in touch

1 Executive Summary

  • 1.1 Market overview
    • Executive Summary - Chart on Market Overview
    • Executive Summary - Data Table on Market Overview
    • Executive Summary - Chart on Global Market Characteristics
    • Executive Summary - Chart on Market by Geography
    • Executive Summary - Chart on Market Segmentation by Application
    • Executive Summary - Chart on Market Segmentation by Product
    • Executive Summary - Chart on Incremental Growth
    • Executive Summary - Data Table on Incremental Growth
    • Executive Summary - Chart on Company Market Positioning

2 Market Landscape

  • 2.1 Market ecosystem
    • Parent Market
    • Data Table on - Parent Market
  • 2.2 Market characteristics
    • Market characteristics analysis
  • 2.3 Value chain analysis
    • Value Chain Analysis

3 Market Sizing

  • 3.1 Market definition
    • Offerings of companies included in the market definition
  • 3.2 Market segment analysis
    • Market segments
  • 3.3 Market size 2023
    • 3.4 Market outlook: Forecast for 2023-2028
      • Chart on Global - Market size and forecast 2023-2028 ($ billion)
      • Data Table on Global - Market size and forecast 2023-2028 ($ billion)
      • Chart on Global Market: Year-over-year growth 2023-2028 (%)
      • Data Table on Global Market: Year-over-year growth 2023-2028 (%)

    4 Historic Market Size

    • 4.1 Global Embedded Products Market 2018 - 2022
      • Historic Market Size - Data Table on Global Embedded Products Market 2018 - 2022 ($ billion)
    • 4.2 Application segment analysis 2018 - 2022
      • Historic Market Size - Application Segment 2018 - 2022 ($ billion)
    • 4.3 Product segment analysis 2018 - 2022
      • Historic Market Size - Product Segment 2018 - 2022 ($ billion)
    • 4.4 Geography segment analysis 2018 - 2022
      • Historic Market Size - Geography Segment 2018 - 2022 ($ billion)
    • 4.5 Country segment analysis 2018 - 2022
      • Historic Market Size - Country Segment 2018 - 2022 ($ billion)

    5 Five Forces Analysis

    • 5.1 Five forces summary
      • Five forces analysis - Comparison between 2023 and 2028
    • 5.2 Bargaining power of buyers
      • Bargaining power of buyers - Impact of key factors 2023 and 2028
    • 5.3 Bargaining power of suppliers
      • Bargaining power of suppliers - Impact of key factors in 2023 and 2028
    • 5.4 Threat of new entrants
      • Threat of new entrants - Impact of key factors in 2023 and 2028
    • 5.5 Threat of substitutes
      • Threat of substitutes - Impact of key factors in 2023 and 2028
    • 5.6 Threat of rivalry
      • Threat of rivalry - Impact of key factors in 2023 and 2028
    • 5.7 Market condition
      • Chart on Market condition - Five forces 2023 and 2028

    6 Market Segmentation by Application

    • 6.1 Market segments
      • Chart on Application - Market share 2023-2028 (%)
      • Data Table on Application - Market share 2023-2028 (%)
    • 6.2 Comparison by Application
      • Chart on Comparison by Application
      • Data Table on Comparison by Application
    • 6.3 Consumer electronics - Market size and forecast 2023-2028
      • Chart on Consumer electronics - Market size and forecast 2023-2028 ($ billion)
      • Data Table on Consumer electronics - Market size and forecast 2023-2028 ($ billion)
      • Chart on Consumer electronics - Year-over-year growth 2023-2028 (%)
      • Data Table on Consumer electronics - Year-over-year growth 2023-2028 (%)
    • 6.4 Automotive - Market size and forecast 2023-2028
      • Chart on Automotive - Market size and forecast 2023-2028 ($ billion)
      • Data Table on Automotive - Market size and forecast 2023-2028 ($ billion)
      • Chart on Automotive - Year-over-year growth 2023-2028 (%)
      • Data Table on Automotive - Year-over-year growth 2023-2028 (%)
    • 6.5 Industrial - Market size and forecast 2023-2028
      • Chart on Industrial - Market size and forecast 2023-2028 ($ billion)
      • Data Table on Industrial - Market size and forecast 2023-2028 ($ billion)
      • Chart on Industrial - Year-over-year growth 2023-2028 (%)
      • Data Table on Industrial - Year-over-year growth 2023-2028 (%)
    • 6.6 Aerospace and defense - Market size and forecast 2023-2028
      • Chart on Aerospace and defense - Market size and forecast 2023-2028 ($ billion)
      • Data Table on Aerospace and defense - Market size and forecast 2023-2028 ($ billion)
      • Chart on Aerospace and defense - Year-over-year growth 2023-2028 (%)
      • Data Table on Aerospace and defense - Year-over-year growth 2023-2028 (%)
    • 6.7 Others - Market size and forecast 2023-2028
      • Chart on Others - Market size and forecast 2023-2028 ($ billion)
      • Data Table on Others - Market size and forecast 2023-2028 ($ billion)
      • Chart on Others - Year-over-year growth 2023-2028 (%)
      • Data Table on Others - Year-over-year growth 2023-2028 (%)
    • 6.8 Market opportunity by Application
      • Market opportunity by Application ($ billion)
      • Data Table on Market opportunity by Application ($ billion)

    7 Market Segmentation by Product

    • 7.1 Market segments
      • Chart on Product - Market share 2023-2028 (%)
      • Data Table on Product - Market share 2023-2028 (%)
    • 7.2 Comparison by Product
      • Chart on Comparison by Product
      • Data Table on Comparison by Product
    • 7.3 Hardware - Market size and forecast 2023-2028
      • Chart on Hardware - Market size and forecast 2023-2028 ($ billion)
      • Data Table on Hardware - Market size and forecast 2023-2028 ($ billion)
      • Chart on Hardware - Year-over-year growth 2023-2028 (%)
      • Data Table on Hardware - Year-over-year growth 2023-2028 (%)
    • 7.4 Software - Market size and forecast 2023-2028
      • Chart on Software - Market size and forecast 2023-2028 ($ billion)
      • Data Table on Software - Market size and forecast 2023-2028 ($ billion)
      • Chart on Software - Year-over-year growth 2023-2028 (%)
      • Data Table on Software - Year-over-year growth 2023-2028 (%)
    • 7.5 Market opportunity by Product
      • Market opportunity by Product ($ billion)
      • Data Table on Market opportunity by Product ($ billion)

    8 Market Segmentation by Functionality

    • 8.1 Market segments
      • Chart on Functionality - Market share (2023-2028) (%)
      • Data Table on Functionality - Market share (2023-2028) (%)
    • 8.2 Comparison by Functionality
      • Chart on Comparison by Functionality
      • Data Table on Comparison by Functionality
    • 8.3 Real-Time Embedded Systems - Market size and forecast (2023-2028)
      • Chart on Real-Time Embedded Systems - Market size and forecast (2023-2028) ($ million)
      • Data Table on Real-Time Embedded Systems - Market size and forecast (2023-2028) ($ million)
      • Chart on Real-Time Embedded Systems - Year-over-year growth (2023-2028) (%)
      • Data Table on Real-Time Embedded Systems - Year-over-year growth (2023-2028) (%)
    • 8.4 Standalone Embedded Systems - Market size and forecast (2023-2028)
      • Chart on Standalone Embedded Systems - Market size and forecast (2023-2028) ($ million)
      • Data Table on Standalone Embedded Systems - Market size and forecast (2023-2028) ($ million)
      • Chart on Standalone Embedded Systems - Year-over-year growth (2023-2028) (%)
      • Data Table on Standalone Embedded Systems - Year-over-year growth (2023-2028) (%)
    • 8.5 Networked Embedded Systems - Market size and forecast (2023-2028)
      • Chart on Networked Embedded Systems - Market size and forecast (2023-2028) ($ million)
      • Data Table on Networked Embedded Systems - Market size and forecast (2023-2028) ($ million)
      • Chart on Networked Embedded Systems - Year-over-year growth (2023-2028) (%)
      • Data Table on Networked Embedded Systems - Year-over-year growth (2023-2028) (%)
    • 8.6 Mobile Embedded Systems - Market size and forecast (2023-2028)
      • Chart on Mobile Embedded Systems - Market size and forecast (2023-2028) ($ million)
      • Data Table on Mobile Embedded Systems - Market size and forecast (2023-2028) ($ million)
      • Chart on Mobile Embedded Systems - Year-over-year growth (2023-2028) (%)
      • Data Table on Mobile Embedded Systems - Year-over-year growth (2023-2028) (%)
    • 8.7 Market opportunity by Functionality
      • Market opportunity by $segment_name ($ million)
      • Data Table on Market opportunity by $segment_name ($ million)

    9 Market Segmentation by System Size

    • 9.1 Market segments
      • Chart on System Size - Market share (2023-2028) (%)
      • Data Table on System Size - Market share (2023-2028) (%)
    • 9.2 Comparison by System Size
      • Chart on Comparison by System Size
      • Data Table on Comparison by System Size
    • 9.3 Small-scale - Market size and forecast (2023-2028)
      • Chart on Small-scale - Market size and forecast (2023-2028) ($ million)
      • Data Table on Small-scale - Market size and forecast (2023-2028) ($ million)
      • Chart on Small-scale - Year-over-year growth (2023-2028) (%)
      • Data Table on Small-scale - Year-over-year growth (2023-2028) (%)
    • 9.4 Medium-scale - Market size and forecast (2023-2028)
      • Chart on Medium-scale - Market size and forecast (2023-2028) ($ million)
      • Data Table on Medium-scale - Market size and forecast (2023-2028) ($ million)
      • Chart on Medium-scale - Year-over-year growth (2023-2028) (%)
      • Data Table on Medium-scale - Year-over-year growth (2023-2028) (%)
    • 9.5 Large-scale - Market size and forecast (2023-2028)
      • Chart on Large-scale - Market size and forecast (2023-2028) ($ million)
      • Data Table on Large-scale - Market size and forecast (2023-2028) ($ million)
      • Chart on Large-scale - Year-over-year growth (2023-2028) (%)
      • Data Table on Large-scale - Year-over-year growth (2023-2028) (%)
    • 9.6 Market opportunity by System Size
      • Market opportunity by $segment_name ($ million)
      • Data Table on Market opportunity by $segment_name ($ million)

    10 Market Segmentation by End User

    • 10.1 Market segments
      • Chart on End User - Market share (2023-2028) (%)
      • Data Table on End User - Market share (2023-2028) (%)
    • 10.2 Comparison by End User
      • Chart on Comparison by End User
      • Data Table on Comparison by End User
    • 10.3 Commercial - Market size and forecast (2023-2028)
      • Chart on Commercial - Market size and forecast (2023-2028) ($ million)
      • Data Table on Commercial - Market size and forecast (2023-2028) ($ million)
      • Chart on Commercial - Year-over-year growth (2023-2028) (%)
      • Data Table on Commercial - Year-over-year growth (2023-2028) (%)
    • 10.4 Residential - Market size and forecast (2023-2028)
      • Chart on Residential - Market size and forecast (2023-2028) ($ million)
      • Data Table on Residential - Market size and forecast (2023-2028) ($ million)
      • Chart on Residential - Year-over-year growth (2023-2028) (%)
      • Data Table on Residential - Year-over-year growth (2023-2028) (%)
    • 10.5 Government and Defense - Market size and forecast (2023-2028)
      • Chart on Government and Defense - Market size and forecast (2023-2028) ($ million)
      • Data Table on Government and Defense - Market size and forecast (2023-2028) ($ million)
      • Chart on Government and Defense - Year-over-year growth (2023-2028) (%)
      • Data Table on Government and Defense - Year-over-year growth (2023-2028) (%)
    • 10.6 Market opportunity by End User
      • Market opportunity by $segment_name ($ million)
      • Data Table on Market opportunity by $segment_name ($ million)

    11 Customer Landscape

    • 11.1 Customer landscape overview
      • Analysis of price sensitivity, lifecycle, customer purchase basket, adoption rates, and purchase criteria

    12 Geographic Landscape

    • 12.1 Geographic segmentation
      • Chart on Market share by geography 2023-2028 (%)
      • Data Table on Market share by geography 2023-2028 (%)
    • 12.2 Geographic comparison
      • Chart on Geographic comparison
      • Data Table on Geographic comparison
    • 12.3 North America - Market size and forecast 2023-2028
      • Chart on North America - Market size and forecast 2023-2028 ($ billion)
      • Data Table on North America - Market size and forecast 2023-2028 ($ billion)
      • Chart on North America - Year-over-year growth 2023-2028 (%)
      • Data Table on North America - Year-over-year growth 2023-2028 (%)
    • 12.4 APAC - Market size and forecast 2023-2028
      • Chart on APAC - Market size and forecast 2023-2028 ($ billion)
      • Data Table on APAC - Market size and forecast 2023-2028 ($ billion)
      • Chart on APAC - Year-over-year growth 2023-2028 (%)
      • Data Table on APAC - Year-over-year growth 2023-2028 (%)
    • 12.5 Europe - Market size and forecast 2023-2028
      • Chart on Europe - Market size and forecast 2023-2028 ($ billion)
      • Data Table on Europe - Market size and forecast 2023-2028 ($ billion)
      • Chart on Europe - Year-over-year growth 2023-2028 (%)
      • Data Table on Europe - Year-over-year growth 2023-2028 (%)
    • 12.6 South America - Market size and forecast 2023-2028
      • Chart on South America - Market size and forecast 2023-2028 ($ billion)
      • Data Table on South America - Market size and forecast 2023-2028 ($ billion)
      • Chart on South America - Year-over-year growth 2023-2028 (%)
      • Data Table on South America - Year-over-year growth 2023-2028 (%)
    • 12.7 Middle East and Africa - Market size and forecast 2023-2028
      • Chart on Middle East and Africa - Market size and forecast 2023-2028 ($ billion)
      • Data Table on Middle East and Africa - Market size and forecast 2023-2028 ($ billion)
      • Chart on Middle East and Africa - Year-over-year growth 2023-2028 (%)
      • Data Table on Middle East and Africa - Year-over-year growth 2023-2028 (%)
    • 12.8 US - Market size and forecast 2023-2028
      • Chart on US - Market size and forecast 2023-2028 ($ billion)
      • Data Table on US - Market size and forecast 2023-2028 ($ billion)
      • Chart on US - Year-over-year growth 2023-2028 (%)
      • Data Table on US - Year-over-year growth 2023-2028 (%)
    • 12.9 China - Market size and forecast 2023-2028
      • Chart on China - Market size and forecast 2023-2028 ($ billion)
      • Data Table on China - Market size and forecast 2023-2028 ($ billion)
      • Chart on China - Year-over-year growth 2023-2028 (%)
      • Data Table on China - Year-over-year growth 2023-2028 (%)
    • 12.10 Germany - Market size and forecast 2023-2028
      • Chart on Germany - Market size and forecast 2023-2028 ($ billion)
      • Data Table on Germany - Market size and forecast 2023-2028 ($ billion)
      • Chart on Germany - Year-over-year growth 2023-2028 (%)
      • Data Table on Germany - Year-over-year growth 2023-2028 (%)
    • 12.11 Japan - Market size and forecast 2023-2028
      • Chart on Japan - Market size and forecast 2023-2028 ($ billion)
      • Data Table on Japan - Market size and forecast 2023-2028 ($ billion)
      • Chart on Japan - Year-over-year growth 2023-2028 (%)
      • Data Table on Japan - Year-over-year growth 2023-2028 (%)
    • 12.12 UK - Market size and forecast 2023-2028
      • Chart on UK - Market size and forecast 2023-2028 ($ billion)
      • Data Table on UK - Market size and forecast 2023-2028 ($ billion)
      • Chart on UK - Year-over-year growth 2023-2028 (%)
      • Data Table on UK - Year-over-year growth 2023-2028 (%)
    • 12.13 Market opportunity by geography
      • Market opportunity by geography ($ billion)
      • Data Tables on Market opportunity by geography ($ billion)
    • 12.14 US - Market size and forecast (2023-2028)
      • Chart on US - Market size and forecast (2023-2028) ($ million)
      • Data Table on US - Market size and forecast (2023-2028) ($ million)
      • Chart on US - Year-over-year growth (2023-2028) (%)
      • Data Table on US - Year-over-year growth (2023-2028) (%)
    • 12.15 China - Market size and forecast (2023-2028)
      • Chart on China - Market size and forecast (2023-2028) ($ million)
      • Data Table on China - Market size and forecast (2023-2028) ($ million)
      • Chart on China - Year-over-year growth (2023-2028) (%)
      • Data Table on China - Year-over-year growth (2023-2028) (%)
    • 12.16 Germany - Market size and forecast (2023-2028)
      • Chart on Germany - Market size and forecast (2023-2028) ($ million)
      • Data Table on Germany - Market size and forecast (2023-2028) ($ million)
      • Chart on Germany - Year-over-year growth (2023-2028) (%)
      • Data Table on Germany - Year-over-year growth (2023-2028) (%)
    • 12.17 Japan - Market size and forecast (2023-2028)
      • Chart on Japan - Market size and forecast (2023-2028) ($ million)
      • Data Table on Japan - Market size and forecast (2023-2028) ($ million)
      • Chart on Japan - Year-over-year growth (2023-2028) (%)
      • Data Table on Japan - Year-over-year growth (2023-2028) (%)
    • 12.18 UK - Market size and forecast (2023-2028)
      • Chart on UK - Market size and forecast (2023-2028) ($ million)
      • Data Table on UK - Market size and forecast (2023-2028) ($ million)
      • Chart on UK - Year-over-year growth (2023-2028) (%)
      • Data Table on UK - Year-over-year growth (2023-2028) (%)

    13 Drivers, Challenges, and Opportunity/Restraints

    • 13.1 Market drivers
      • 13.2 Market challenges
        • 13.3 Impact of drivers and challenges
          • Impact of drivers and challenges in 2023 and 2028
        • 13.4 Market opportunities/restraints

          14 Competitive Landscape

          • 14.1 Overview
            • 14.2 Competitive Landscape
              • Overview on criticality of inputs and factors of differentiation
            • 14.3 Landscape disruption
              • Overview on factors of disruption
            • 14.4 Industry risks
              • Impact of key risks on business

            15 Competitive Analysis

            • 15.1 Companies profiled
              • Companies covered
            • 15.2 Market positioning of companies
              • Matrix on companies position and classification
            • 15.3 Advantech Co. Ltd.
              • Advantech Co. Ltd. - Overview
              • Advantech Co. Ltd. - Business segments
              • Advantech Co. Ltd. - Key news
              • Advantech Co. Ltd. - Key offerings
              • Advantech Co. Ltd. - Segment focus
            • 15.4 AMETEK Inc.
              • AMETEK Inc. - Overview
              • AMETEK Inc. - Business segments
              • AMETEK Inc. - Key news
              • AMETEK Inc. - Key offerings
              • AMETEK Inc. - Segment focus
            • 15.5 Curtiss Wright Corp
              • Curtiss Wright Corp - Overview
              • Curtiss Wright Corp - Business segments
              • Curtiss Wright Corp - Key offerings
              • Curtiss Wright Corp - Segment focus
            • 15.6 Digi International Inc.
              • Digi International Inc. - Overview
              • Digi International Inc. - Business segments
              • Digi International Inc. - Key news
              • Digi International Inc. - Key offerings
              • Digi International Inc. - Segment focus
            • 15.7 EUROTECH Spa
              • EUROTECH Spa - Overview
              • EUROTECH Spa - Business segments
              • EUROTECH Spa - Key offerings
              • EUROTECH Spa - Segment focus
            • 15.8 Fujitsu Ltd.
              • Fujitsu Ltd. - Overview
              • Fujitsu Ltd. - Business segments
              • Fujitsu Ltd. - Key news
              • Fujitsu Ltd. - Key offerings
              • Fujitsu Ltd. - Segment focus
            • 15.9 Intel Corp.
              • Intel Corp. - Overview
              • Intel Corp. - Business segments
              • Intel Corp. - Key news
              • Intel Corp. - Key offerings
              • Intel Corp. - Segment focus
            • 15.10 Kontron AG
              • Kontron AG - Overview
              • Kontron AG - Business segments
              • Kontron AG - Key offerings
              • Kontron AG - Segment focus
            • 15.11 NVIDIA Corp.
              • NVIDIA Corp. - Overview
              • NVIDIA Corp. - Business segments
              • NVIDIA Corp. - Key news
              • NVIDIA Corp. - Key offerings
              • NVIDIA Corp. - Segment focus
            • 15.12 NXP Semiconductors NV
              • NXP Semiconductors NV - Overview
              • NXP Semiconductors NV - Product / Service
              • NXP Semiconductors NV - Key news
              • NXP Semiconductors NV - Key offerings
            • 15.13 Qualcomm Inc.
              • Qualcomm Inc. - Overview
              • Qualcomm Inc. - Business segments
              • Qualcomm Inc. - Key news
              • Qualcomm Inc. - Key offerings
              • Qualcomm Inc. - Segment focus
            • 15.14 Radisys Corp.
              • Radisys Corp. - Overview
              • Radisys Corp. - Product / Service
              • Radisys Corp. - Key offerings
            • 15.15 SMART Global Holdings Inc.
              • SMART Global Holdings Inc. - Overview
              • SMART Global Holdings Inc. - Business segments
              • SMART Global Holdings Inc. - Key offerings
              • SMART Global Holdings Inc. - Segment focus
            • 15.16 Super Micro Computer Inc.
              • Super Micro Computer Inc. - Overview
              • Super Micro Computer Inc. - Business segments
              • Super Micro Computer Inc. - Key news
              • Super Micro Computer Inc. - Key offerings
              • Super Micro Computer Inc. - Segment focus
            • 15.17 Texas Instruments Inc.
              • Texas Instruments Inc. - Overview
              • Texas Instruments Inc. - Business segments
              • Texas Instruments Inc. - Key news
              • Texas Instruments Inc. - Key offerings
              • Texas Instruments Inc. - Segment focus

            16 Appendix

            • 16.1 Scope of the report
              • 16.2 Inclusions and exclusions checklist
                • Inclusions checklist
                • Exclusions checklist
              • 16.3 Currency conversion rates for US$
                • Currency conversion rates for US$
              • 16.4 Research methodology
                • Research methodology
              • 16.5 Data procurement
                • Information sources
              • 16.6 Data validation
                • Data validation
              • 16.7 Validation techniques employed for market sizing
                • Validation techniques employed for market sizing
              • 16.8 Data synthesis
                • Data synthesis
              • 16.9 360 degree market analysis
                • 360 degree market analysis
              • 16.10 List of abbreviations
                • List of abbreviations

              Research Methodology

              Technavio presents a detailed picture of the market by way of study, synthesis, and summation of data from multiple sources. The analysts have presented the various facets of the market with a particular focus on identifying the key industry influencers. The data thus presented is comprehensive, reliable, and the result of extensive research, both primary and secondary.

              INFORMATION SOURCES

              Primary sources

              • Manufacturers and suppliers
              • Channel partners
              • Industry experts
              • Strategic decision makers

              Secondary sources

              • Industry journals and periodicals
              • Government data
              • Financial reports of key industry players
              • Historical data
              • Press releases

              DATA ANALYSIS

              Data Synthesis

              • Collation of data
              • Estimation of key figures
              • Analysis of derived insights

              Data Validation

              • Triangulation with data models
              • Reference against proprietary databases
              • Corroboration with industry experts

              REPORT WRITING

              Qualitative

              • Market drivers
              • Market challenges
              • Market trends
              • Five forces analysis

              Quantitative

              • Market size and forecast
              • Market segmentation
              • Geographical insights
              • Competitive landscape

              Interested in this report?

              Get your sample now to see our research methodology and insights!

              Download Now

              Frequently Asked Questions

              Embedded Products market growth will increase by $ 99.2 bn during 2024-2028 .

              The Embedded Products market is expected to grow at a CAGR of 6.79% during 2024-2028 .

              Embedded Products market is segmented by Application( Consumer electronics, Automotive, Industrial, Aerospace and defense, Others) Product( Hardware, Software, Europe, South America, MEA)

              Advantech Co. Ltd., AMETEK Inc., ARBOR Technology Corp., ASUSTeK Computer Inc., Axiomtek Co. Ltd., congatec GmbH, Curtiss Wright Corp, Digi International Inc., EUROTECH Spa, Fujitsu Ltd., Intel Corp., Kontron AG, NVIDIA Corp., NXP Semiconductors NV, Qualcomm Inc., Radisys Corp., SMART Global Holdings Inc., Super Micro Computer Inc., TechNexion Ltd., Texas Instruments Inc., Toradex AG are a few of the key vendors in the Embedded Products market.

              North America will register the highest growth rate of 31% among the other regions. Therefore, the Embedded Products market in North America is expected to garner significant business opportunities for the vendors during the forecast period.

              US, Canada, Germany, UK, Italy, France, China, India, Japan, Brazil, Egypt, UAE, Oman, Argentina, KSA

              • Demand for smart appliancesWith improved technology is the driving factor this market.
              • electronic systems are also being upgraded. Smart appliances and other electronic systems is the driving factor this market.
              • especially in-house security infrastructure such as automated door locks is the driving factor this market.
              • are designed to communicate and interact with users via the Internet. Almost all modern electronic systems require ICs with embedded software to control the hardware functions. Some examples of smart home applications are Google Home is the driving factor this market.
              • Amazon Echo is the driving factor this market.
              • and Apple HomeKit. For instance is the driving factor this market.
              • in September 2022 is the driving factor this market.
              • Amazon launched Echo Dot with Clock is the driving factor this market.
              • a speaker with additional features such as a digital clock and a touch-sensitive top. The company also launched Echo Glow is the driving factor this market.
              • a smart home lamp is the driving factor this market.
              • to activate the light and change its colors. Other smart products include Echo Auto is the driving factor this market.
              • Echo Studio is the driving factor this market.
              • Fire TV Omni QLED series is the driving factor this market.
              • and Kindle Scribe is the driving factor this market.
              • which were introduced at their annual product launch event. In addition is the driving factor this market.
              • in May 2021 is the driving factor this market.
              • Wozart launched its range of smart devices designed and engineered to increase energy efficiency in homes. The product range is end-to-end and manufactured in India. A smart grid is another technology where integrated circuits (ICs) are used. It uses automation to integrate the actions of the user and deliver sustainable and secure electricity in the most efficient way by connecting to the electric infrastructure of the user. It also helps reduce electricity wastage. Primarily is the driving factor this market.
              • the smart grid uses information and communications technology. The potential of this segment to drive the growth in the adoption of embedded products in the forecast period is huge since ICs play a crucial role in smart grid and security solutions. is the driving factor this market.

              The Embedded Products market vendors should focus on grabbing business opportunities from the Consumer electronics segment as it accounted for the largest market share in the base year.