Emission Control Catalysts Market Size 2024-2028
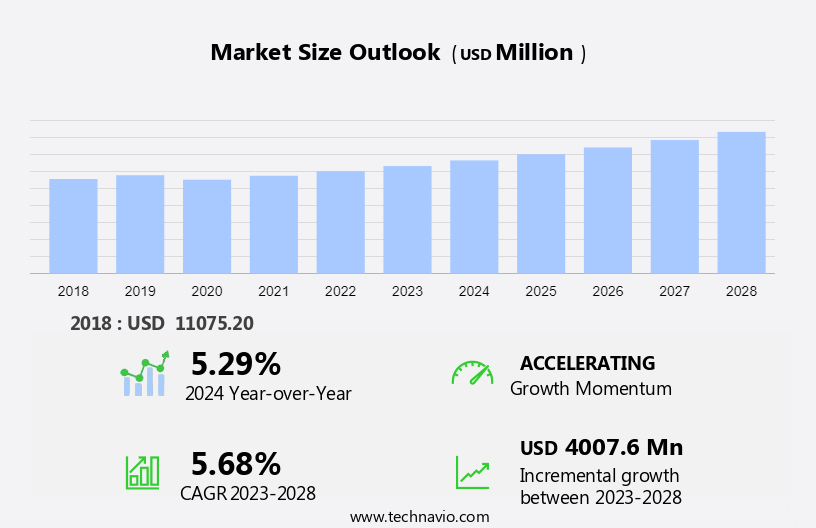
The emission control catalysts market size is forecast to increase by USD 4.01 billion, at a CAGR of 5.68% between 2023 and 2028.
- The market growth depends on key drivers such as the growth in the global automotive sector, which significantly contributes to the demand for emission control catalysts (ECCs) in both automotive and industrial applications. An emerging trend shaping the market is the increasing prospects for ECCs in emerging markets, especially in regions like APAC, where automotive production is rising, with China and Japan playing key roles. However, the market faces challenges, such as the growing popularity of electric vehicles (EVs), which reduce the need for traditional emission control technologies, potentially limiting the demand for ECCs in the automotive sector.
What will be the Size of the Market During the Forecast Period?
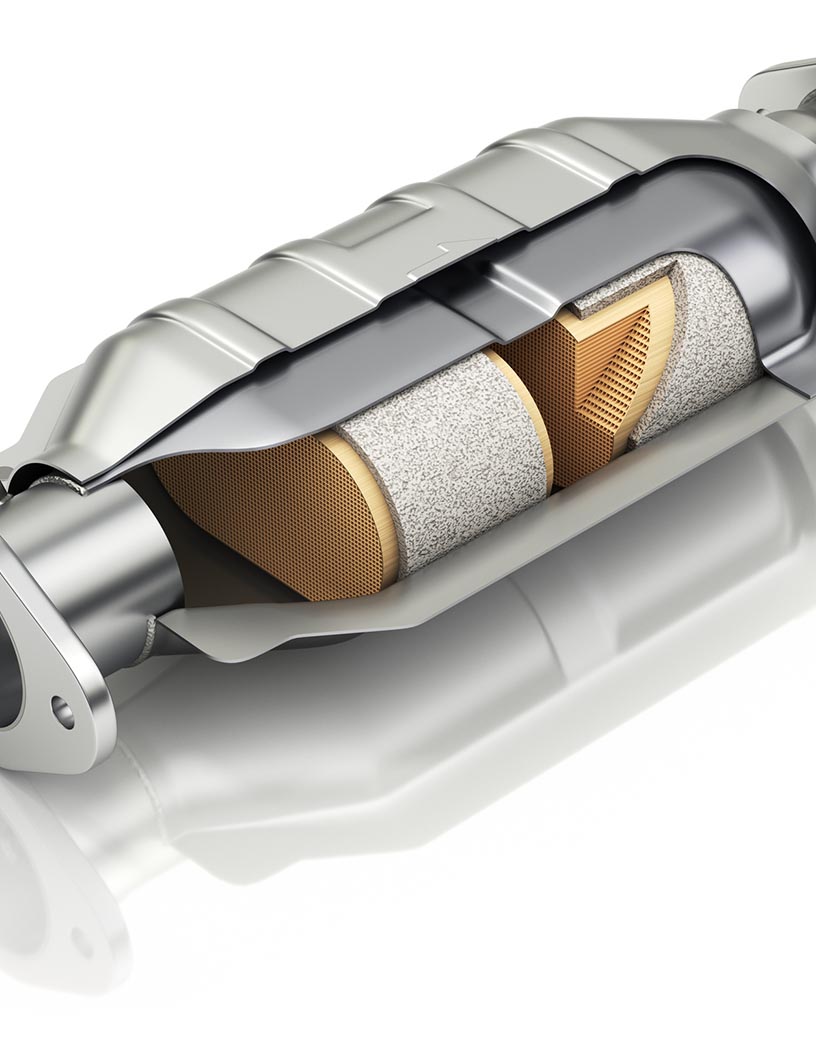
- The market encompasses the production and supply of catalysts used in both the automotive and industrial sectors for reducing harmful emissions. These catalysts play a crucial role in mitigating the emissions from Mobile Sources, such as Internal Combustion Engines in automobiles, and Stationary Sources, like Power Generation Plants. Automobile Manufacturers and the Industrial sector rely heavily on Emission Control Catalysts, including Catalytic Converters, to meet stringent Emission Standards. These catalysts help in controlling the emission of Harmful Hydrocarbons and CO2, contributing significantly to improving Air Quality in urban areas and metropolises. Catalytic Converters, primarily made of Platinum, Rhodium, and other Metals, are essential components of Emission Control Systems in vehicles.
- They work by converting harmful pollutants into less harmful substances through a process called Catalytic Conversion. Moreover, the advent of Battery Electric Vehicles has led to the development of new types of Emission Control Catalysts, such as Lean Nox Traps, to address the unique emission challenges posed by these vehicles. Overall, the market is expected to grow significantly due to the increasing focus on Emission Control and the need to reduce Harmful Chemicals in the environment.
How is this market segmented and which is the largest segment?
The market research report provides comprehensive data (region-wise segment analysis), with forecasts and estimates in "USD billion" for the period 2024-2028, as well as historical data from 2018-2022 for the following segments.
- Application
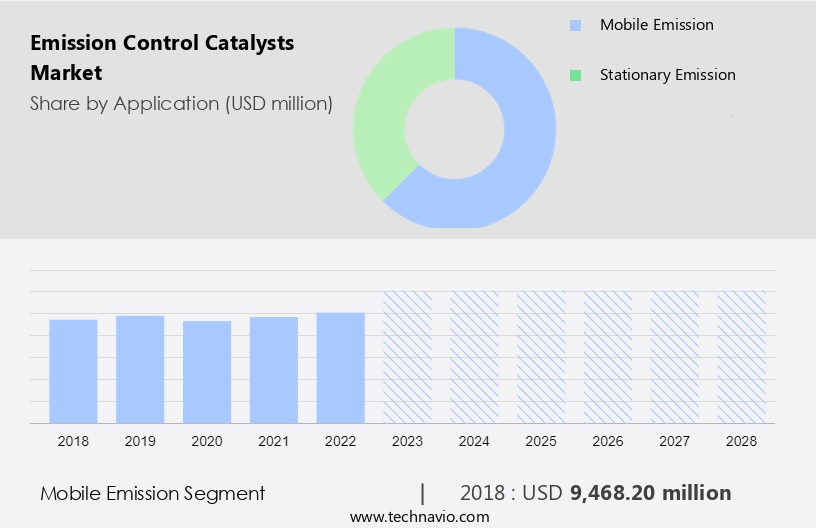
- Mobile emission
- Stationary emission
- Type
- Palladium
- Platinum
- Rhodium
- Geography
- APAC
- China
- Japan
- Europe
- Germany
- UK
- North America
- US
- South America
- Middle East and Africa
- APAC
By Application Insights
- The mobile emission segment is estimated to witness significant growth during the forecast period.
The market is driven by stringent emission regulations in the mobile industry. Nearly all new vehicles, including those with internal combustion engines and battery electric vehicles, utilize autocatalysts for emission control. Harmful hydrocarbons from vehicular populations in urban areas and metropolises contribute significantly to poor air quality. As a result, governments worldwide impose regulations to reduce CO2 emissions from automobiles, leading to increased adoption of ECCs. Three-way catalysts, such as gasoline particulate filters, diesel oxidation catalysts, and diesel particulate filters, are essential primary chemicals in the ECC market. Platinum group metals, rare earth oxides, aluminum oxide, SCR technology, TiO2, V2O5, and WO2 are key components in these catalysts.
The market is influenced by various factors, including the increasing demand for light vehicles and heavy-duty counterparts, power stations, chemical plants, and stationary diesel engines. The global consumption of ECCs is significant, with major contributors being Mainland China and other regions with high vehicular populations. The market is expected to grow steadily, despite supply constraints and rising prices, due to the need for improving environmental health and concerns regarding sustainability. Additionally, the transition to renewable energy sources and the reduction of emissions from coal power plants and industrial processes will further boost the demand for ECCs.
Get a glance at the market report of share of various segments Request Free Sample
The mobile emission segment was valued at USD 9.47 billion in 2018 and showed a gradual increase during the forecast period.
Regional Analysis
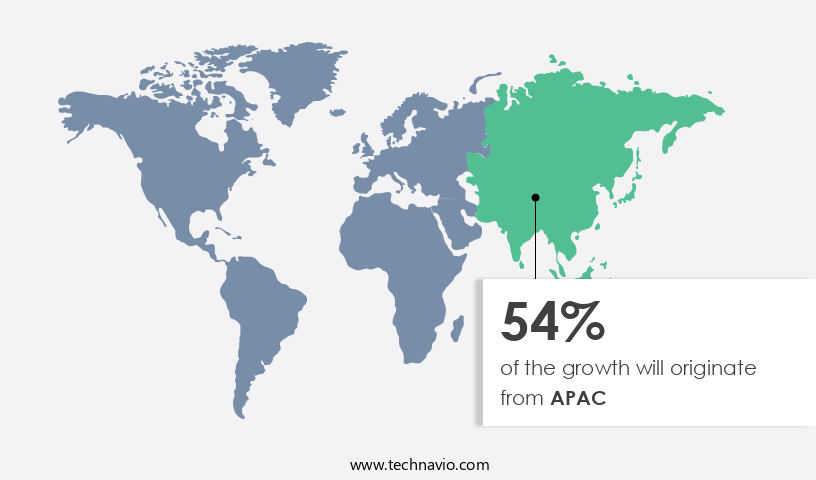
- APAC is estimated to contribute 54% to the growth of the global market during the forecast period.
Technavio's analysts have elaborately explained the regional trends and drivers that shape the market during the forecast period.
For more insights on the market share of various regions Request Free Sample
In the APAC region, the mobile industry's significant growth and urbanization have led to increasing vehicular populations and correspondingly higher CO2 emissions and harmful hydrocarbon releases. Stringent emission regulations have been implemented by regulatory bodies to improve air quality in metropolises, particularly in countries like Mainland China, India, Japan, and South Korea, which are major automobile manufacturing hubs. This has driven the demand for advanced emission control technologies, including automobile catalysts such as three-way catalysts, gasoline particulate filters, diesel oxidation catalysts, and diesel particulate filters.
These catalysts contain primary chemicals like platinum group metals, rare earth oxides, aluminum oxide, SCR technology, TiO2, V2O5, and WO2. The emission control market in APAC encompasses catalytic converter types, including Platinum and Rhodium, and extends to stationary applications like power stations, chemical plants, and heavy-duty counterparts such as coal power plants, turbines, and industrial diesel engines. The market's growth is influenced by trade and economics, with metal prices and supply chain dynamics playing crucial roles.
Market Dynamics
Our researchers analyzed the data with 2023 as the base year, along with the key drivers, trends, and challenges. A holistic analysis of drivers will help companies refine their marketing strategies to gain a competitive advantage.
What are the key market drivers leading to the rise in the adoption of the Emission Control Catalysts Market?
Growth in global automotive sector is the key driver of the market.
- The market encompasses the use of these catalysts in both the automotive and industrial sectors for controlling emissions. ECCs are primarily made of metallic or non-metallic elements and are known for their high-temperature resistance. In the automotive industry, they are utilized in various functional components such as spark plugs, oxygen sensors, and PTC heaters. Advanced versions of automotive ECCs exhibit superior physical, thermal, and electrical properties, making them cost-effective alternatives to other metals and non-ceramic materials.
- In mobile emissions, Lean Nox Traps utilize ECCs to reduce NOx emissions. HC, CO, and SOx are controlled in both mobile and stationary emissions through the use of ECCs. SCR technology, another application of ECCs, converts NOx into harmless nitrogen and water. VOCs are controlled through the use of ECCs in various industrial processes. Overall, ECCs play a crucial role in mitigating emissions of harmful gases such as NOx, HC, CO, SOx, and VOCs in both the automotive and industrial sectors.
What are the market trends shaping the Emission Control Catalysts Market?
Emerging markets to provide significant prospects for ECCs are the upcoming trend in the market.
- The market is experiencing significant growth, particularly in developing regions such as APAC. This expansion is driven by the increasing automotive production in these areas, which accounts for over half of the global market. China, in particular, is a major contributor, with its growing middle-class population leading to increased demand. Japan, as a mature automotive market and leading producer, also plays a significant role. ECCs are essential in controlling Mobile Emissions from light- and medium-weight vehicles, reducing Harmful Gases (HC, CO, NOx) and Volatile Organic Compounds (VOCs). In the industrial sector, Lean NOx Traps and Selective Catalytic Reduction (SCR) systems are used to mitigate Stationary Emissions of NOx, SOx, and other metals.
What challenges does the Emission Control Catalysts Market face during its growth?
The growing popularity of EVs is a key challenge affecting the market growth.
- The market is witnessing significant growth due to increasing regulations aimed at reducing greenhouse gas emissions in both mobile and stationary applications. In the automotive sector, Lean NOx Traps and Selective Catalytic Reduction (SCR) systems are widely used to minimize NOx, HC, CO, and VOC emissions. Other metals, such as platinum group metals, play a crucial role in these catalytic processes. Similarly, in industries, catalysts are employed to reduce SOx and NOx emissions from power generation and manufacturing processes. The adoption of these emission control technologies is driven by stringent emission norms in regions like APAC, North America, and Europe, where governments are offering tax incentives for their implementation.
Exclusive Customer Landscape
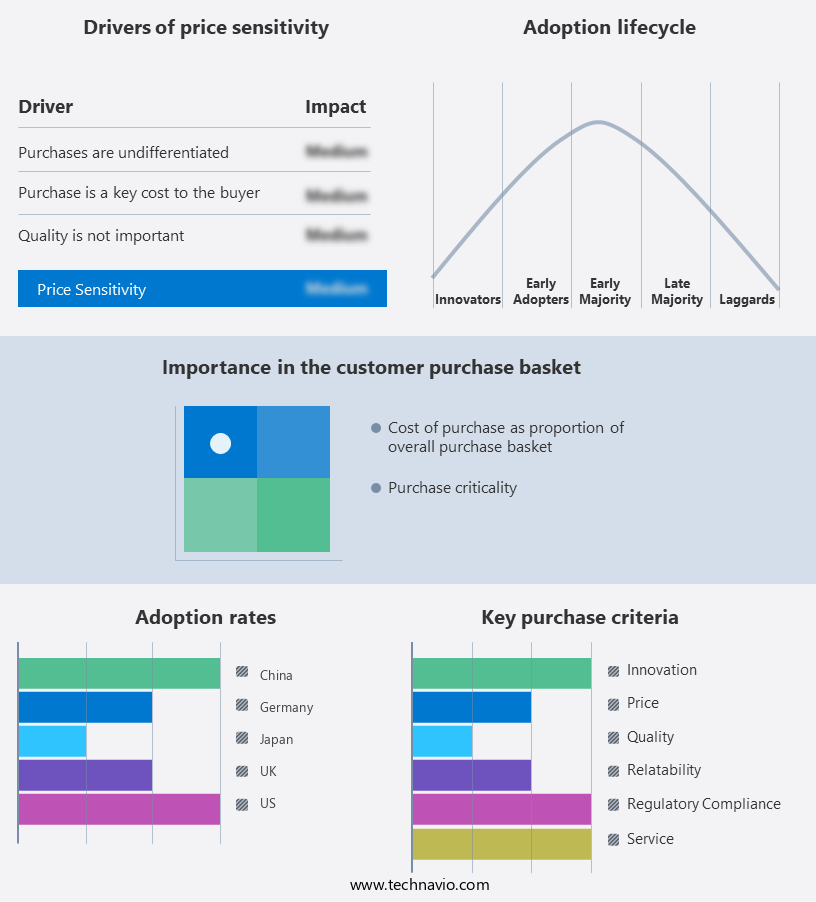
The market forecasting report includes the adoption lifecycle of the market, covering from the innovator's stage to the laggard's stage. It focuses on adoption rates in different regions based on penetration. Furthermore, the market report also includes key purchase criteria and drivers of price sensitivity to help companies evaluate and develop their market growth analysis strategies.
Customer Landscape
Key Companies & Market Insights
Companies are implementing various strategies, such as strategic alliances, market forecasts, partnerships, mergers and acquisitions, geographical expansion, and product/service launches, to enhance their presence in the market. The market research and growth report includes detailed analyses of the competitive landscape of the market and information about key companies, including:
- AeriNOx Inc.
- Ashland Inc.
- BASF SE
- Catalytic Combustion Corp.
- CDTi Advanced Materials Inc.
- Clariant International Ltd.
- CORMETECH Inc.
- Cummins Inc.
- DCL International Inc.
- DieselNet
- Evonik Industries AG
- Honeywell International Inc.
- Ibiden Co. Ltd.
- Johnson Matthey Plc
- S and P Global Inc.
- Solvay SA
- Tenneco Inc.
- Topsoes AS
- Toyota Motor Corp.
- Umicore SA
Qualitative and quantitative analysis of companies has been conducted to help clients understand the wider business environment as well as the strengths and weaknesses of key market players. Data is qualitatively analyzed to categorize companies as pure play, category-focused, industry-focused, and diversified; it is quantitatively analyzed to categorize companies as dominant, leading, strong, tentative, and weak.
Research Analyst Overview
The market plays a crucial role in the automotive industry and various other sectors that require air pollution control. These catalysts, such as ECC, EMissionSionS, and PGM (Platinum Group Metals), are essential components in reducing harmful emissions from internal combustion engines. They convert harmful gases like nitrogen oxides (NOx) and carbon monoxide (CO) into less harmful substances, such as nitrogen (N2) and carbon dioxide (CO2). The market for Emission Control Catalysts is driven by stringent environmental regulations and increasing awareness of air pollution. Further, key players focus on research and development to improve the efficiency and durability of catalysts. The Asia Pacific region is expected to dominate the market due to the high production of vehicles and increasing environmental concerns. In conclusion, the market is a significant contributor to reducing air pollution and complying with environmental regulations. The market is expected to grow due to increasing demand from various industries and stringent regulations.
|
Market Scope |
|
|
Report Coverage |
Details |
|
Page number |
174 |
|
Base year |
2023 |
|
Historic period |
2018-2022 |
|
Forecast period |
2024-2028 |
|
Growth momentum & CAGR |
Accelerate at a CAGR of 5.68% |
|
Market Growth 2024-2028 |
USD 4.01 billion |
|
Market structure |
Fragmented |
|
YoY growth 2023-2024(%) |
5.29 |
|
Key countries |
China, US, Germany, Japan, and UK |
|
Competitive landscape |
Leading Companies, Market Positioning of Companies, Competitive Strategies, and Industry Risks |
What are the Key Data Covered in this Market Research and Growth Report?
- CAGR of the market during the market forecast period
- Detailed information on factors that will drive the market growth and forecasting between 2024 and 2028
- Precise estimation of the size of the market and its contribution of the market in focus to the parent market
- Accurate predictions about upcoming market growth and trends and changes in consumer behaviour
- Growth of the market across APAC, Europe, North America, South America, and Middle East and Africa
- Thorough analysis of the market's competitive landscape and detailed information about companies
- Comprehensive analysis of factors that will challenge the growth of market companies
We can help! Our analysts can customize this market research report to meet your requirements.
 RIA -
RIA - 
