Enteric Empty Capsules Sales Market Analysis, Size, and Forecast 2026-2030: North America (US, Canada, and Mexico), Europe (Germany, UK, and France), APAC (China, Japan, and India), South America (Brazil, Argentina, and Colombia), Middle East and Africa (Saudi Arabia, Turkey, and South Africa), Asia, Rest of World (ROW)

Enteric Empty Capsules Sales Market Analysis, Size, and Forecast 2026-2030:
North America (US, Canada, and Mexico), Europe (Germany, UK, and France), APAC (China, Japan, and India), South America (Brazil, Argentina, and Colombia), Middle East and Africa (Saudi Arabia, Turkey, and South Africa), Asia, Rest of World (ROW)

Published: Jan 2026 281 Pages SKU: IRTNTR74644

Market Overview at a Glance

$83.82 Mn
Market Opportunity
14.5%
CAGR 2025 - 2030
40.9%
North America Growth
$32.91 Mn
Pharmaceutical segment 2024

Enteric Empty Capsules Sales Market Size 2026-2030
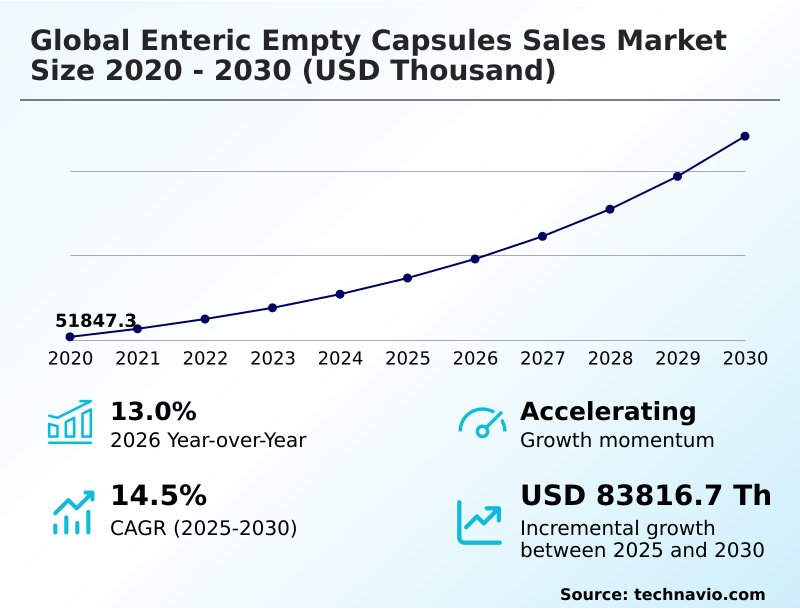
The enteric empty capsules sales market size is valued to increase by USD 83.82 million, at a CAGR of 14.5% from 2025 to 2030. Strategic supply chain localization and manufacturing resilience will drive the enteric empty capsules sales market.

Major Market Trends & Insights

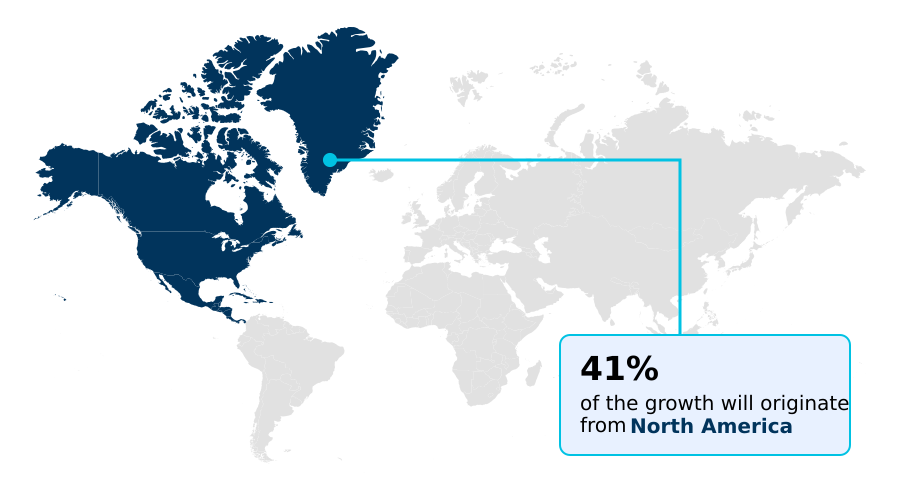
  • North America dominated the market and accounted for a 40.9% growth during the forecast period.
  • By End-user - Pharmaceutical segment was valued at USD 32.91 million in 2024
  • By Application - Antibiotic and antibacterial drugs segment accounted for the largest market revenue share in 2024

Market Size & Forecast

  • Market Opportunities:
  • Market Future Opportunities: USD 83.82 million
  • CAGR from 2025 to 2030 : 14.5%

Market Summary

  • The enteric empty capsules sales market is undergoing a significant transformation, driven by the increasing demand for advanced drug delivery systems that protect acid-sensitive active pharmaceutical ingredients (APIs). This market is moving beyond traditional gelatin-based capsules toward innovative vegetarian and polymer-based alternatives that offer enhanced stability and targeted release.
  • Key drivers include the rising prevalence of gastrointestinal disorders requiring specialized formulations and the growing consumer demand for clean-label nutraceuticals, such as probiotics and enzymes, which depend on enteric protection for efficacy. A major trend is the adoption of intrinsically enteric capsules, which simplify manufacturing by eliminating the need for secondary coating processes.
  • For instance, a pharmaceutical company developing a new proton pump inhibitor can bypass complex and costly coating validation steps by using a capsule with inherent acid-resistant properties, reducing time-to-market. However, the industry faces challenges related to stringent regulatory standards for excipients and the need for significant capital investment in new polymer technologies and manufacturing infrastructure.
  • The competitive landscape is characterized by innovation in material science and a focus on providing comprehensive formulation solutions to pharmaceutical and nutraceutical clients.

What will be the Size of the Enteric Empty Capsules Sales Market during the forecast period?

Get Key Insights on Market Forecast (PDF) Request Free Sample

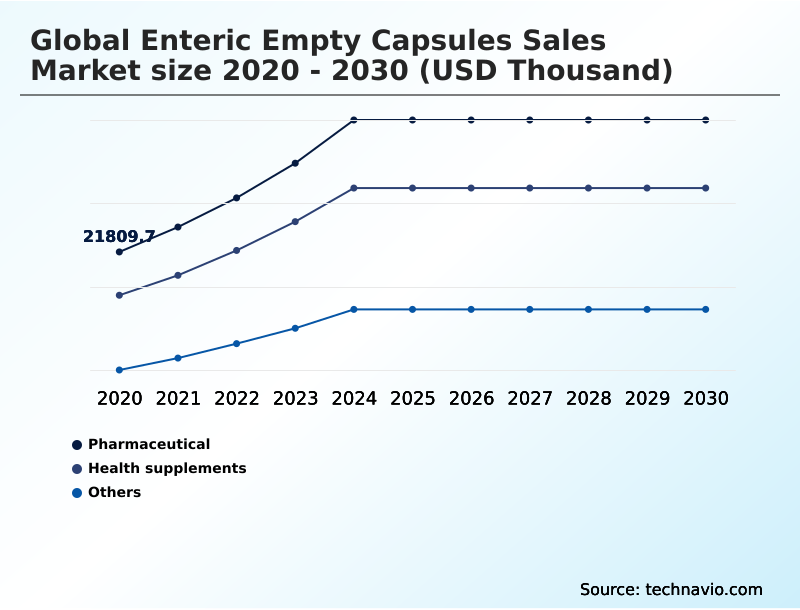
How is the Enteric Empty Capsules Sales Market Segmented?

The enteric empty capsules sales industry research report provides comprehensive data (region-wise segment analysis), with forecasts and estimates in "USD thousand" for the period 2026-2030, as well as historical data from 2020-2024 for the following segments.

  • End-user
    • Pharmaceutical
    • Health supplements
    • Others
  • Application
    • Antibiotic and antibacterial drugs
    • Antacid and antiflatulent preparations
    • Others
  • Product
    • Gelatin-based enteric capsules
    • Hydroxypropyl methylcellulose enteric capsules
    • Others
  • Geography
    • North America
      • US
      • Canada
      • Mexico
    • Europe
      • Germany
      • UK
      • France
    • Asia
    • Rest of World (ROW)

By End-user Insights

The pharmaceutical segment is estimated to witness significant growth during the forecast period.

The pharmaceutical segment is shifting from traditional coating processes to advanced oral solid dosage forms. This evolution is driven by the need for a delayed-release formulation for complex APIs, moving toward options with intrinsic enteric properties.

Technologies using HPMC-AS polymer are gaining traction over those prone to gelatin cross-linking, offering a superior acid-resistant shell. This simplifies manufacturing, enhances stability, and meets stringent pharmaceutical excipient regulation.

The focus on vegetarian capsule alternatives and improved nutraceutical delivery systems is reshaping development pipelines, with North America leading this transformation, contributing over 40% of the market's incremental growth.

This strategic pivot ensures more reliable and efficient delivery for next-generation therapeutics and health supplements.

Request Free Sample

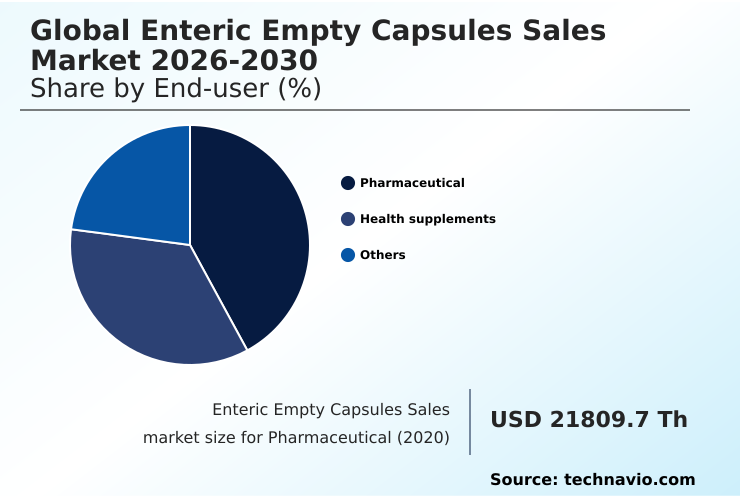
The Pharmaceutical segment was valued at USD 32.91 million in 2024 and showed a gradual increase during the forecast period.

Request Free Sample

Regional Analysis

North America is estimated to contribute 40.9% to the growth of the global market during the forecast period.Technavio’s analysts have elaborately explained the regional trends and drivers that shape the market during the forecast period.

See How Enteric Empty Capsules Sales Market Demand is Rising in North America Request Free Sample

The geographic landscape of the enteric empty capsules sales market is dominated by North America, which accounts for over 40% of the global opportunity, followed by Europe at approximately 24%.

This leadership is driven by advanced pharmaceutical infrastructure and high demand for sophisticated ODF manufacturing. Regional growth is supported by robust GMP manufacturing standards and a focus on API stability protection.

Companies are leveraging polymer matrix technology to meet stringent dissolution profile testing requirements. The emphasis on Quality by Design principles and regulatory submission support further solidifies the region's market position.

Meanwhile, Asia is an emerging hub, with increasing investments in GMP-compliant facilities and the adoption of advanced plant-based polymers and pharmaceutical-grade gelatin to cater to both local and international demand.

Market Dynamics

Our researchers analyzed the data with 2025 as the base year, along with the key drivers, trends, and challenges. A holistic analysis of drivers will help companies refine their marketing strategies to gain a competitive advantage.

  • The global enteric empty capsules sales market is advancing beyond conventional applications, with a strong focus on specialized use cases and manufacturing efficiencies. A key area of development is the use of enteric capsules for probiotic delivery, where maintaining microbial viability through the gastric passage is critical for therapeutic efficacy.
  • This has intensified the debate over HPMC capsules vs gelatin for acid resistance, with formulators evaluating polymer performance based on dissolution profiles and stability data. The manufacturing process for intrinsic enteric capsules has become a significant competitive differentiator, as it eliminates secondary coating steps and reduces production complexities.
  • However, navigating the regulatory challenges for TiO2-free capsules remains a primary concern for companies targeting clean-label formulations, especially in European markets. In response to global disruptions, supply chain localization for empty capsules is now a strategic imperative.
  • This shift toward regional production hubs ensures greater supply security and has contributed to a more stable market, which is expanding at a rate nearly 13% higher than in previous periods, enabling more predictable operational planning for pharmaceutical manufacturers.

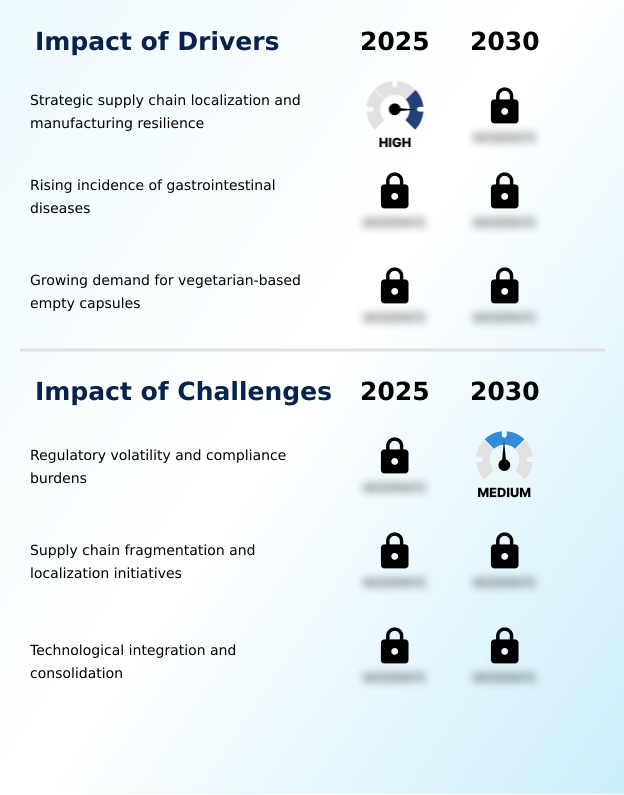
What are the key market drivers leading to the rise in the adoption of Enteric Empty Capsules Sales Industry?

  • Strategic supply chain localization and manufacturing resilience are key drivers shaping the market.

  • Market drivers are centered on enhancing therapeutic efficacy through formulation advancements. The need to improve bioavailability enhancement for poorly soluble drugs has spurred the demand for capsules with a precise modified-release profile.
  • Innovations in patient-centric drug design have led to the widespread use of multi-particulate systems, improving dosing flexibility and patient compliance by over 25%.
  • A major driver is the protection of acid-labile compound formulations, where specialized capsules serve as effective enteric coating alternatives. The growing consumer preference for clean-label supplement formulation necessitates the use of clean-label excipients, boosting demand for vegetarian options.
  • Adherence to pharmacopeia compliance ensures product safety and has reduced regulatory queries by 30% for manufacturers using pre-validated systems.

What are the market trends shaping the Enteric Empty Capsules Sales Industry?

  • A key trend is the strategic shift toward supply chain localization and manufacturing onshoring. This move aims to enhance resilience and security in the production ecosystem.

  • A defining market trend is the move toward supply chain onshoring and advanced drug delivery innovation, emphasizing targeted-release technology. This is propelled by the adoption of solvent-free encapsulation and pullulan-based capsules, which align with sustainability goals and clean-label demands. The use of a functionalized polymer shell enables precise pH-triggered dissolution, which is critical for biologic drug encapsulation.
  • This innovation has improved formulation success rates by over 20% for sensitive molecules. Furthermore, the development of TiO2-free opacifier solutions is becoming standard, streamlining regulatory compliance across international markets and reducing product development timelines by up to 15%, ensuring faster market access for new therapeutics.

What challenges does the Enteric Empty Capsules Sales Industry face during its growth?

  • Regulatory volatility and complex compliance burdens represent a key challenge impacting industry growth.

  • The market is navigating challenges related to material science complexity and rigorous regulatory oversight. Ensuring consistent intestinal drug delivery and gastric fluid resistance requires deep expertise in advanced polymer science, which increases R&D costs by up to 18%. Maintaining capsule shell integrity while ensuring drug-polymer compatibility is a persistent hurdle in dosage form manufacturing.
  • The process of excipient qualification is becoming more stringent, with an increased focus on excipient source traceability, adding layers of complexity to supply chain management. The push for global excipient harmonization introduces further compliance burdens, as manufacturers must align with divergent regional standards, increasing documentation overhead by an estimated 20%.

Exclusive Technavio Analysis on Customer Landscape

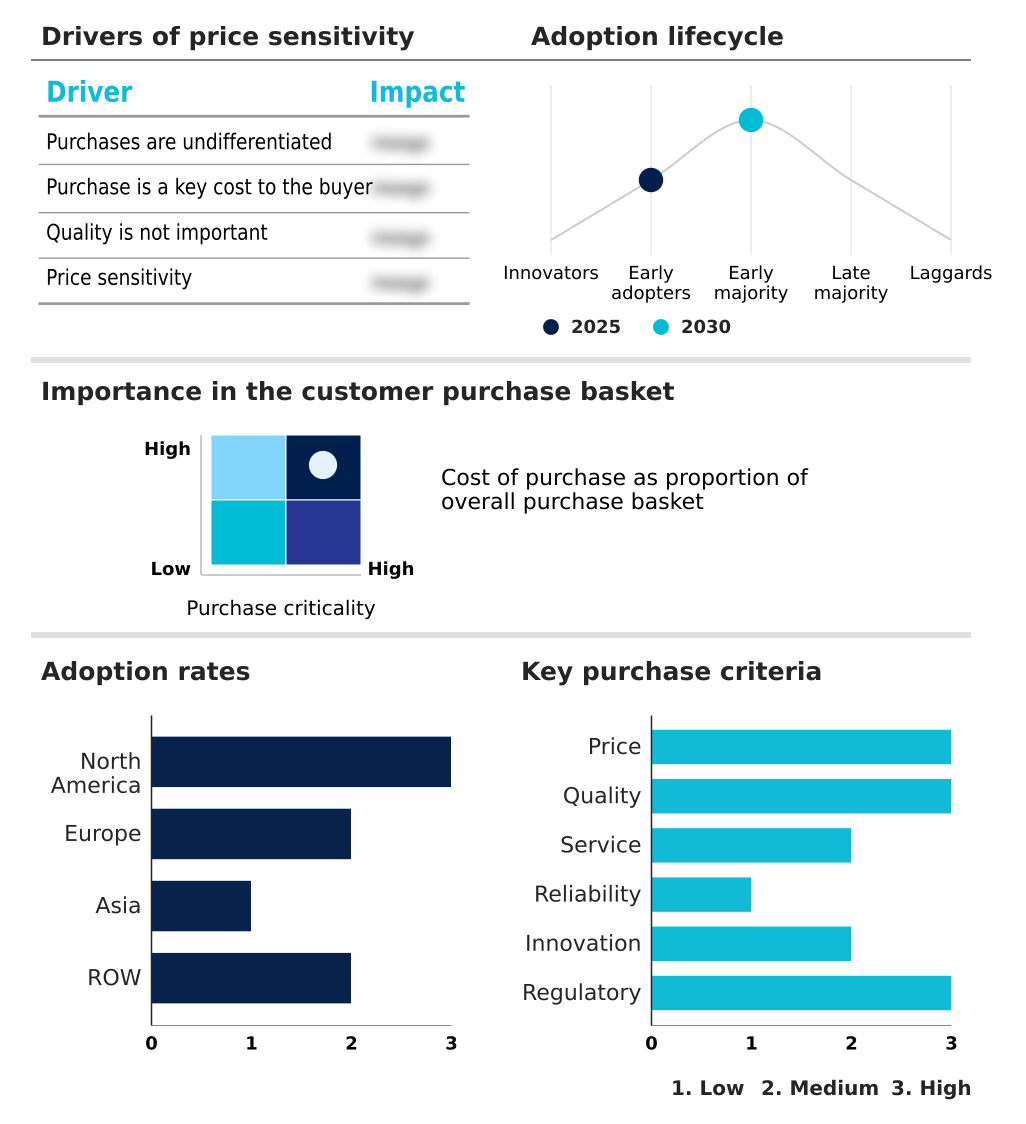
The enteric empty capsules sales market forecasting report includes the adoption lifecycle of the market, covering from the innovator’s stage to the laggard’s stage. It focuses on adoption rates in different regions based on penetration. Furthermore, the enteric empty capsules sales market report also includes key purchase criteria and drivers of price sensitivity to help companies evaluate and develop their market growth analysis strategies.

Customer Landscape of Enteric Empty Capsules Sales Industry

Competitive Landscape

Companies are implementing various strategies, such as strategic alliances, enteric empty capsules sales market forecast, partnerships, mergers and acquisitions, geographical expansion, and product/service launches, to enhance their presence in the industry.

ACG - Key offerings include advanced enteric delivery capsules designed for targeted release, ensuring API stability and protection for sensitive pharmaceutical and nutraceutical ingredients.

The industry research and growth report includes detailed analyses of the competitive landscape of the market and information about key companies, including:

  • ACG
  • Ajix Inc.
  • Anhui Huangshan Ltd.
  • Bright Pharma Caps Inc.
  • Dah Feng Capsule Co. Ltd.
  • Healthcaps India Ltd.
  • Lonza Group Ltd.
  • Medicaps Limited
  • Natural Capsules Ltd.
  • Nectar Lifesciences Ltd.
  • Qualicaps Co. Ltd.
  • Roquette Freres SA
  • Roxlor LLC
  • Shanxi Guangsheng Co. Ltd.
  • Snail Pharma Industry Co. Ltd.
  • Suheung Co. Ltd.
  • Sunil Healthcare Ltd.

Qualitative and quantitative analysis of companies has been conducted to help clients understand the wider business environment as well as the strengths and weaknesses of key industry players. Data is qualitatively analyzed to categorize companies as pure play, category-focused, industry-focused, and diversified; it is quantitatively analyzed to categorize companies as dominant, leading, strong, tentative, and weak.

Recent Development and News in Enteric empty capsules sales market

  • In March, 2025, Lonza Capsugel established a Center of Applied Sustainability to focus on reducing the environmental footprint of hard capsule manufacturing, including optimizing energy and resource efficiency.
  • In April, 2025, Commercial Syn Bags, through its subsidiary Comsyn India, entered a share purchase agreement to acquire Erawat Vegcap, a subsidiary of Erawat Pharma, to capture opportunities in the vegetarian and enteric capsule segments.
  • In May, 2025, Natural Capsules Ltd. successfully commissioned its new HPMC production line, positioning the company to expand its market share for premium capsules amid favorable trade environment shifts.
  • In May, 2025, Roquette successfully completed its acquisition of IFF Pharma Solutions, creating a unified Health and Pharma Solutions business group to offer a comprehensive portfolio of excipients and capsule technologies.

Dive into Technavio’s robust research methodology, blending expert interviews, extensive data synthesis, and validated models for unparalleled Enteric Empty Capsules Sales Market insights. See full methodology.

Market Scope
Page number 281
Base year 2025
Historic period 2020-2024
Forecast period 2026-2030
Growth momentum & CAGR Accelerate at a CAGR of 14.5%
Market growth 2026-2030 USD 83816.7 thousand
Market structure Fragmented
YoY growth 2025-2026(%) 13.0%
Key countries US, Canada, Mexico, Germany, UK, France, Italy, Spain, The Netherlands, China, Japan, India, South Korea, Indonesia, Thailand, Brazil, Saudi Arabia, Turkey, South Africa, Argentina, UAE, Colombia and Israel
Competitive landscape Leading Companies, Market Positioning of Companies, Competitive Strategies, and Industry Risks

Request Free Sample

Research Analyst Overview

  • The enteric empty capsules sales market is defined by a significant technological shift toward functionalized polymer shells and intrinsic enteric properties, moving away from traditional secondary coating methods. This evolution addresses the core industry need for a reliable modified-release profile, particularly for sensitive APIs requiring intestinal drug delivery.
  • Innovations in polymer matrix technology, such as HPMC-AS polymer, are critical for ensuring drug-polymer compatibility and predictable pH-triggered dissolution. A key boardroom consideration is the pivot to TiO2-free opacifier solutions to mitigate regulatory risks, influencing both product strategy and supply chain decisions. This proactive formulation change streamlines pharmacopeia compliance and aligns with clean-label excipient trends.
  • By adopting solvent-free encapsulation and advanced multi-particulate systems, manufacturers are enhancing API stability protection and bioavailability. This strategic focus on material science and process optimization has enabled leading firms to improve capsule shell integrity and reduce production lead times by up to 25%, demonstrating a clear return on R&D investment.

What are the Key Data Covered in this Enteric Empty Capsules Sales Market Research and Growth Report?

  • What is the expected growth of the Enteric Empty Capsules Sales Market between 2026 and 2030?

    • USD 83.82 million, at a CAGR of 14.5%

  • What segmentation does the market report cover?

    • The report is segmented by End-user (Pharmaceutical, Health supplements, and Others), Application (Antibiotic and antibacterial drugs, Antacid and antiflatulent preparations, and Others), Product (Gelatin-based enteric capsules, Hydroxypropyl methylcellulose enteric capsules, and Others) and Geography (North America, Europe, Asia, Rest of World (ROW))

  • Which regions are analyzed in the report?

    • North America, Europe, Asia and Rest of World (ROW)

  • What are the key growth drivers and market challenges?

    • Strategic supply chain localization and manufacturing resilience, Regulatory volatility and compliance burdens

  • Who are the major players in the Enteric Empty Capsules Sales Market?

    • ACG, Ajix Inc., Anhui Huangshan Ltd., Bright Pharma Caps Inc., Dah Feng Capsule Co. Ltd., Healthcaps India Ltd., Lonza Group Ltd., Medicaps Limited, Natural Capsules Ltd., Nectar Lifesciences Ltd., Qualicaps Co. Ltd., Roquette Freres SA, Roxlor LLC, Shanxi Guangsheng Co. Ltd., Snail Pharma Industry Co. Ltd., Suheung Co. Ltd. and Sunil Healthcare Ltd.

Market Research Insights

  • The market for enteric empty capsules sales is defined by a strategic pivot toward advanced oral solid dosage forms and supply chain onshoring. This shift addresses the growing need for targeted-release technology, with firms achieving up to a 15% improvement in formulation consistency by adopting vegetarian capsule alternatives.
  • Innovation in drug delivery is driven by the requirement to protect acid-labile compound formulations and support patient-centric drug design. As part of this evolution, manufacturers are focusing on clean-label supplement formulation, where excipient source traceability is critical for consumer trust.
  • Adherence to Quality by Design principles has enabled some producers to reduce batch rejection rates by over 10%, highlighting the operational gains from advanced polymer science and GMP-compliant facilities.

We can help! Our analysts can customize this enteric empty capsules sales market research report to meet your requirements.

Get in touch

1. Executive Summary

1.1 Market overview

Executive Summary - Chart on Market Overview
Executive Summary - Data Table on Market Overview
Executive Summary - Chart on Global Market Characteristics
Executive Summary - Chart on Market by Geography
Executive Summary - Chart on Market Segmentation by End-user
Executive Summary - Chart on Market Segmentation by Application
Executive Summary - Chart on Market Segmentation by Product
Executive Summary - Chart on Incremental Growth
Executive Summary - Data Table on Incremental Growth
Executive Summary - Chart on Company Market Positioning

2. Technavio Analysis

2.1 Analysis of price sensitivity, lifecycle, customer purchase basket, adoption rates, and purchase criteria

2.2 Criticality of inputs and Factors of differentiation

Chart on Overview on criticality of inputs and factors of differentiation

2.3 Factors of disruption

Chart on Overview on factors of disruption

2.4 Impact of drivers and challenges

Chart on Impact of drivers and challenges in 2025 and 2030

3. Market Landscape

3.1 Market ecosystem

Chart on Parent Market
Data Table on - Parent Market

3.2 Market characteristics

Chart on Market characteristics analysis

3.3 Value chain analysis

Chart on Value chain analysis

4. Market Sizing

4.1 Market definition

Data Table on Offerings of companies included in the market definition

4.2 Market segment analysis

Market segments

4.3 Market size 2025

4.4 Market outlook: Forecast for 2025-2030

Chart on Global - Market size and forecast 2025-2030 ($ thousand)
Data Table on Global - Market size and forecast 2025-2030 ($ thousand)
Chart on Global Market: Year-over-year growth 2025-2030 (%)
Data Table on Global Market: Year-over-year growth 2025-2030 (%)

5. Historic Market Size

5.1 Global Enteric Empty Capsules Sales Market 2020 - 2024

Historic Market Size - Data Table on Global Enteric Empty Capsules Sales Market 2020 - 2024 ($ thousand)

5.2 End-user segment analysis 2020 - 2024

Historic Market Size - End-user Segment 2020 - 2024 ($ thousand)

5.3 Application segment analysis 2020 - 2024

Historic Market Size - Application Segment 2020 - 2024 ($ thousand)

5.4 Product segment analysis 2020 - 2024

Historic Market Size - Product Segment 2020 - 2024 ($ thousand)

5.5 Geography segment analysis 2020 - 2024

Historic Market Size - Geography Segment 2020 - 2024 ($ thousand)

5.6 Country segment analysis 2020 - 2024

Historic Market Size - Country Segment 2020 - 2024 ($ thousand)

6. Qualitative Analysis

6.1 Impact of AI on Global Enteric Empty Capsules Sales Market

7. Five Forces Analysis

7.1 Five forces summary

Five forces analysis - Comparison between 2025 and 2030

7.2 Bargaining power of buyers

Bargaining power of buyers - Impact of key factors 2025 and 2030

7.3 Bargaining power of suppliers

Bargaining power of suppliers - Impact of key factors in 2025 and 2030

7.4 Threat of new entrants

Threat of new entrants - Impact of key factors in 2025 and 2030

7.5 Threat of substitutes

Threat of substitutes - Impact of key factors in 2025 and 2030

7.6 Threat of rivalry

Threat of rivalry - Impact of key factors in 2025 and 2030

7.7 Market condition

Chart on Market condition - Five forces 2025 and 2030

8. Market Segmentation by End-user

8.1 Market segments

Chart on End-user - Market share 2025-2030 (%)
Data Table on End-user - Market share 2025-2030 (%)

8.2 Comparison by End-user

Chart on Comparison by End-user
Data Table on Comparison by End-user

8.3 Pharmaceutical - Market size and forecast 2025-2030

Chart on Pharmaceutical - Market size and forecast 2025-2030 ($ thousand)
Data Table on Pharmaceutical - Market size and forecast 2025-2030 ($ thousand)
Chart on Pharmaceutical - Year-over-year growth 2025-2030 (%)
Data Table on Pharmaceutical - Year-over-year growth 2025-2030 (%)

8.4 Health supplements - Market size and forecast 2025-2030

Chart on Health supplements - Market size and forecast 2025-2030 ($ thousand)
Data Table on Health supplements - Market size and forecast 2025-2030 ($ thousand)
Chart on Health supplements - Year-over-year growth 2025-2030 (%)
Data Table on Health supplements - Year-over-year growth 2025-2030 (%)

8.5 Others - Market size and forecast 2025-2030

Chart on Others - Market size and forecast 2025-2030 ($ thousand)
Data Table on Others - Market size and forecast 2025-2030 ($ thousand)
Chart on Others - Year-over-year growth 2025-2030 (%)
Data Table on Others - Year-over-year growth 2025-2030 (%)

8.6 Market opportunity by End-user

Market opportunity by End-user ($ thousand)
Data Table on Market opportunity by End-user ($ thousand)

9. Market Segmentation by Application

9.1 Market segments

Chart on Application - Market share 2025-2030 (%)
Data Table on Application - Market share 2025-2030 (%)

9.2 Comparison by Application

Chart on Comparison by Application
Data Table on Comparison by Application

9.3 Antibiotic and antibacterial drugs - Market size and forecast 2025-2030

Chart on Antibiotic and antibacterial drugs - Market size and forecast 2025-2030 ($ thousand)
Data Table on Antibiotic and antibacterial drugs - Market size and forecast 2025-2030 ($ thousand)
Chart on Antibiotic and antibacterial drugs - Year-over-year growth 2025-2030 (%)
Data Table on Antibiotic and antibacterial drugs - Year-over-year growth 2025-2030 (%)

9.4 Antacid and antiflatulent preparations - Market size and forecast 2025-2030

Chart on Antacid and antiflatulent preparations - Market size and forecast 2025-2030 ($ thousand)
Data Table on Antacid and antiflatulent preparations - Market size and forecast 2025-2030 ($ thousand)
Chart on Antacid and antiflatulent preparations - Year-over-year growth 2025-2030 (%)
Data Table on Antacid and antiflatulent preparations - Year-over-year growth 2025-2030 (%)

9.5 Others - Market size and forecast 2025-2030

Chart on Others - Market size and forecast 2025-2030 ($ thousand)
Data Table on Others - Market size and forecast 2025-2030 ($ thousand)
Chart on Others - Year-over-year growth 2025-2030 (%)
Data Table on Others - Year-over-year growth 2025-2030 (%)

9.6 Market opportunity by Application

Market opportunity by Application ($ thousand)
Data Table on Market opportunity by Application ($ thousand)

10. Market Segmentation by Product

10.1 Market segments

Chart on Product - Market share 2025-2030 (%)
Data Table on Product - Market share 2025-2030 (%)

10.2 Comparison by Product

Chart on Comparison by Product
Data Table on Comparison by Product

10.3 Gelatin-based enteric capsules - Market size and forecast 2025-2030

Chart on Gelatin-based enteric capsules - Market size and forecast 2025-2030 ($ thousand)
Data Table on Gelatin-based enteric capsules - Market size and forecast 2025-2030 ($ thousand)
Chart on Gelatin-based enteric capsules - Year-over-year growth 2025-2030 (%)
Data Table on Gelatin-based enteric capsules - Year-over-year growth 2025-2030 (%)

10.4 Hydroxypropyl methylcellulose enteric capsules - Market size and forecast 2025-2030

Chart on Hydroxypropyl methylcellulose enteric capsules - Market size and forecast 2025-2030 ($ thousand)
Data Table on Hydroxypropyl methylcellulose enteric capsules - Market size and forecast 2025-2030 ($ thousand)
Chart on Hydroxypropyl methylcellulose enteric capsules - Year-over-year growth 2025-2030 (%)
Data Table on Hydroxypropyl methylcellulose enteric capsules - Year-over-year growth 2025-2030 (%)

10.5 Others - Market size and forecast 2025-2030

Chart on Others - Market size and forecast 2025-2030 ($ thousand)
Data Table on Others - Market size and forecast 2025-2030 ($ thousand)
Chart on Others - Year-over-year growth 2025-2030 (%)
Data Table on Others - Year-over-year growth 2025-2030 (%)

10.6 Market opportunity by Product

Market opportunity by Product ($ thousand)
Data Table on Market opportunity by Product ($ thousand)

11. Customer Landscape

11.1 Customer landscape overview

Analysis of price sensitivity, lifecycle, customer purchase basket, adoption rates, and purchase criteria

12. Geographic Landscape

12.1 Geographic segmentation

Chart on Market share by geography 2025-2030 (%)
Data Table on Market share by geography 2025-2030 (%)

12.2 Geographic comparison

Chart on Geographic comparison
Data Table on Geographic comparison

12.3 North America - Market size and forecast 2025-2030

Chart on North America - Market size and forecast 2025-2030 ($ thousand)
Data Table on North America - Market size and forecast 2025-2030 ($ thousand)
Chart on North America - Year-over-year growth 2025-2030 (%)
Data Table on North America - Year-over-year growth 2025-2030 (%)
Chart on Regional Comparison - North America
Data Table on Regional Comparison - North America

12.3.1 US - Market size and forecast 2025-2030

Chart on US - Market size and forecast 2025-2030 ($ thousand)
Data Table on US - Market size and forecast 2025-2030 ($ thousand)
Chart on US - Year-over-year growth 2025-2030 (%)
Data Table on US - Year-over-year growth 2025-2030 (%)

12.3.2 Canada - Market size and forecast 2025-2030

Chart on Canada - Market size and forecast 2025-2030 ($ thousand)
Data Table on Canada - Market size and forecast 2025-2030 ($ thousand)
Chart on Canada - Year-over-year growth 2025-2030 (%)
Data Table on Canada - Year-over-year growth 2025-2030 (%)

12.3.3 Mexico - Market size and forecast 2025-2030

Chart on Mexico - Market size and forecast 2025-2030 ($ thousand)
Data Table on Mexico - Market size and forecast 2025-2030 ($ thousand)
Chart on Mexico - Year-over-year growth 2025-2030 (%)
Data Table on Mexico - Year-over-year growth 2025-2030 (%)

12.4 Europe - Market size and forecast 2025-2030

Chart on Europe - Market size and forecast 2025-2030 ($ thousand)
Data Table on Europe - Market size and forecast 2025-2030 ($ thousand)
Chart on Europe - Year-over-year growth 2025-2030 (%)
Data Table on Europe - Year-over-year growth 2025-2030 (%)
Chart on Regional Comparison - Europe
Data Table on Regional Comparison - Europe

12.4.1 Germany - Market size and forecast 2025-2030

Chart on Germany - Market size and forecast 2025-2030 ($ thousand)
Data Table on Germany - Market size and forecast 2025-2030 ($ thousand)
Chart on Germany - Year-over-year growth 2025-2030 (%)
Data Table on Germany - Year-over-year growth 2025-2030 (%)

12.4.2 UK - Market size and forecast 2025-2030

Chart on UK - Market size and forecast 2025-2030 ($ thousand)
Data Table on UK - Market size and forecast 2025-2030 ($ thousand)
Chart on UK - Year-over-year growth 2025-2030 (%)
Data Table on UK - Year-over-year growth 2025-2030 (%)

12.4.3 France - Market size and forecast 2025-2030

Chart on France - Market size and forecast 2025-2030 ($ thousand)
Data Table on France - Market size and forecast 2025-2030 ($ thousand)
Chart on France - Year-over-year growth 2025-2030 (%)
Data Table on France - Year-over-year growth 2025-2030 (%)

12.4.4 Italy - Market size and forecast 2025-2030

Chart on Italy - Market size and forecast 2025-2030 ($ thousand)
Data Table on Italy - Market size and forecast 2025-2030 ($ thousand)
Chart on Italy - Year-over-year growth 2025-2030 (%)
Data Table on Italy - Year-over-year growth 2025-2030 (%)

12.4.5 Spain - Market size and forecast 2025-2030

Chart on Spain - Market size and forecast 2025-2030 ($ thousand)
Data Table on Spain - Market size and forecast 2025-2030 ($ thousand)
Chart on Spain - Year-over-year growth 2025-2030 (%)
Data Table on Spain - Year-over-year growth 2025-2030 (%)

12.4.6 The Netherlands - Market size and forecast 2025-2030

Chart on The Netherlands - Market size and forecast 2025-2030 ($ thousand)
Data Table on The Netherlands - Market size and forecast 2025-2030 ($ thousand)
Chart on The Netherlands - Year-over-year growth 2025-2030 (%)
Data Table on The Netherlands - Year-over-year growth 2025-2030 (%)

12.5 Asia - Market size and forecast 2025-2030

Chart on Asia - Market size and forecast 2025-2030 ($ thousand)
Data Table on Asia - Market size and forecast 2025-2030 ($ thousand)
Chart on Asia - Year-over-year growth 2025-2030 (%)
Data Table on Asia - Year-over-year growth 2025-2030 (%)
Chart on Regional Comparison - Asia
Data Table on Regional Comparison - Asia

12.5.1 China - Market size and forecast 2025-2030

Chart on China - Market size and forecast 2025-2030 ($ thousand)
Data Table on China - Market size and forecast 2025-2030 ($ thousand)
Chart on China - Year-over-year growth 2025-2030 (%)
Data Table on China - Year-over-year growth 2025-2030 (%)

12.5.2 Japan - Market size and forecast 2025-2030

Chart on Japan - Market size and forecast 2025-2030 ($ thousand)
Data Table on Japan - Market size and forecast 2025-2030 ($ thousand)
Chart on Japan - Year-over-year growth 2025-2030 (%)
Data Table on Japan - Year-over-year growth 2025-2030 (%)

12.5.3 India - Market size and forecast 2025-2030

Chart on India - Market size and forecast 2025-2030 ($ thousand)
Data Table on India - Market size and forecast 2025-2030 ($ thousand)
Chart on India - Year-over-year growth 2025-2030 (%)
Data Table on India - Year-over-year growth 2025-2030 (%)

12.5.4 South Korea - Market size and forecast 2025-2030

Chart on South Korea - Market size and forecast 2025-2030 ($ thousand)
Data Table on South Korea - Market size and forecast 2025-2030 ($ thousand)
Chart on South Korea - Year-over-year growth 2025-2030 (%)
Data Table on South Korea - Year-over-year growth 2025-2030 (%)

12.5.5 Indonesia - Market size and forecast 2025-2030

Chart on Indonesia - Market size and forecast 2025-2030 ($ thousand)
Data Table on Indonesia - Market size and forecast 2025-2030 ($ thousand)
Chart on Indonesia - Year-over-year growth 2025-2030 (%)
Data Table on Indonesia - Year-over-year growth 2025-2030 (%)

12.5.6 Thailand - Market size and forecast 2025-2030

Chart on Thailand - Market size and forecast 2025-2030 ($ thousand)
Data Table on Thailand - Market size and forecast 2025-2030 ($ thousand)
Chart on Thailand - Year-over-year growth 2025-2030 (%)
Data Table on Thailand - Year-over-year growth 2025-2030 (%)

12.6 Rest of World (ROW) - Market size and forecast 2025-2030

Chart on Rest of World (ROW) - Market size and forecast 2025-2030 ($ thousand)
Data Table on Rest of World (ROW) - Market size and forecast 2025-2030 ($ thousand)
Chart on Rest of World (ROW) - Year-over-year growth 2025-2030 (%)
Data Table on Rest of World (ROW) - Year-over-year growth 2025-2030 (%)
Chart on Regional Comparison - Rest of World (ROW)
Data Table on Regional Comparison - Rest of World (ROW)

12.6.1 Brazil - Market size and forecast 2025-2030

Chart on Brazil - Market size and forecast 2025-2030 ($ thousand)
Data Table on Brazil - Market size and forecast 2025-2030 ($ thousand)
Chart on Brazil - Year-over-year growth 2025-2030 (%)
Data Table on Brazil - Year-over-year growth 2025-2030 (%)

12.6.2 Saudi Arabia - Market size and forecast 2025-2030

Chart on Saudi Arabia - Market size and forecast 2025-2030 ($ thousand)
Data Table on Saudi Arabia - Market size and forecast 2025-2030 ($ thousand)
Chart on Saudi Arabia - Year-over-year growth 2025-2030 (%)
Data Table on Saudi Arabia - Year-over-year growth 2025-2030 (%)

12.6.3 Turkey - Market size and forecast 2025-2030

Chart on Turkey - Market size and forecast 2025-2030 ($ thousand)
Data Table on Turkey - Market size and forecast 2025-2030 ($ thousand)
Chart on Turkey - Year-over-year growth 2025-2030 (%)
Data Table on Turkey - Year-over-year growth 2025-2030 (%)

12.6.4 South Africa - Market size and forecast 2025-2030

Chart on South Africa - Market size and forecast 2025-2030 ($ thousand)
Data Table on South Africa - Market size and forecast 2025-2030 ($ thousand)
Chart on South Africa - Year-over-year growth 2025-2030 (%)
Data Table on South Africa - Year-over-year growth 2025-2030 (%)

12.6.5 Argentina - Market size and forecast 2025-2030

Chart on Argentina - Market size and forecast 2025-2030 ($ thousand)
Data Table on Argentina - Market size and forecast 2025-2030 ($ thousand)
Chart on Argentina - Year-over-year growth 2025-2030 (%)
Data Table on Argentina - Year-over-year growth 2025-2030 (%)

12.6.6 UAE - Market size and forecast 2025-2030

Chart on UAE - Market size and forecast 2025-2030 ($ thousand)
Data Table on UAE - Market size and forecast 2025-2030 ($ thousand)
Chart on UAE - Year-over-year growth 2025-2030 (%)
Data Table on UAE - Year-over-year growth 2025-2030 (%)

12.6.7 Colombia - Market size and forecast 2025-2030

Chart on Colombia - Market size and forecast 2025-2030 ($ thousand)
Data Table on Colombia - Market size and forecast 2025-2030 ($ thousand)
Chart on Colombia - Year-over-year growth 2025-2030 (%)
Data Table on Colombia - Year-over-year growth 2025-2030 (%)

12.6.8 Israel - Market size and forecast 2025-2030

Chart on Israel - Market size and forecast 2025-2030 ($ thousand)
Data Table on Israel - Market size and forecast 2025-2030 ($ thousand)
Chart on Israel - Year-over-year growth 2025-2030 (%)
Data Table on Israel - Year-over-year growth 2025-2030 (%)

12.7 Market opportunity by geography

Market opportunity by geography ($ thousand)
Data Tables on Market opportunity by geography ($ thousand)

13. Drivers, Challenges, and Opportunity

13.1 Market drivers

Strategic supply chain localization and manufacturing resilience
Rising incidence of gastrointestinal diseases
Growing demand for vegetarian-based empty capsules

13.2 Market challenges

Regulatory volatility and compliance burdens
Supply chain fragmentation and localization initiatives
Technological integration and consolidation

13.3 Impact of drivers and challenges

Impact of drivers and challenges in 2025 and 2030

13.4 Market opportunities

Strategic supply chain localization and manufacturing onshoring
Consolidation of excipient and capsule capabilities
Expansion of specialized vegetarian capacities and trade adaptation

14. Competitive Landscape

14.1 Overview

14.2

Overview on criticality of inputs and factors of differentiation

14.3 Landscape disruption

Overview on factors of disruption

14.4 Industry risks

Impact of key risks on business

15. Competitive Analysis

15.1 Companies profiled

Companies covered

15.2 Company ranking index

15.3 Market positioning of companies

Matrix on companies position and classification

15.4 ACG

ACG - Overview
ACG - Product / Service
ACG - Key offerings
SWOT

15.5 Ajix Inc.

Ajix Inc. - Overview
Ajix Inc. - Product / Service
Ajix Inc. - Key offerings
SWOT

15.6 Anhui Huangshan Ltd.

Anhui Huangshan Ltd. - Overview
Anhui Huangshan Ltd. - Product / Service
Anhui Huangshan Ltd. - Key offerings
SWOT

15.7 Bright Pharma Caps Inc.

Bright Pharma Caps Inc. - Overview
Bright Pharma Caps Inc. - Product / Service
Bright Pharma Caps Inc. - Key offerings
SWOT

15.8 Healthcaps India Ltd.

Healthcaps India Ltd. - Overview
Healthcaps India Ltd. - Product / Service
Healthcaps India Ltd. - Key offerings
SWOT

15.9 Lonza Group Ltd.

Lonza Group Ltd. - Overview
Lonza Group Ltd. - Business segments
Lonza Group Ltd. - Key news
Lonza Group Ltd. - Key offerings
Lonza Group Ltd. - Segment focus
SWOT

15.10 Medicaps Limited

Medicaps Limited - Overview
Medicaps Limited - Product / Service
Medicaps Limited - Key offerings
SWOT

15.11 Natural Capsules Ltd.

Natural Capsules Ltd. - Overview
Natural Capsules Ltd. - Product / Service
Natural Capsules Ltd. - Key offerings
SWOT

15.12 Nectar Lifesciences Ltd.

Nectar Lifesciences Ltd. - Overview
Nectar Lifesciences Ltd. - Product / Service
Nectar Lifesciences Ltd. - Key offerings
SWOT

15.13 Qualicaps Co. Ltd.

Qualicaps Co. Ltd. - Overview
Qualicaps Co. Ltd. - Product / Service
Qualicaps Co. Ltd. - Key offerings
SWOT

15.14 Roxlor LLC

Roxlor LLC - Overview
Roxlor LLC - Product / Service
Roxlor LLC - Key offerings
SWOT

15.15 Shanxi Guangsheng Co. Ltd.

Shanxi Guangsheng Co. Ltd. - Overview
Shanxi Guangsheng Co. Ltd. - Product / Service
Shanxi Guangsheng Co. Ltd. - Key offerings
SWOT

15.16 Snail Pharma Industry Co. Ltd.

Snail Pharma Industry Co. Ltd. - Overview
Snail Pharma Industry Co. Ltd. - Product / Service
Snail Pharma Industry Co. Ltd. - Key offerings
SWOT

15.17 Suheung Co. Ltd.

Suheung Co. Ltd. - Overview
Suheung Co. Ltd. - Product / Service
Suheung Co. Ltd. - Key offerings
SWOT

15.18 Sunil Healthcare Ltd.

Sunil Healthcare Ltd. - Overview
Sunil Healthcare Ltd. - Product / Service
Sunil Healthcare Ltd. - Key offerings
SWOT

16. Appendix

16.1 Scope of the report

Market definition
Objectives
Notes and caveats

16.2 Inclusions and exclusions checklist

Inclusions checklist
Exclusions checklist

16.3 Currency conversion rates for US$

16.4 Research methodology

16.5 Data procurement

Information sources

16.6 Data validation

16.7 Validation techniques employed for market sizing

16.8 Data synthesis

16.9 360 degree market analysis

16.10 List of abbreviations

Research Methodology

Technavio presents a detailed picture of the market by way of study, synthesis, and summation of data from multiple sources. The analysts have presented the various facets of the market with a particular focus on identifying the key industry influencers. The data thus presented is comprehensive, reliable, and the result of extensive research, both primary and secondary.

INFORMATION SOURCES

Primary sources

  • Manufacturers and suppliers
  • Channel partners
  • Industry experts
  • Strategic decision makers

Secondary sources

  • Industry journals and periodicals
  • Government data
  • Financial reports of key industry players
  • Historical data
  • Press releases

DATA ANALYSIS

Data Synthesis

  • Collation of data
  • Estimation of key figures
  • Analysis of derived insights

Data Validation

  • Triangulation with data models
  • Reference against proprietary databases
  • Corroboration with industry experts

REPORT WRITING

Qualitative

  • Market drivers
  • Market challenges
  • Market trends
  • Five forces analysis

Quantitative

  • Market size and forecast
  • Market segmentation
  • Geographical insights
  • Competitive landscape

Interested in this report?

Get your sample now to see our research methodology and insights!

Download Now

Frequently Asked Questions

Enteric Empty Capsules Sales market growth will increase by USD 83816.7 thousand thousand during 2026-2030 .

The Enteric Empty Capsules Sales market is expected to grow at a CAGR of 14.5% during 2026-2030 .

Enteric Empty Capsules Sales market is segmented by End-user (Pharmaceutical, Health supplements, Others) Application (Antibiotic and antibacterial drugs, Antacid and antiflatulent preparations, Others) Product (Gelatin-based enteric capsules, Hydroxypropyl methylcellulose enteric capsules, Others)

ACG, Ajix Inc., Anhui Huangshan Ltd., Bright Pharma Caps Inc., Dah Feng Capsule Co. Ltd., Healthcaps India Ltd., Lonza Group Ltd., Medicaps Limited, Natural Capsules Ltd., Nectar Lifesciences Ltd., Qualicaps Co. Ltd., Roquette Freres SA, Roxlor LLC, Shanxi Guangsheng Co. Ltd., Snail Pharma Industry Co. Ltd., Suheung Co. Ltd., Sunil Healthcare Ltd. are a few of the key vendors in the Enteric Empty Capsules Sales market.

North America will register the highest growth rate of 40.9% among the other regions. Therefore, the Enteric Empty Capsules Sales market in North America is expected to garner significant business opportunities for the vendors during the forecast period.

US, Canada, Mexico, Germany, UK, France, Italy, Spain, The Netherlands, China, Japan, India, South Korea, Indonesia, Thailand, Brazil, Saudi Arabia, Turkey, South Africa, Argentina, UAE, Colombia, Israel

  • Strategic supply chain localization and manufacturing resilience is the driving factor this market.

The Enteric Empty Capsules Sales market vendors should focus on grabbing business opportunities from the End-user segment as it accounted for the largest market share in the base year.