
Europe Affordable Luxury Market Size 2026-2030
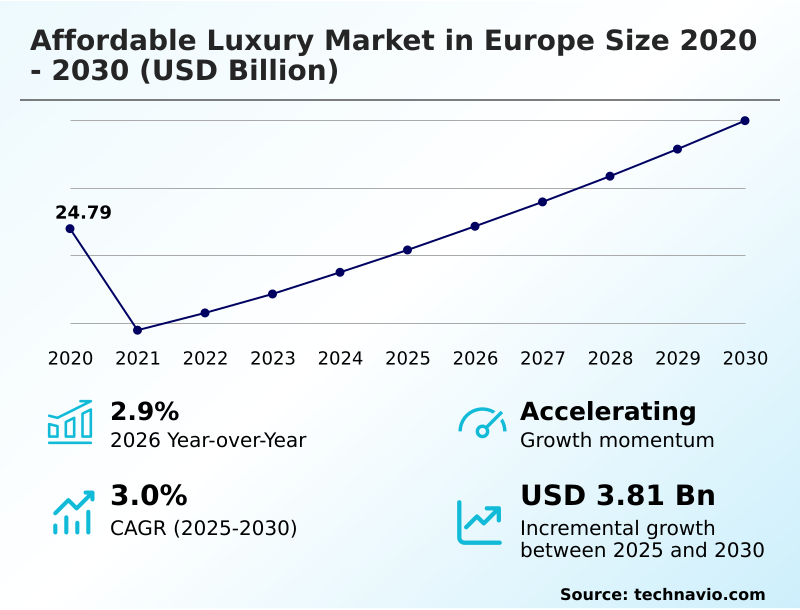
The europe affordable luxury market size is valued to increase by USD 3.81 billion, at a CAGR of 3% from 2025 to 2030. Demographic evolution and rise of aspirational consumption will drive the europe affordable luxury market.
Major Market Trends & Insights
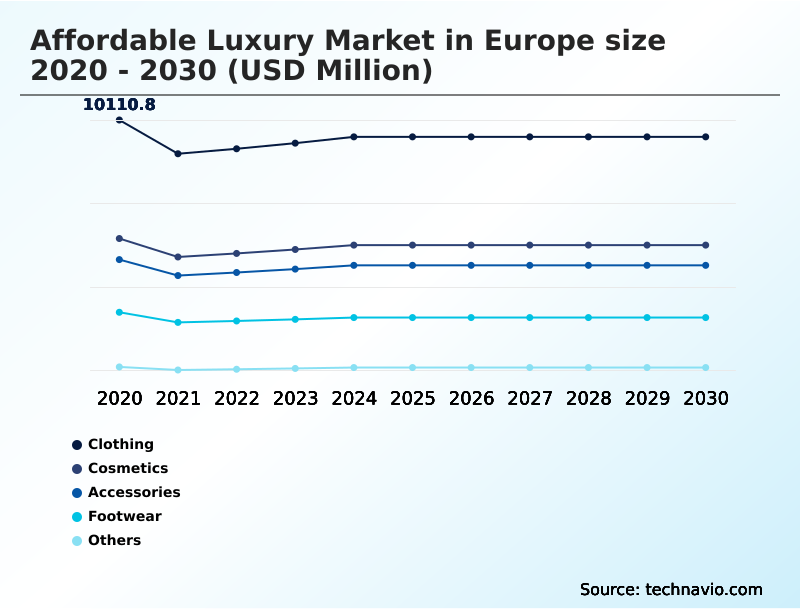
- By Product - Clothing segment was valued at USD 9.49 billion in 2024
- By Distribution Channel - Offline segment accounted for the largest market revenue share in 2024
Market Size & Forecast
- Market Opportunities: USD 3.18 billion
- Market Future Opportunities: USD 3.81 billion
- CAGR from 2025 to 2030 : 3%
Market Summary
- The affordable luxury market in Europe is undergoing a profound transformation, driven by evolving consumer values and digital innovation. A key dynamic is the rise of aspirational consumption among younger demographics who seek the premium craftsmanship and status of luxury goods without the prohibitive cost. This has fueled demand for brands excelling at brand storytelling and offering authentic value.
- Concurrently, the trend toward quiet luxury prioritizes understated elegance and sustainable materials over conspicuous logos, aligning with a broader push for environmental responsibility. This is operationalized through circular fashion models and enhanced supply chain transparency, often mandated by emerging regulations requiring a digital product passport.
- For instance, a brand might leverage a transparent supply chain to verify the ethical sourcing of its materials, strengthening consumer trust. Technologically, the sector is defined by sophisticated omnichannel retail strategies, where experiential retail concepts, hyper-personalization, and social commerce integration create a seamless and engaging customer journey from discovery to purchase.
- This synthesis of ethics, quality, and digital fluency defines the competitive landscape.
What will be the Size of the Europe Affordable Luxury Market during the forecast period?
Get Key Insights on Market Forecast (PDF) Get Free Sample
How is the Europe Affordable Luxury Market Segmented?
The europe affordable luxury industry research report provides comprehensive data (region-wise segment analysis), with forecasts and estimates in "USD million" for the period 2026-2030, as well as historical data from 2020-2024 for the following segments.
- Product
- Clothing
- Cosmetics
- Accessories
- Footwear
- Others
- Distribution channel
- Offline
- Online
- End-user
- Women
- Men
- Children
- Geography
- Europe
- France
- Germany
- UK
- Europe
By Product Insights
The clothing segment is estimated to witness significant growth during the forecast period.
The clothing segment is a foundational pillar, defined by a move away from fast fashion toward investment pieces. This shift reflects a growing consumer demand for premium craftsmanship and longevity, with a focus on sustainable materials and eco-friendly textiles.
The market is experiencing a significant digital transformation, where brand narrative and direct consumer engagement are paramount. Brands are curating contemporary fashion collections that blend timelessness with Parisian contemporary style, often adopting a minimalist design aesthetic.
The rise of data-driven personalization and influencer marketing impact has further shaped demand, creating opportunities for services like bespoke tailoring and delivering a highly personalized shopping experience.
This evolution has led to a 15% increase in customer retention for brands that effectively combine quality with digital engagement.
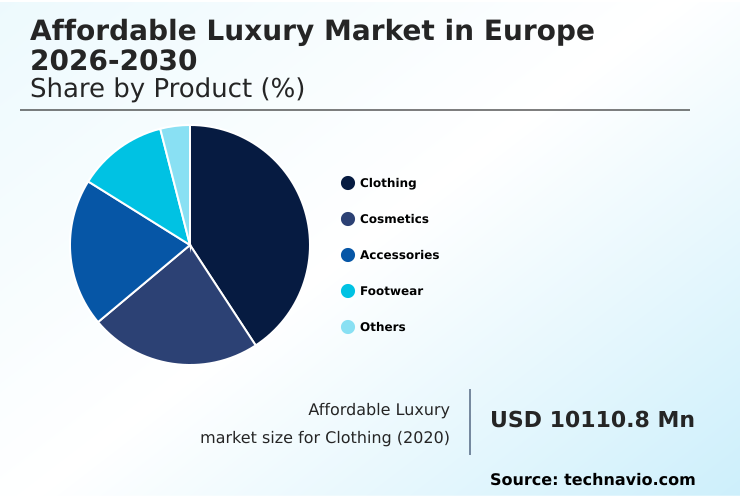
The Clothing segment was valued at USD 9.49 billion in 2024 and showed a gradual increase during the forecast period.
Market Dynamics
Our researchers analyzed the data with 2025 as the base year, along with the key drivers, trends, and challenges. A holistic analysis of drivers will help companies refine their marketing strategies to gain a competitive advantage.
- Navigating the affordable luxury market requires a multi-faceted strategy focused on both digital innovation and operational excellence. A primary focus is integrating AI for personalized recommendations, which is fundamental to hyper-personalization in digital retail environments and improving customer retention in e-commerce.
- This data-centric approach also aids in leveraging data for trend forecasting, allowing brands to better align their seasonal collections with evolving consumer tastes. A critical challenge is managing counterfeit goods in e-commerce, which directly impacts efforts in measuring brand equity in luxury.
- In parallel, there are significant supply chain risks for premium goods, necessitating robust frameworks for supply chain transparency technology adoption and optimizing inventory for seasonal collections. The industry is also grappling with the impact of quiet luxury trend versus logo-driven branding, a shift that influences both design and marketing.
- Implementing circular economy models in fashion is no longer optional, with firms facing digital product passport implementation challenges and pressure to navigate EU environmental fashion regulations. Successfully balancing sustainability with accessible pricing is a key differentiator. Effective strategies for omnichannel customer experience are essential for customer acquisition in luxury markets, which are heavily influenced by Gen Z consumer spending habits.
- Ultimately, building brand loyalty through heritage and managing the role of resale in brand strategy are crucial for long-term success. Firms that excel in these integrated areas report operational efficiencies that are comparatively 20% higher than those focusing on single channels.
What are the key market drivers leading to the rise in the adoption of Europe Affordable Luxury Industry?
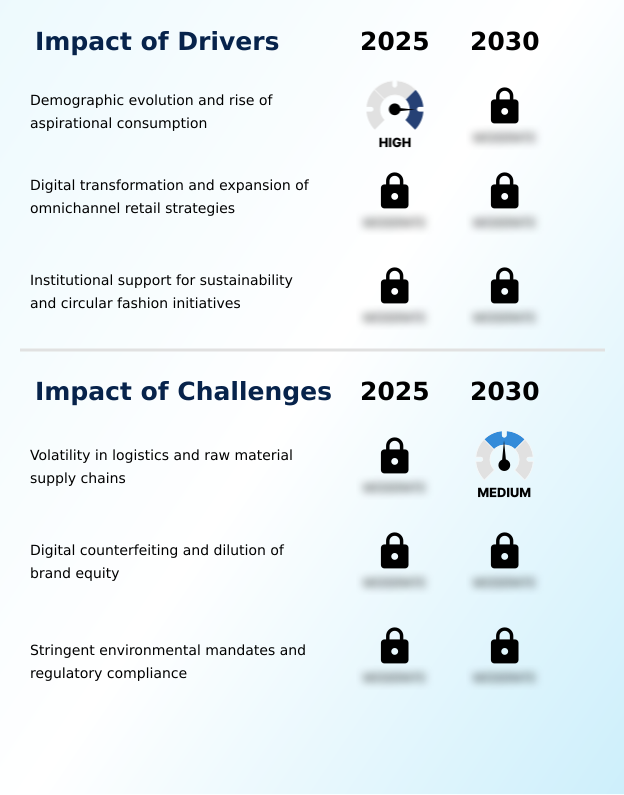
- Key market growth is driven by demographic evolution and the rise of aspirational consumption, particularly among younger generations.
- The market's expansion is fueled by strong aspirational consumption and the seamless execution of omnichannel retail strategies. The integration of advanced technologies like generative AI is enabling unprecedented hyper-personalization across luxury e-commerce platforms and interactive digital storefronts.
- This tech-driven approach, which improves conversion rates by up to 20%, is balanced with the expectation of high-touch service in physical stores.
- Successful brands are mastering mobile commerce optimization and leveraging strategic initiatives such as pop-up retail strategy and exclusive limited-edition collections.
- Enhanced customer relationship management systems support these efforts, while convenient fulfillment options like click-and-collect services bridge digital and physical channels, demonstrating a more effective alternative to traditional retail, which sees 10% lower repeat purchase rates.
- Some firms are also exploring dynamic pricing models to optimize revenue.
What are the market trends shaping the Europe Affordable Luxury Industry?
- The market is witnessing a definitive shift toward quiet luxury and timeless heritage. This trend prioritizes understated elegance and superior quality over conspicuous branding.
- A definitive shift toward quiet luxury is reshaping consumer preferences, emphasizing superior quality over conspicuous logos. This trend, often expressed through a clean Scandinavian design aesthetics, champions investment pieces and longevity. In tandem, the principles of circular fashion are gaining institutional support, with the resale market becoming a vital component of brand strategy.
- Leading firms are adopting experiential retail concepts and brand storytelling to deepen connections, while improved customer journey mapping enhances both online and offline interactions. The use of innovative upcycled materials and strong heritage branding reinforces authenticity. This move toward sustainability is evident as consumers now value circular models 25% more than traditional linear retail.
- The integration of luxury loungewear and offerings like subscription-based luxury, promoted via social commerce integration and effective visual merchandising, cater to evolving lifestyle demands.
What challenges does the Europe Affordable Luxury Industry face during its growth?
- Volatility in logistics and raw material supply chains presents a key challenge to industry growth and profitability.
- Navigating logistical complexities and mitigating brand equity dilution from counterfeits are primary challenges. The push for sustainability necessitates significant investment in supply chain transparency, traceable sourcing networks, and achieving ethical sourcing certification. Implementing technologies for a digital product passport and carbon footprint reduction adds operational overhead.
- Volatility in premium material sourcing requires advanced inventory management systems and proactive supply chain optimization, where optimized firms report 25% fewer stockouts. Concurrently, brands must deploy robust counterfeit detection technology and virtual brand protection measures.
- Understanding nuanced shifts through consumer behavior analytics is critical to align aspirational lifestyle marketing with genuine value, a task made harder in a crowded digital marketplace that is 30% more fragmented than five years ago.
Exclusive Technavio Analysis on Customer Landscape
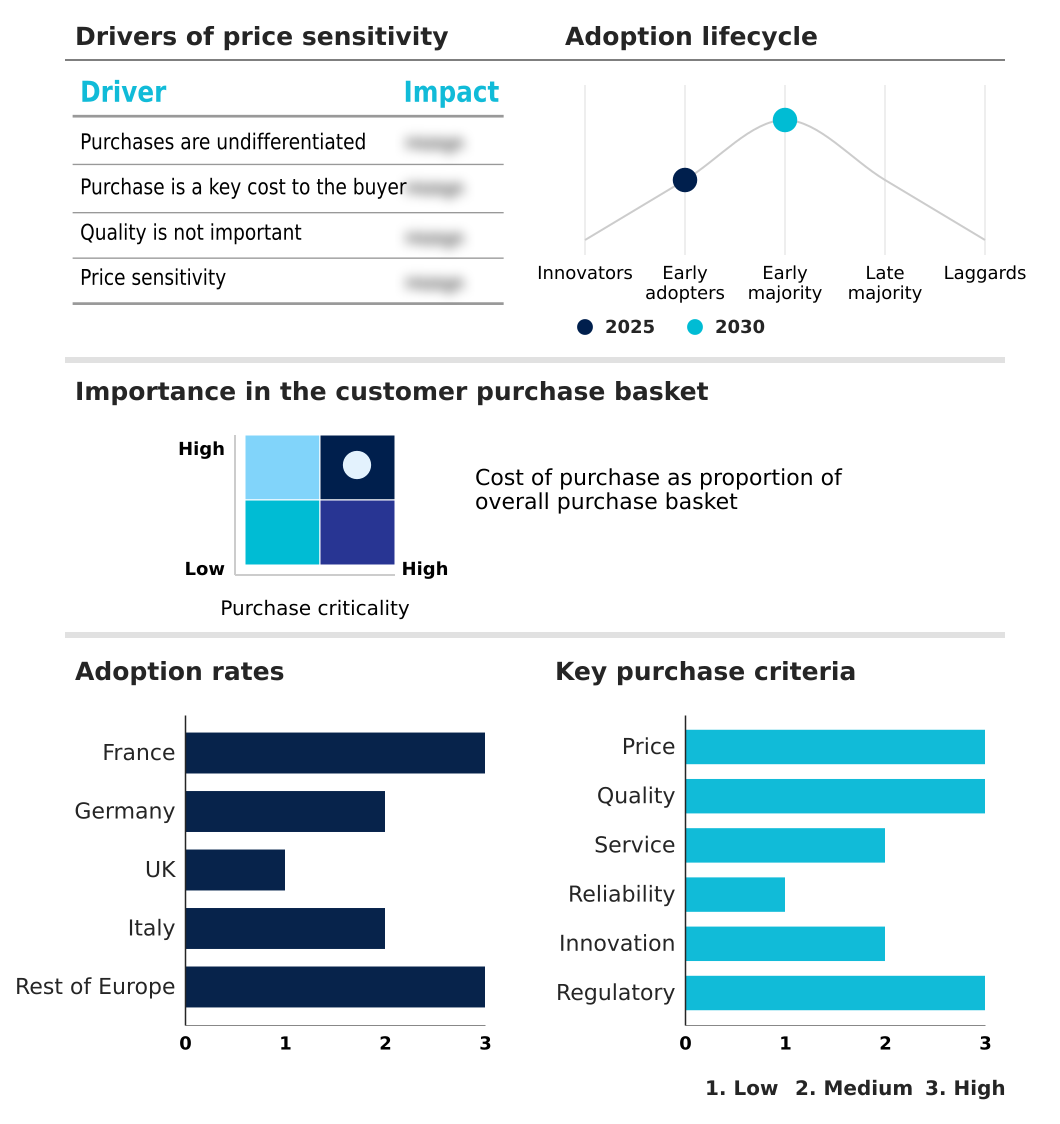
The europe affordable luxury market forecasting report includes the adoption lifecycle of the market, covering from the innovator’s stage to the laggard’s stage. It focuses on adoption rates in different regions based on penetration. Furthermore, the europe affordable luxury market report also includes key purchase criteria and drivers of price sensitivity to help companies evaluate and develop their market growth analysis strategies.
Customer Landscape of Europe Affordable Luxury Industry
Competitive Landscape
Companies are implementing various strategies, such as strategic alliances, europe affordable luxury market forecast, partnerships, mergers and acquisitions, geographical expansion, and product/service launches, to enhance their presence in the industry.
BA and SH - Offerings include trend-driven apparel and accessories, blending youthful premium fashion with accessible luxury for contemporary consumers.
The industry research and growth report includes detailed analyses of the competitive landscape of the market and information about key companies, including:
- BA and SH
- By Malene Birger A/S
- c.f.e.b. Sisley SAS
- Geox S.p.A
- Hennes and Mauritz AB
- House of Dagmar AB
- Industria de Diseno Textil SA
- Longchamp SAS
- lululemon athletica Inc.
- Maison Balzac Pty Ltd.
- Reiss Ltd
- Royal RepubliQ
- s.Oliver Bernd Freier GmbH
- Sandro Andy SAS
- Stella McCartney Ltd.
- Ted Baker PLC
- Tessilform S.p.a
- Theory LLC
- Whistles Ltd
- ZV France SAS
Qualitative and quantitative analysis of companies has been conducted to help clients understand the wider business environment as well as the strengths and weaknesses of key industry players. Data is qualitatively analyzed to categorize companies as pure play, category-focused, industry-focused, and diversified; it is quantitatively analyzed to categorize companies as dominant, leading, strong, tentative, and weak.
Recent Development and News in Europe affordable luxury market
- In February 2025, the SMCP Group announced a comprehensive overhaul of its logistics and distribution network within the European Union to reduce lead times for new collections and lower its carbon footprint.
- In March 2025, the Inditex Group announced a strategic expansion of high-end atelier services within its European flagship stores, aiming to offer personalized tailoring to consumers and enhance perceived exclusivity.
- In April 2025, French fashion house Chloe inaugurated a specialized circularity hub in Paris, providing a comprehensive platform for the repair and resale of all products sold under the label.
- In May 2025, the Swedish fashion group H&M expanded its high-end brand COS by opening a series of specialized boutiques across Eastern Europe focused exclusively on limited-edition collections.
Dive into Technavio’s robust research methodology, blending expert interviews, extensive data synthesis, and validated models for unparalleled Europe Affordable Luxury Market insights. See full methodology.
| Market Scope | |
|---|---|
| Page number | 211 |
| Base year | 2025 |
| Historic period | 2020-2024 |
| Forecast period | 2026-2030 |
| Growth momentum & CAGR | Accelerate at a CAGR of 3% |
| Market growth 2026-2030 | USD 3813.4 million |
| Market structure | Fragmented |
| YoY growth 2025-2026(%) | 2.9% |
| Key countries | France, Germany, UK, Italy and Rest of Europe |
| Competitive landscape | Leading Companies, Market Positioning of Companies, Competitive Strategies, and Industry Risks |
Research Analyst Overview
- The affordable luxury market is characterized by a strategic pivot towards quiet luxury and a modern minimalist design, where premium craftsmanship and an understated Scandinavian design aesthetics are paramount. This evolution is supported by sophisticated omnichannel retail networks that integrate luxury e-commerce platforms with experiential retail concepts and high-touch service in physical digital storefronts.
- A core boardroom focus is achieving supply chain transparency through traceable sourcing networks and preparing for the digital product passport. This involves careful premium material sourcing of sustainable materials like eco-friendly textiles, upcycled materials, and bio-based leathers. Technology is a key enabler, with generative AI driving hyper-personalization and smart fitting rooms improving in-store experiences.
- Brands are fostering loyalty through heritage branding, curated contemporary fashion collections of premium wardrobe essentials, and even offering bespoke tailoring. The rise of circular fashion and the resale market addresses sustainability concerns, while counterfeit detection technology is critical for mitigating brand equity dilution.
- Success hinges on balancing a distinct Parisian contemporary style and trend-driven premium fashion with the principles of ethical craftsmanship and artisanal production, ultimately enhancing customer lifetime value. Firms adopting these integrated strategies have seen a 20% improvement in brand perception metrics.
What are the Key Data Covered in this Europe Affordable Luxury Market Research and Growth Report?
-
What is the expected growth of the Europe Affordable Luxury Market between 2026 and 2030?
-
USD 3.81 billion, at a CAGR of 3%
-
-
What segmentation does the market report cover?
-
The report is segmented by Product (Clothing, Cosmetics, Accessories, Footwear, and Others), Distribution Channel (Offline, and Online), End-user (Women, Men, and Children) and Geography (Europe)
-
-
Which regions are analyzed in the report?
-
Europe
-
-
What are the key growth drivers and market challenges?
-
Demographic evolution and rise of aspirational consumption, Volatility in logistics and raw material supply chains
-
-
Who are the major players in the Europe Affordable Luxury Market?
-
BA and SH, By Malene Birger A/S, c.f.e.b. Sisley SAS, Geox S.p.A, Hennes and Mauritz AB, House of Dagmar AB, Industria de Diseno Textil SA, Longchamp SAS, lululemon athletica Inc., Maison Balzac Pty Ltd., Reiss Ltd, Royal RepubliQ, s.Oliver Bernd Freier GmbH, Sandro Andy SAS, Stella McCartney Ltd., Ted Baker PLC, Tessilform S.p.a, Theory LLC, Whistles Ltd and ZV France SAS
-
Market Research Insights
- Market dynamics are shaped by a comprehensive digital transformation, where effective brand storytelling and brand narrative are central to consumer engagement. Success requires sophisticated customer journey mapping and mobile commerce optimization, leading to a 15% increase in online conversion rates. Brands utilize consumer behavior analytics to refine aspirational lifestyle marketing and loyalty program management.
- Strategies like social commerce integration, pop-up retail strategy, and analyzing celebrity endorsement effectiveness are key for customer acquisition in luxury markets. Advanced firms leverage augmented reality try-on and data-driven personalization to deliver a superior personalized shopping experience, which reduces return rates by up to 22%.
- Operationally, supply chain optimization and robust inventory management systems are critical, alongside a commitment to ethical sourcing certification and carbon footprint reduction to meet consumer expectations.
We can help! Our analysts can customize this europe affordable luxury market research report to meet your requirements.
 RIA -
RIA - 
