Factory Automation Platform As A Service Market Size 2026-2030
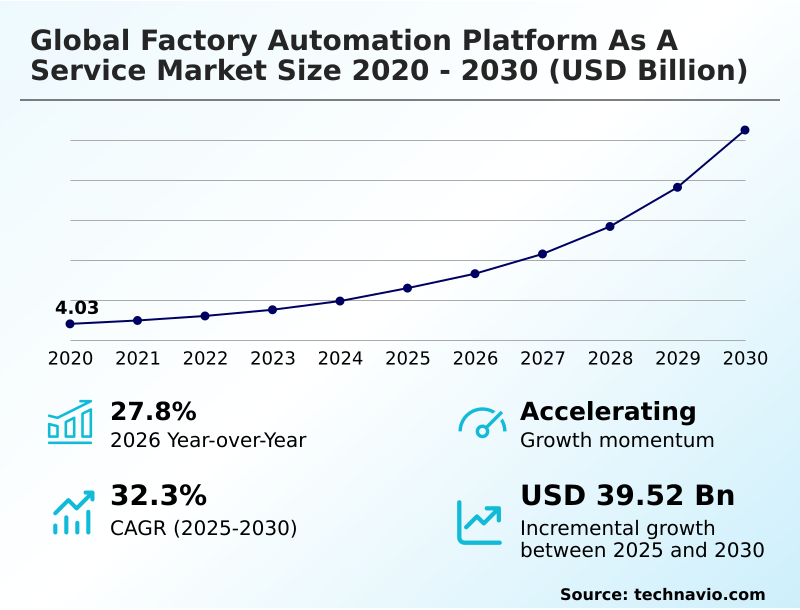
The factory automation platform as a service market size is valued to increase by USD 39.52 billion, at a CAGR of 32.3% from 2025 to 2030. Accelerating adoption of industry 4.0 and IIoT ecosystems will drive the factory automation platform as a service market.
Major Market Trends & Insights
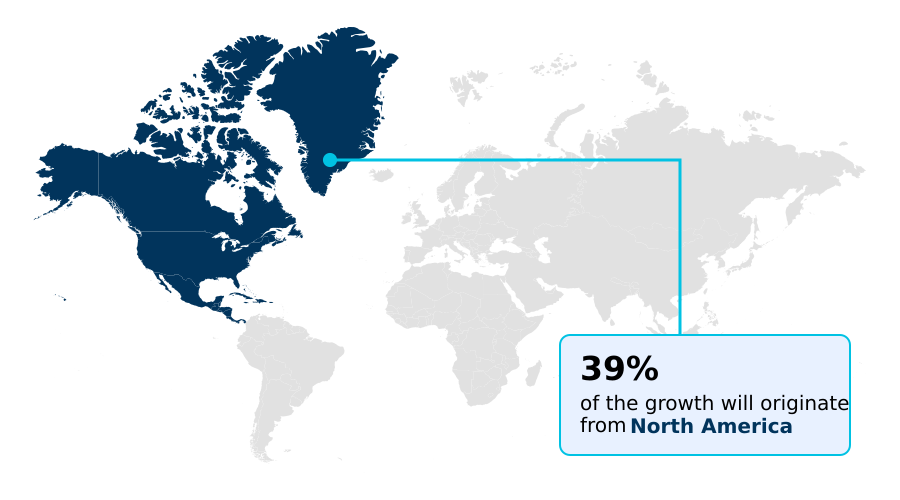
- North America dominated the market and accounted for a 39.1% growth during the forecast period.
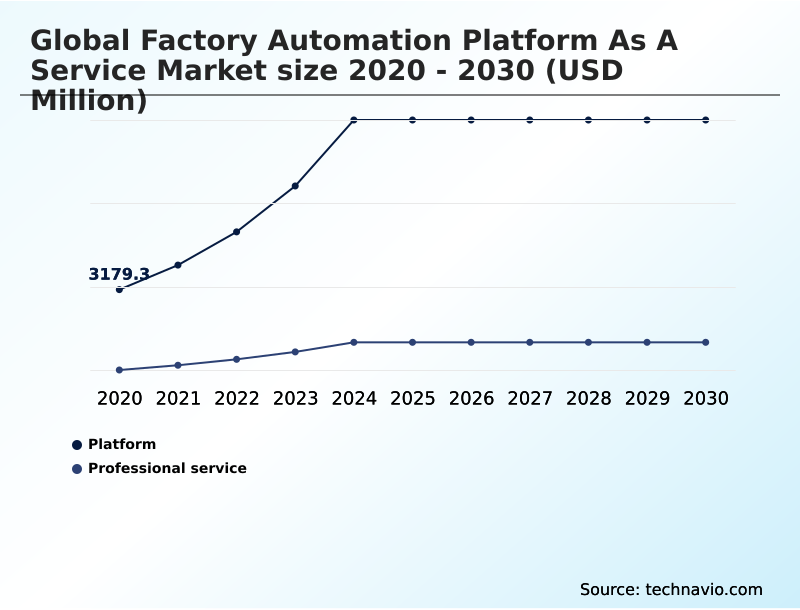
- By Component - Platform segment was valued at USD 8.09 billion in 2024
- By End-user - Large enterprises segment accounted for the largest market revenue share in 2024
Market Size & Forecast
- Market Opportunities: USD 48.46 billion
- Market Future Opportunities: USD 39.52 billion
- CAGR from 2025 to 2030 : 32.3%
Market Summary
- The factory automation platform as a service market is undergoing a profound transformation, driven by the push toward Industry 4.0 and the integration of the industrial internet of things ecosystems. This shift enables a unified approach where machine-level data is instantly available for comprehensive analysis, allowing for predictive maintenance algorithms that identify potential equipment failures before they cause costly downtime.
- A key trend is the adoption of digital twin virtual commissioning, which allows manufacturers to simulate and optimize production lines in a risk-free environment. For instance, an automotive parts supplier can use the platform to model supply chain disruptions and reconfigure workflows in real-time to maintain output.
- However, the increasing connectivity introduces significant cybersecurity vulnerabilities, compelling platform providers to embed robust security protocols. Additionally, the complexity of integrating modern cloud-native industrial architectures with aging legacy systems remains a primary barrier, requiring specialized expertise to bridge the technological gap and unlock the full potential of smart manufacturing.
What will be the Size of the Factory Automation Platform As A Service Market during the forecast period?
Get Key Insights on Market Forecast (PDF) Get Free Sample
How is the Factory Automation Platform As A Service Market Segmented?
The factory automation platform as a service industry research report provides comprehensive data (region-wise segment analysis), with forecasts and estimates in "USD million" for the period 2026-2030, as well as historical data from 2020-2024 for the following segments.
- Component
- Platform
- Professional service
- End-user
- Large enterprises
- SMEs
- Application
- Manufacturing operations
- Supply chain management
- Quality control
- Deployment
- Public cloud
- Hybrid cloud
- Private cloud
- Geography
- North America
- US
- Canada
- Mexico
- APAC
- China
- Japan
- India
- Europe
- Germany
- France
- UK
- South America
- Brazil
- Argentina
- Middle East and Africa
- Saudi Arabia
- UAE
- South Africa
- Rest of World (ROW)
- North America
By Component Insights
The platform segment is estimated to witness significant growth during the forecast period.
The platform segment is the foundational architecture within the factory automation platform as a service market, acting as the central hub for integrating hardware and software into a unified ecosystem.
This component facilitates real-time operational data streaming and enables supervisory control and data acquisition for industrial processes. Organizations leverage the platform for everything from robotics automation platforms to industrial process management systems.
Its scalable nature, built on cloud-native industrial architectures, allows enterprises to expand capacities without major infrastructure investments. By embedding predictive maintenance algorithms, these platforms improve operational equipment effectiveness by up to 15%.
The structure supports centralized command and control operations and seamless motion control system integration, which are critical for achieving lean manufacturing excellence and real-time production visibility across the enterprise.
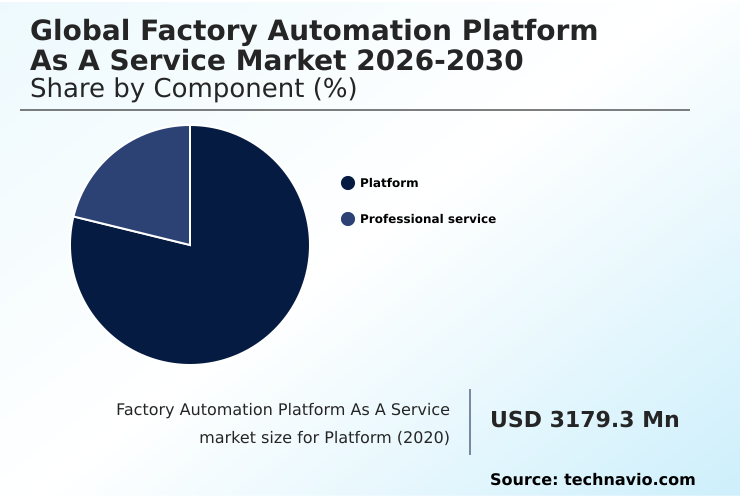
The Platform segment was valued at USD 8.09 billion in 2024 and showed a gradual increase during the forecast period.
Regional Analysis
North America is estimated to contribute 39.1% to the growth of the global market during the forecast period.Technavio’s analysts have elaborately explained the regional trends and drivers that shape the market during the forecast period.
See How Factory Automation Platform As A Service Market Demand is Rising in North America Get Free Sample
The geographic landscape of the market is characterized by varied adoption rates, with North America leading development and accounting for 39.1% of the market's incremental growth.
This region's maturity is driven by a strong focus on digital manufacturing software and smart factory management layers.
In contrast, the APAC region is experiencing rapid industrial modernization, with a focus on implementing industrial data exchange standards and connected plant platforms. European adoption is shaped by stringent regulations, promoting industrial energy management and industrial process control.
Key technologies like industrial edge gateways and solutions enabling industrial data sovereignty are critical for global deployments.
Widespread adoption of these platforms for industrial data governance is enabling manufacturers to achieve unified operational technology security and a holistic shop floor to top floor integration across all regions.
Market Dynamics
Our researchers analyzed the data with 2025 as the base year, along with the key drivers, trends, and challenges. A holistic analysis of drivers will help companies refine their marketing strategies to gain a competitive advantage.
- Enterprises are increasingly conducting a cost-benefit analysis of subscription automation, weighing the opex vs capex for factory automation platforms. Key decisions involve integrating legacy plc systems with paas and understanding the benefits of paas for predictive maintenance, which can reduce unplanned downtime significantly.
- The debate over edge computing vs cloud for latency-sensitive automation is critical, as is using digital twins for factory layout simulation to de-risk investments. For many, the focus is on securing iiot devices in a paas environment and addressing data sovereignty challenges in global paas.
- The rise of low-code platforms for citizen developers in manufacturing is accelerating innovation, allowing for the development of custom apps on an industrial paas. Firms using these tools have reported deploying custom applications 40% faster than with traditional coding. This trend extends to paas for real-time quality control analytics and migrating from on-premise scada to cloud paas.
- Other strategic considerations include paas-based robotics process automation for factories, the role of 5g in factory automation paas, managing ot security in a hybrid cloud setup, paas solutions for multi-site manufacturing, and using generative design for lightweight component manufacturing, all while implementing ai for autonomous process control.
- This shift is particularly beneficial for factory automation paas for smes, which can now access enterprise-grade supply chain visibility through a cloud-native architecture.
What are the key market drivers leading to the rise in the adoption of Factory Automation Platform As A Service Industry?
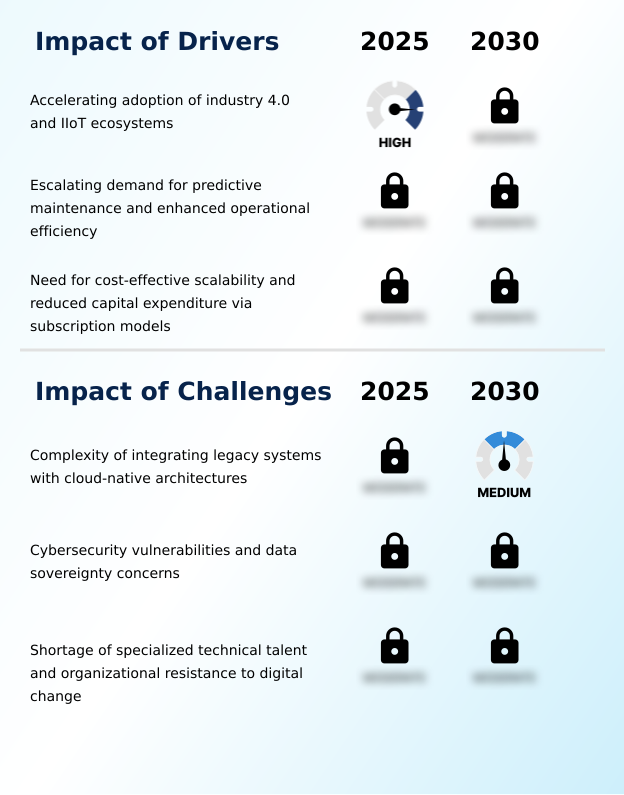
- The accelerating adoption of Industry 4.0 principles and the integration of Industrial Internet of Things ecosystems are primary drivers propelling the factory automation platform as a service market.
- The accelerating adoption of Industry 4.0 and the integration of Industrial Internet of Things (IIoT) ecosystems are primary drivers for the market.
- This transition provides the digital foundation for a cohesive, data-driven network, with implementations showing a 20% improvement in overall equipment effectiveness. The escalating demand for predictive maintenance and enhanced operational efficiency further fuels growth.
- By leveraging machine learning for anomaly detection, platforms enable a shift from reactive to proactive maintenance strategies, extending asset lifecycles by up to 30%. Furthermore, the move toward cost-effective scalability via subscription models is a major catalyst.
- This opex-based approach, which includes demand-oriented resource allocation, lowers entry barriers for SMEs and fosters a more competitive landscape.
- The financial predictability offered by these pay-as-you-go industrial software models is a decisive factor, especially in volatile economic climates, driving broader adoption of factory automation controllers and advanced industrial control systems.
What are the market trends shaping the Factory Automation Platform As A Service Industry?
- The strategic convergence of edge computing with cloud-based automation architectures is a prominent trend reshaping the factory automation platform as a service market. This hybrid approach addresses latency for real-time control while leveraging the cloud for advanced analytics.
- A prominent trend reshaping the market is the convergence of edge computing with cloud-based architectures, creating resilient edge-to-cloud workflows. This hybrid model allows for a more distributed intelligence, where high-speed motion control operations are processed locally to achieve near-zero latency, while long-term trend analysis occurs in the cloud.
- This approach has been shown to improve response times for critical safety shutdowns by over 50%. Another key trend is the proliferation of digital twin technology for virtual commissioning and simulation, enabling manufacturers to test new configurations in a risk-free environment.
- The integration of AI for autonomous production capabilities allows platforms to optimize processes in real-time, adjusting for variables without human intervention. This trend toward intelligent orchestration, supported by virtualized engineering environments and multi-project collaboration tools, is foundational for modern digital manufacturing strategies and remote operational monitoring.
What challenges does the Factory Automation Platform As A Service Industry face during its growth?
- The technical complexity of integrating heterogeneous legacy systems with modern, cloud-native architectures remains a significant challenge affecting widespread market adoption and implementation.
- A significant challenge facing the market is the complexity of integrating modern cloud-native platforms with legacy systems that use proprietary protocols, which can prolong implementation timelines by over 40%. The lack of unified industrial data exchange standards forces many organizations to use costly middleware, adding potential points of failure. Another major hurdle is the heightened risk of cybersecurity vulnerabilities.
- Connecting once-isolated factory floors to the internet expands the attack surface, creating a barrier for leaders who prioritize operational continuity. Industrial data sovereignty presents another complex legal challenge, with varying regional regulations complicating the deployment of global platforms. This often results in a reluctance to fully embrace enterprise asset management in the cloud.
- Finally, a critical shortage of specialized talent skilled in cloud architecture, machine learning, and programmable logic controller integration hinders the ability of organizations to realize the full benefits of their digital investments, with vacant roles staying open 25% longer than other engineering positions.
Exclusive Technavio Analysis on Customer Landscape
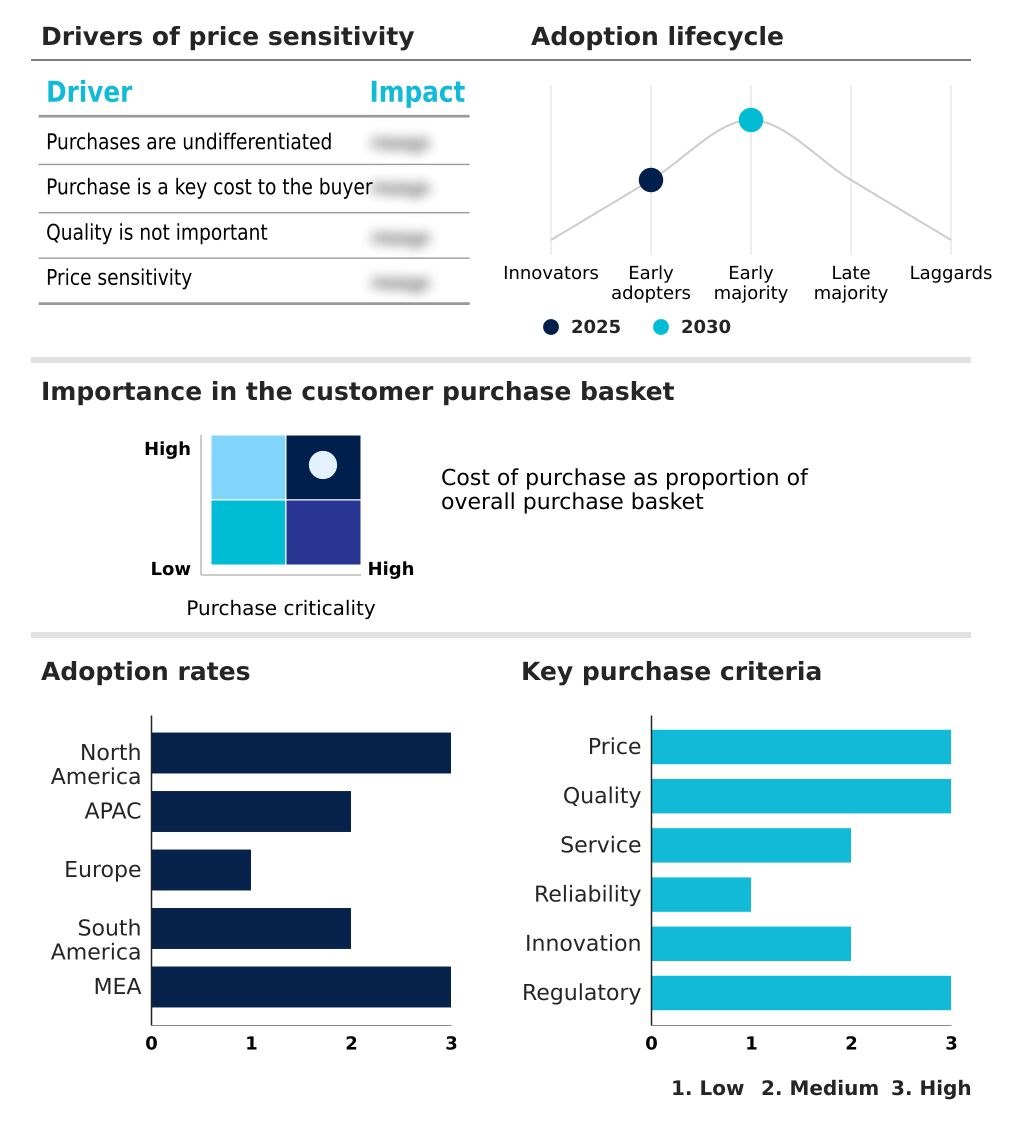
The factory automation platform as a service market forecasting report includes the adoption lifecycle of the market, covering from the innovator’s stage to the laggard’s stage. It focuses on adoption rates in different regions based on penetration. Furthermore, the factory automation platform as a service market report also includes key purchase criteria and drivers of price sensitivity to help companies evaluate and develop their market growth analysis strategies.
Customer Landscape of Factory Automation Platform As A Service Industry
Competitive Landscape
Companies are implementing various strategies, such as strategic alliances, factory automation platform as a service market forecast, partnerships, mergers and acquisitions, geographical expansion, and product/service launches, to enhance their presence in the industry.
ABB Ltd. - Offerings encompass scalable factory automation platforms as a service, including solutions for robotics automation, industrial control systems, and cloud-based industrial IoT deployments.
The industry research and growth report includes detailed analyses of the competitive landscape of the market and information about key companies, including:
- ABB Ltd.
- Advantech Co. Ltd.
- ClearBlade Inc.
- Crosser Technologies AB
- Emerson Electric Co.
- FANUC Corp.
- GE Vernova Inc.
- Hitachi Ltd.
- Honeywell International Inc.
- Litmus Automation Inc.
- Microsoft Corp.
- Mitsubishi Electric Corp.
- Panasonic Holdings Corp.
- PTC Inc.
- Rockwell Automation Inc.
- Schneider Electric SE
- Siemens AG
- Telit Cinterion
- Veea Inc.
- Yokogawa Electric Corp.
Qualitative and quantitative analysis of companies has been conducted to help clients understand the wider business environment as well as the strengths and weaknesses of key industry players. Data is qualitatively analyzed to categorize companies as pure play, category-focused, industry-focused, and diversified; it is quantitatively analyzed to categorize companies as dominant, leading, strong, tentative, and weak.
Recent Development and News in Factory automation platform as a service market
- In March 2025, Rockwell Automation Inc. formed a strategic alliance with Microsoft Corp. to integrate advanced AI and IoT capabilities into cloud-based industrial automation platforms, aiming to enhance data-driven manufacturing for clients.
- In June 2025, Siemens AG announced an expansion of its SIMATIC Software Platform as a Service, introducing virtualized engineering environments to support multi-project collaboration and demand-oriented resource allocation for industrial enterprises.
- In August 2025, Schneider Electric SE broadened its automation platform deployment in Brazil, launching localized cloud-based predictive maintenance modules tailored for the regional mining and agricultural processing sectors.
- In November 2025, Rockwell Automation Inc. demonstrated advanced AI and autonomous system capabilities integrated into its cloud manufacturing platforms at an industry event in Chicago, highlighting a regional focus on intelligent factory operations.
Dive into Technavio’s robust research methodology, blending expert interviews, extensive data synthesis, and validated models for unparalleled Factory Automation Platform As A Service Market insights. See full methodology.
| Market Scope | |
|---|---|
| Page number | 322 |
| Base year | 2025 |
| Historic period | 2020-2024 |
| Forecast period | 2026-2030 |
| Growth momentum & CAGR | Accelerate at a CAGR of 32.3% |
| Market growth 2026-2030 | USD 39522.0 million |
| Market structure | Fragmented |
| YoY growth 2025-2026(%) | 27.8% |
| Key countries | US, Canada, Mexico, China, Japan, India, South Korea, Australia, Indonesia, Germany, France, UK, Italy, The Netherlands, Spain, Brazil, Argentina, Chile, Saudi Arabia, UAE, South Africa, Israel and Egypt |
| Competitive landscape | Leading Companies, Market Positioning of Companies, Competitive Strategies, and Industry Risks |
Research Analyst Overview
- The factory automation platform as a service market is defined by the operational technology and information technology convergence, powered by cloud-native industrial architectures and industrial internet of things ecosystems. This paradigm shift enables real-time operational data streaming and advanced industrial analytics platforms for predictive maintenance algorithms.
- Key offerings include robotics automation platforms and industrial process management systems, often delivered through subscription-based automation models or pay-as-you-go industrial software. A critical trend is digital twin virtual commissioning, which allows boardroom-level decisions on plant expansion to be vetted digitally, reducing physical prototyping costs by over 50%.
- The architecture supports edge-to-cloud workflows with zero-touch provisioning for edge devices and utilizes hybrid cloud for factory automation to balance security and scalability. Innovations such as generative design for manufacturing, autonomous process optimization, and virtualized engineering environments are becoming standard.
- Implementation relies on programmable logic controller integration, motion control system integration, and secure remote access for OT, all governed by strict industrial cybersecurity protocols. Success hinges on a robust smart factory management layer that enables automated quality inspection systems, real-time asset tracking, and centralized command and control operations.
What are the Key Data Covered in this Factory Automation Platform As A Service Market Research and Growth Report?
-
What is the expected growth of the Factory Automation Platform As A Service Market between 2026 and 2030?
-
USD 39.52 billion, at a CAGR of 32.3%
-
-
What segmentation does the market report cover?
-
The report is segmented by Component (Platform, and Professional service), End-user (Large enterprises, and SMEs), Application (Manufacturing operations, Supply chain management, and Quality control), Deployment (Public cloud, Hybrid cloud, and Private cloud) and Geography (North America, APAC, Europe, South America, Middle East and Africa)
-
-
Which regions are analyzed in the report?
-
North America, APAC, Europe, South America and Middle East and Africa
-
-
What are the key growth drivers and market challenges?
-
Accelerating adoption of industry 4.0 and IIoT ecosystems, Complexity of integrating legacy systems with cloud-native architectures
-
-
Who are the major players in the Factory Automation Platform As A Service Market?
-
ABB Ltd., Advantech Co. Ltd., ClearBlade Inc., Crosser Technologies AB, Emerson Electric Co., FANUC Corp., GE Vernova Inc., Hitachi Ltd., Honeywell International Inc., Litmus Automation Inc., Microsoft Corp., Mitsubishi Electric Corp., Panasonic Holdings Corp., PTC Inc., Rockwell Automation Inc., Schneider Electric SE, Siemens AG, Telit Cinterion, Veea Inc. and Yokogawa Electric Corp.
-
Market Research Insights
- The market is shaped by the demand for greater operational efficiency and cost-effective scalability, with subscription-based automation models replacing traditional capital expenditures. Firms are achieving enhanced operational equipment effectiveness through proactive maintenance strategies and real-time asset lifecycle management.
- The integration of digital manufacturing software and factory automation controllers is central, with adoption among SMEs growing twice as fast as in previous years. Industrial automation controllers and smart manufacturing systems are converging, driven by the need for connected plant platforms that offer end-to-end visibility.
- This enables industrial process control and improves factory floor data analytics, with some enterprises reporting a 25% improvement in resource utilization. The shift toward cloud manufacturing platforms is essential for managing industrial energy management and achieving lean manufacturing excellence in a competitive global environment.
We can help! Our analysts can customize this factory automation platform as a service market research report to meet your requirements.
 RIA -
RIA - 
