Ferrochrome Market Analysis APAC, Europe, North America, Middle East and Africa, South America - US, China, India, Japan, Germany - Size and Forecast 2024-2028

Ferrochrome Market Analysis APAC, Europe, North America, Middle East and Africa, South America - US, China, India, Japan, Germany - Size and Forecast 2024-2028

Published: Feb 2024 171 Pages SKU: IRTNTR71318

Market Overview at a Glance

$7.59 B
Market Opportunity
5.94%
CAGR
5.85
YoY growth 2023-2024(%)

Ferrochrome Market Size 2024-2028 

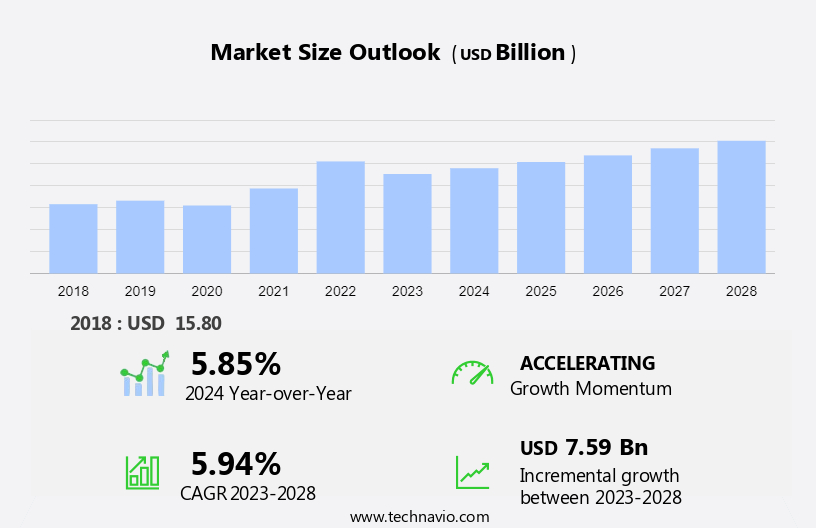
The ferrochrome market size is forecast to increase by USD 7.59 billion, at a CAGR of 5.94% between 2023 and 2028.

  • The market is experiencing significant growth due to the rising demand for electrical energy-intensive industries, particularly in developing countries, where the consumption of stainless steel and other alloy steels is increasing. This trend is being driven by digitalization and the integration of Industry 4.0 technologies into The market.
  • However, the market is also facing challenges from stringent regulations and policies regarding the processing of ferroalloy waste. Chromite ore, a key raw material for producing ferrochrome, is in high demand due to its essential role in the production of ferrochrome and manganese alloys. The high-tension steel industry, which relies heavily on these alloys, is a significant consumer of ferrochrome. The market is expected to continue its growth trajectory, with revenue share projected to increase in the coming years.

What will be the Ferrochrome Market Size During the Forecast Period?

Ferrochrome Market Size

 Request Free Sample

  • Ferrochrome, a significant ferroalloy, plays a crucial role in the production of stainless steel and other special steels. The market is experiencing steady growth due to its extensive application in various industries, including automotive, construction, consumer goods, and infrastructural projects. Ferrochrome is an essential raw material for stainless steel production, accounting for approximately 50-60% of the total chromium content. The automotive industry is a significant consumer of ferrochrome, using it to manufacture high-strength and durable components. In the construction sector, ferrochrome is employed in the production of high-tension steel and alloys steel for infrastructure projects. Additionally, the consumer goods industry utilizes chromium stainless steel in various applications, such as cutlery, kitchen appliances, and water filtration systems. The increasing demand for stainless steel in various industries is driving the growth of the market.
  • Moreover, the development of advanced chromium manganese grades and high carbon ferrochrome is expanding the market's scope. Infrastructural projects, such as water leakage issues in pipelines, are another potential application area for ferrochrome. The market faces challenges, including the volatility of raw material prices, especially manganese and chrome ore, and the high energy consumption involved in ferrochrome production. However, advancements in technology, such as the use of carbon fiber in steel production, may help mitigate these challenges. Despite the challenges, the market is expected to grow due to the increasing demand for stainless steel and special steels in various industries. The market's growth is further fueled by the development of new applications, such as high-performance alloys and tool steels.

How is this market segmented and which is the largest segment?

The market research report provides comprehensive data (region-wise segment analysis), with forecasts and estimates in "USD billion" for the period 2024-2028, as well as historical data from 2018-2022 for the following segments.

  • Product
    • Charge chrome and high carbon
    • Low carbon
    • Medium carbon
  • End-user
    • Stainless steel
    • Carbon and other alloy
    • Others
  • Geography
    • APAC
      • China
      • India
      • Japan
    • Europe
      • Germany
    • North America
      • US
    • Middle East and Africa
    • South America

By Product Insights

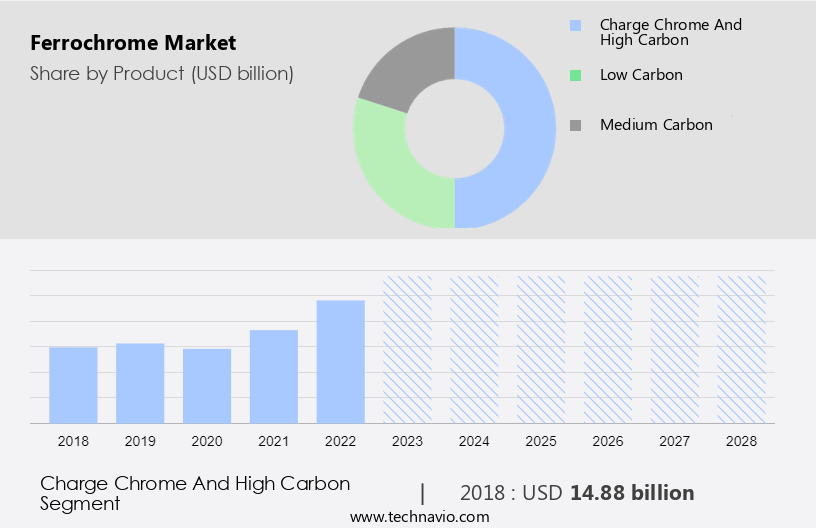
  • The charge chrome and high carbon segment is estimated to witness significant growth during the forecast period.

The market is primarily driven by the demand for alloys, particularly tool steels and stainless steel. Ferrochromium (FeCr), a key component of these alloys, offers enhanced properties such as hardenability, temperature stability, and corrosion resistance. The market for ferrochromium can be segmented based on the type of alloy, with charge chrome and high carbon ferrochrome being the major segments. Charge chrome, which contains chromium (45-57%) and carbon (4-7%), is primarily produced in South Africa and Brazil. High carbon ferrochrome, also known as high-grade ferrochrome, has a chromium content of 65-72% and is mainly sourced from Kazakhstan.

Silicon is also present in charge chrome, with a composition ranging from 2.5% to 7%. The demand for ferrochromium is influenced by urbanization and the resulting increase in infrastructure development and construction projects. As a result, the market for ferrochromium is expected to grow steadily during the forecast period. Stainless steel manufacturers are the primary consumers of ferrochromium, and their increasing production capacity and demand for high-quality alloys are driving the market growth.

Ferrochrome Market Size

Get a glance at the market report of share of various segments Request Free Sample

The charge chrome and high carbon segment was valued at USD 14.88 billion in 2018 and showed a gradual increase during the forecast period.

Regional Analysis

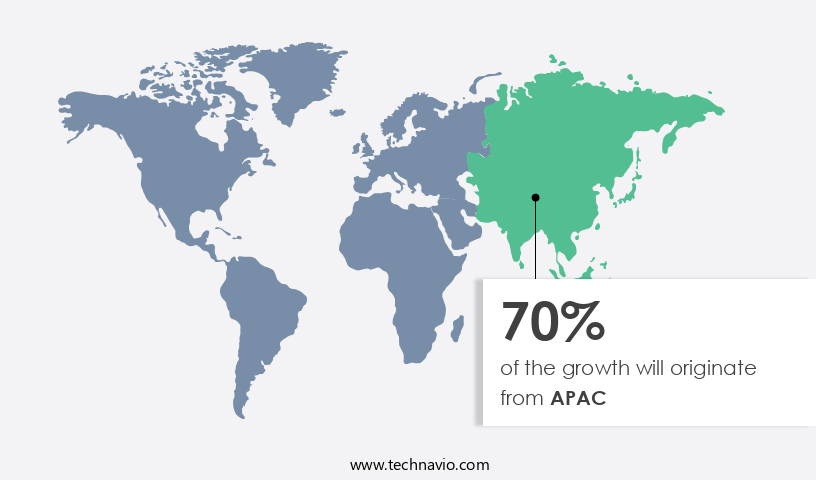
  • APAC is estimated to contribute 70% to the growth of the global market during the forecast period.

Technavio's analysts have elaborately explained the regional trends and drivers that shape the market during the forecast period.

Ferrochrome Market Share by Geography

For more insights on the market share of various regions, Request Free Sample

The market is experiencing significant growth due to the increasing demand for this essential alloy in the production of various types of steel, particularly stainless steel and special steels. Ferrochrome is primarily used as a raw material in the manufacture of high-voltage steel, which is a key component in various industries. APAC, being the largest producer of stainless steel, accounts for over 70% of the global production. Major stainless steel producers in APAC include China, Japan, India, and South Korea. The construction, transportation, and metallurgical industries in APAC are witnessing a rise in demand, leading to an increase in the consumption of ferrochrome. In particular, the construction sector in APAC is driving market growth due to an uptick in infrastructure projects and construction activities.

Market Dynamics

Our researchers analyzed the data with 2023 as the base year, along with the key drivers, trends, and challenges. A holistic analysis of drivers will help companies refine their marketing strategies to gain a competitive advantage.

What are the key market drivers leading to the rise in the adoption of the Ferrochrome Market?

Increasing demand for stainless steel and other alloy steel from developing countries is the key driver of the market.

  • The demand for ferrochrome is escalating in developing economies, particularly in China, India, South Africa, Brazil, and Indonesia, due to its essential role in the production of stainless steel and other alloys. Ferrochrome manufacturers are relocating their operations to these countries to take advantage of abundant raw materials, lower labor and transportation costs, and lenient regulations. This trend is projected to fuel the expansion of The market. The burgeoning automotive industry in Asia Pacific and South America, fueled by rising populations, disposable income, and purchasing power, is driving up investment in this sector.
  • Moreover, the construction industry's increasing demand for durable and corrosion-resistant materials further boosts the consumption of chromium stainless steel. The chromium manganese grade, a significant type of ferrochrome, is in high demand due to its superior properties in various applications. Infrastructural projects, consumer goods manufacturing, and numerous other industries rely on ferrochrome for their production processes. As a result, the market for ferrochrome is poised for significant growth during the forecast period. By maintaining a professional tone and adhering to formal business writing standards, this content aims to provide valuable insights into the current state and future prospects of the market.

What are the market trends shaping the Ferrochrome Market?

Digitalization and Industry 4.0 integration into the market is the upcoming trend in the market.

  • The market is undergoing a significant shift due to the integration of advanced technological solutions. Technologies such as sensors, automation, and data analytics are being employed to enhance the productivity and efficiency of ferrochrome production processes. In the smelting phase, automated systems and intelligent sensors are utilized to monitor real-time parameters, ensuring optimal temperature and chemical composition management. 
  • This data collection is precise, enabling predictive maintenance procedures that minimize downtime and boost overall production. Data analytics plays a pivotal role in optimizing ferrochrome production and informing strategic decisions. Machine learning algorithms analyze vast amounts of data to uncover trends and potential growth opportunities within the ferrochrome industry.

What challenges does the Ferrochrome Market face during the growth?

Stringent regulations and policies regarding ferroalloy processing waste are a key challenge affecting market growth.

  • The market is subject to regulatory oversight from the Environmental Protection Agency (EPA) and REACH regulations, which may impede market expansion. Compliance with these regulations, particularly in the disposal of ferrochrome production waste, can lead to increased costs and reduced production efficiency. Under the Code of Federal Regulations 40 CFR Part 424, the EPA sets guidelines and standards for direct and indirect dischargers in ferroalloy manufacturing.
  • These regulations are implemented through the National Pollutant Discharge Elimination System (NPDES). In the automotive sector, the focus on carbon fiber and automobile safety has led to an increased demand for structural steels and alloy steel. However, the environmental concerns surrounding ferrochrome production waste may pose challenges for market growth. Adhering to these regulations is essential for maintaining market competitiveness and ensuring sustainability in the industry.

Exclusive Customer Landscape

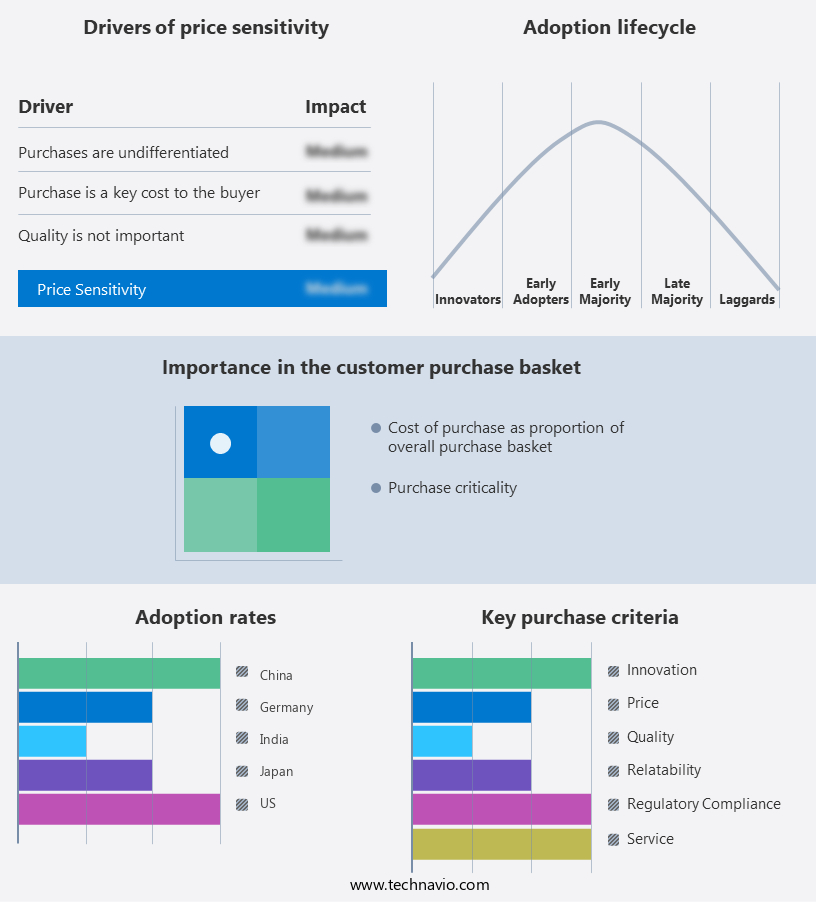
The market forecasting report includes the adoption lifecycle of the market, covering from the innovator's stage to the laggard's stage. It focuses on adoption rates in different regions based on penetration. Furthermore, the market report also includes key purchase criteria and drivers of price sensitivity to help companies evaluate and develop their market growth analysis strategies.

Ferrochrome Market Share by Geography

 Customer Landscape

Key Companies & Market Insights

Companies are implementing various strategies, such as strategic alliances, market forecast, partnerships, mergers and acquisitions, geographical expansion, and product/service launches, to enhance their presence in the market.

The market research and growth report includes detailed analyses of the competitive landscape of the market and information about key companies, including:

  • Afarak Group SE
  • African Rainbow Minerals Ltd.
  • ArcelorMittal
  • Balasore Alloys Ltd.
  • EHUI METALLURGY GROUP
  • Eurasian Resources Group.
  • Ferbasa
  • Glencore Plc
  • Henan Star Metallurgy Material Co. Ltd.
  • INDIAN METALS AND FERRO ALLOYS LTD.
  • Merafe Resources Ltd.
  • Metallic Ferro Alloys LLP
  • Mintal Group Cleantech Development Co.Ltd
  • Mitsubishi Corp.
  • Outokumpu Oyj
  • Samancor Chrome
  • Tata Steel Ltd.
  • Vedanta Ltd
  • Visa Steel Ltd.
  • YILDIRIM Group Of Companies

Qualitative and quantitative analysis of companies has been conducted to help clients understand the wider business environment as well as the strengths and weaknesses of key market players. Data is qualitatively analyzed to categorize companies as pure play, category-focused, industry-focused, and diversified; it is quantitatively analyzed to categorize companies as dominant, leading, strong, tentative, and weak.

Research Analyst Overview

Ferrochrome, also known as ferrochromium (FeCr), is a significant ferroalloy used in the production of various types of steel. This alloy is primarily made from chromite ore, which contains chromium. The process of producing ferrochrome involves reducing chromium oxide to chromium metal, which is then alloyed with iron to form ferrochrome. The global demand for ferrochrome is driven by the increasing consumption of stainless steel and special steels in various industries. The automotive industry is a major consumer of chromium stainless steel due to its corrosion resistance and high strength, making it ideal for automobile safety and structural applications.

In the construction industry, ferrochrome is used in the production of high-tension steel, structural steels, and alloy steels, which are essential for infrastructural projects and urbanization. Moreover, the consumer goods sector also contributes significantly to the demand for ferrochrome. Chromium stainless steel is widely used in the production of kitchen appliances, cutlery, and other household items due to its durability and resistance to rust. The construction of roads, bricks, and pavements also requires the use of ferrochrome in cement and concrete. The revenue share of ferrochrome in the steel industry is substantial due to its role as a crucial raw material.

Market Scope

Report Coverage

Details

Page number

171

Base year

2023

Historic period

2018-2022

Forecast period

2024-2028

Growth momentum & CAGR

Accelerate at a CAGR of 5.94%

Market Growth 2024-2028

USD 7.59 billion

Market structure

Fragmented

YoY growth 2023-2024(%)

5.85

Key countries

US, China, India, Japan, and Germany

Competitive landscape

Leading Companies, Market Positioning of Companies, Competitive Strategies, and Industry Risks

Request Free Sample

What are the Key Data Covered in this Market Research and Growth Report?

  • CAGR of the market during the forecast period
  • Detailed information on factors that will drive the market growth and forecasting between 2024 and 2028
  • Precise estimation of the size of the market  and its contribution of the market in focus to the parent market
  • Accurate predictions about upcoming market growth and trends and changes in consumer behaviour
  • Growth of the market across APAC, Europe, North America, Middle East and Africa, and South America
  • Thorough analysis of the market's competitive landscape and detailed information about companies
  • Comprehensive analysis of factors that will challenge the growth of market companies

We can help! Our analysts can customize this market research report to meet your requirements.

Get in touch

1 Executive Summary

  • 1.1 Market overview
    • Exhibit 01: Executive Summary – Chart on Market Overview
    • Exhibit 02: Executive Summary – Data Table on Market Overview
    • Exhibit 03: Executive Summary – Chart on Global Market Characteristics
    • Exhibit 04: Executive Summary – Chart on Market by Geography
    • Exhibit 05: Executive Summary – Chart on Market Segmentation by Product
    • Exhibit 06: Executive Summary – Chart on Market Segmentation by End-user
    • Exhibit 07: Executive Summary – Chart on Incremental Growth
    • Exhibit 08: Executive Summary – Data Table on Incremental Growth
    • Exhibit 09: Executive Summary – Chart on Vendor Market Positioning

2 Market Landscape

  • 2.1 Market ecosystem
    • Exhibit 10: Parent market
    • Exhibit 11: Market Characteristics

3 Market Sizing

  • 3.1 Market definition
    • Exhibit 12: Offerings of vendors included in the market definition
  • 3.2 Market segment analysis
    • Exhibit 13: Market segments
  • 3.3 Market size 2023
    • 3.4 Market outlook: Forecast for 2023-2028
      • Exhibit 14: Chart on Global - Market size and forecast 2023-2028 ($ billion)
      • Exhibit 15: Data Table on Global - Market size and forecast 2023-2028 ($ billion)
      • Exhibit 16: Chart on Global Market: Year-over-year growth 2023-2028 (%)
      • Exhibit 17: Data Table on Global Market: Year-over-year growth 2023-2028 (%)

    4 Historic Market Size

    • 4.1 Global ferrochrome market 2018 - 2022
      • Exhibit 18: Historic Market Size – Data Table on global ferrochrome market 2018 - 2022 ($ billion)
    • 4.2 Product Segment Analysis 2018 - 2022
      • Exhibit 19: Historic Market Size – Product Segment 2018 - 2022 ($ billion)
    • 4.3 End-user Segment Analysis 2018 - 2022
      • Exhibit 20: Historic Market Size – End-user Segment 2018 - 2022 ($ billion)
    • 4.4 Geography Segment Analysis 2018 - 2022
      • Exhibit 21: Historic Market Size – Geography Segment 2018 - 2022 ($ billion)
    • 4.5 Country Segment Analysis 2018 - 2022
      • Exhibit 22: Historic Market Size – Country Segment 2018 - 2022 ($ billion)

    5 Five Forces Analysis

    • 5.1 Five forces summary
      • Exhibit 23: Five forces analysis - Comparison between 2023 and 2028
    • 5.2 Bargaining power of buyers
      • Exhibit 24: Chart on Bargaining power of buyers – Impact of key factors 2023 and 2028
    • 5.3 Bargaining power of suppliers
      • Exhibit 25: Bargaining power of suppliers – Impact of key factors in 2023 and 2028
    • 5.4 Threat of new entrants
      • Exhibit 26: Threat of new entrants – Impact of key factors in 2023 and 2028
    • 5.5 Threat of substitutes
      • Exhibit 27: Threat of substitutes – Impact of key factors in 2023 and 2028
    • 5.6 Threat of rivalry
      • Exhibit 28: Threat of rivalry – Impact of key factors in 2023 and 2028
    • 5.7 Market condition
      • Exhibit 29: Chart on Market condition - Five forces 2023 and 2028

    6 Market Segmentation by Product

    • 6.1 Market segments
      • Exhibit 30: Chart on Product - Market share 2023-2028 (%)
      • Exhibit 31: Data Table on Product - Market share 2023-2028 (%)
    • 6.2 Comparison by Product
      • Exhibit 32: Chart on Comparison by Product
      • Exhibit 33: Data Table on Comparison by Product
    • 6.3 Charge chrome and high carbon - Market size and forecast 2023-2028
      • Exhibit 34: Chart on Charge chrome and high carbon - Market size and forecast 2023-2028 ($ billion)
      • Exhibit 35: Data Table on Charge chrome and high carbon - Market size and forecast 2023-2028 ($ billion)
      • Exhibit 36: Chart on Charge chrome and high carbon - Year-over-year growth 2023-2028 (%)
      • Exhibit 37: Data Table on Charge chrome and high carbon - Year-over-year growth 2023-2028 (%)
    • 6.4 Low carbon - Market size and forecast 2023-2028
      • Exhibit 38: Chart on Low carbon - Market size and forecast 2023-2028 ($ billion)
      • Exhibit 39: Data Table on Low carbon - Market size and forecast 2023-2028 ($ billion)
      • Exhibit 40: Chart on Low carbon - Year-over-year growth 2023-2028 (%)
      • Exhibit 41: Data Table on Low carbon - Year-over-year growth 2023-2028 (%)
    • 6.5 Medium carbon - Market size and forecast 2023-2028
      • Exhibit 42: Chart on Medium carbon - Market size and forecast 2023-2028 ($ billion)
      • Exhibit 43: Data Table on Medium carbon - Market size and forecast 2023-2028 ($ billion)
      • Exhibit 44: Chart on Medium carbon - Year-over-year growth 2023-2028 (%)
      • Exhibit 45: Data Table on Medium carbon - Year-over-year growth 2023-2028 (%)
    • 6.6 Market opportunity by Product
      • Exhibit 46: Market opportunity by Product ($ billion)
      • Exhibit 47: Data Table on Market opportunity by Product ($ billion)

    7 Market Segmentation by End-user

    • 7.1 Market segments
      • Exhibit 48: Chart on End-user - Market share 2023-2028 (%)
      • Exhibit 49: Data Table on End-user - Market share 2023-2028 (%)
    • 7.2 Comparison by End-user
      • Exhibit 50: Chart on Comparison by End-user
      • Exhibit 51: Data Table on Comparison by End-user
    • 7.3 Stainless steel - Market size and forecast 2023-2028
      • Exhibit 52: Chart on Stainless steel - Market size and forecast 2023-2028 ($ billion)
      • Exhibit 53: Data Table on Stainless steel - Market size and forecast 2023-2028 ($ billion)
      • Exhibit 54: Chart on Stainless steel - Year-over-year growth 2023-2028 (%)
      • Exhibit 55: Data Table on Stainless steel - Year-over-year growth 2023-2028 (%)
    • 7.4 Carbon and other alloy - Market size and forecast 2023-2028
      • Exhibit 56: Chart on Carbon and other alloy - Market size and forecast 2023-2028 ($ billion)
      • Exhibit 57: Data Table on Carbon and other alloy - Market size and forecast 2023-2028 ($ billion)
      • Exhibit 58: Chart on Carbon and other alloy - Year-over-year growth 2023-2028 (%)
      • Exhibit 59: Data Table on Carbon and other alloy - Year-over-year growth 2023-2028 (%)
    • 7.5 Others - Market size and forecast 2023-2028
      • Exhibit 60: Chart on Others - Market size and forecast 2023-2028 ($ billion)
      • Exhibit 61: Data Table on Others - Market size and forecast 2023-2028 ($ billion)
      • Exhibit 62: Chart on Others - Year-over-year growth 2023-2028 (%)
      • Exhibit 63: Data Table on Others - Year-over-year growth 2023-2028 (%)
    • 7.6 Market opportunity by End-user
      • Exhibit 64: Market opportunity by End-user ($ billion)
      • Exhibit 65: Data Table on Market opportunity by End-user ($ billion)

    8 Customer Landscape

    • 8.1 Customer landscape overview
      • Exhibit 66: Analysis of price sensitivity, lifecycle, customer purchase basket, adoption rates, and purchase criteria

    9 Geographic Landscape

    • 9.1 Geographic segmentation
      • Exhibit 67: Chart on Market share by geography 2023-2028 (%)
      • Exhibit 68: Data Table on Market share by geography 2023-2028 (%)
    • 9.2 Geographic comparison
      • Exhibit 69: Chart on Geographic comparison
      • Exhibit 70: Data Table on Geographic comparison
    • 9.3 APAC - Market size and forecast 2023-2028
      • Exhibit 71: Chart on APAC - Market size and forecast 2023-2028 ($ billion)
      • Exhibit 72: Data Table on APAC - Market size and forecast 2023-2028 ($ billion)
      • Exhibit 73: Chart on APAC - Year-over-year growth 2023-2028 (%)
      • Exhibit 74: Data Table on APAC - Year-over-year growth 2023-2028 (%)
    • 9.4 Europe - Market size and forecast 2023-2028
      • Exhibit 75: Chart on Europe - Market size and forecast 2023-2028 ($ billion)
      • Exhibit 76: Data Table on Europe - Market size and forecast 2023-2028 ($ billion)
      • Exhibit 77: Chart on Europe - Year-over-year growth 2023-2028 (%)
      • Exhibit 78: Data Table on Europe - Year-over-year growth 2023-2028 (%)
    • 9.5 North America - Market size and forecast 2023-2028
      • Exhibit 79: Chart on North America - Market size and forecast 2023-2028 ($ billion)
      • Exhibit 80: Data Table on North America - Market size and forecast 2023-2028 ($ billion)
      • Exhibit 81: Chart on North America - Year-over-year growth 2023-2028 (%)
      • Exhibit 82: Data Table on North America - Year-over-year growth 2023-2028 (%)
    • 9.6 Middle East and Africa - Market size and forecast 2023-2028
      • Exhibit 83: Chart on Middle East and Africa - Market size and forecast 2023-2028 ($ billion)
      • Exhibit 84: Data Table on Middle East and Africa - Market size and forecast 2023-2028 ($ billion)
      • Exhibit 85: Chart on Middle East and Africa - Year-over-year growth 2023-2028 (%)
      • Exhibit 86: Data Table on Middle East and Africa - Year-over-year growth 2023-2028 (%)
    • 9.7 South America - Market size and forecast 2023-2028
      • Exhibit 87: Chart on South America - Market size and forecast 2023-2028 ($ billion)
      • Exhibit 88: Data Table on South America - Market size and forecast 2023-2028 ($ billion)
      • Exhibit 89: Chart on South America - Year-over-year growth 2023-2028 (%)
      • Exhibit 90: Data Table on South America - Year-over-year growth 2023-2028 (%)
    • 9.8 China - Market size and forecast 2023-2028
      • Exhibit 91: Chart on China - Market size and forecast 2023-2028 ($ billion)
      • Exhibit 92: Data Table on China - Market size and forecast 2023-2028 ($ billion)
      • Exhibit 93: Chart on China - Year-over-year growth 2023-2028 (%)
      • Exhibit 94: Data Table on China - Year-over-year growth 2023-2028 (%)
    • 9.9 Germany - Market size and forecast 2023-2028
      • Exhibit 95: Chart on Germany - Market size and forecast 2023-2028 ($ billion)
      • Exhibit 96: Data Table on Germany - Market size and forecast 2023-2028 ($ billion)
      • Exhibit 97: Chart on Germany - Year-over-year growth 2023-2028 (%)
      • Exhibit 98: Data Table on Germany - Year-over-year growth 2023-2028 (%)
    • 9.10 US - Market size and forecast 2023-2028
      • Exhibit 99: Chart on US - Market size and forecast 2023-2028 ($ billion)
      • Exhibit 100: Data Table on US - Market size and forecast 2023-2028 ($ billion)
      • Exhibit 101: Chart on US - Year-over-year growth 2023-2028 (%)
      • Exhibit 102: Data Table on US - Year-over-year growth 2023-2028 (%)
    • 9.11 India - Market size and forecast 2023-2028
      • Exhibit 103: Chart on India - Market size and forecast 2023-2028 ($ billion)
      • Exhibit 104: Data Table on India - Market size and forecast 2023-2028 ($ billion)
      • Exhibit 105: Chart on India - Year-over-year growth 2023-2028 (%)
      • Exhibit 106: Data Table on India - Year-over-year growth 2023-2028 (%)
    • 9.12 Japan - Market size and forecast 2023-2028
      • Exhibit 107: Chart on Japan - Market size and forecast 2023-2028 ($ billion)
      • Exhibit 108: Data Table on Japan - Market size and forecast 2023-2028 ($ billion)
      • Exhibit 109: Chart on Japan - Year-over-year growth 2023-2028 (%)
      • Exhibit 110: Data Table on Japan - Year-over-year growth 2023-2028 (%)
    • 9.13 Market opportunity by geography
      • Exhibit 111: Market opportunity by geography ($ billion)
      • Exhibit 112: Data Tables on Market opportunity by geography ($ billion)

    10 Drivers, Challenges, and Trends

    • 10.1 Market drivers
      • 10.2 Market challenges
        • 10.3 Impact of drivers and challenges
          • Exhibit 113: Impact of drivers and challenges in 2023 and 2028
        • 10.4 Market trends

          11 Vendor Landscape

          • 11.1 Overview
            • 11.2 Vendor landscape
              • Exhibit 114: Overview on Criticality of inputs and Factors of differentiation
            • 11.3 Landscape disruption
              • Exhibit 115: Overview on factors of disruption
            • 11.4 Industry risks
              • Exhibit 116: Impact of key risks on business

            12 Vendor Analysis

            • 12.1 Vendors covered
              • Exhibit 117: Vendors covered
            • 12.2 Market positioning of vendors
              • Exhibit 118: Matrix on vendor position and classification
            • 12.3 Afarak Group SE
              • Exhibit 119: Afarak Group SE - Overview
              • Exhibit 120: Afarak Group SE - Business segments
              • Exhibit 121: Afarak Group SE - Key offerings
              • Exhibit 122: Afarak Group SE - Segment focus
            • 12.4 ArcelorMittal
              • Exhibit 123: ArcelorMittal - Overview
              • Exhibit 124: ArcelorMittal - Business segments
              • Exhibit 125: ArcelorMittal - Key news
              • Exhibit 126: ArcelorMittal - Key offerings
              • Exhibit 127: ArcelorMittal - Segment focus
            • 12.5 Balasore Alloys Ltd.
              • Exhibit 128: Balasore Alloys Ltd. - Overview
              • Exhibit 129: Balasore Alloys Ltd. - Product / Service
              • Exhibit 130: Balasore Alloys Ltd. - Key offerings
            • 12.6 EHUI METALLURGY GROUP
              • Exhibit 131: EHUI METALLURGY GROUP - Overview
              • Exhibit 132: EHUI METALLURGY GROUP - Product / Service
              • Exhibit 133: EHUI METALLURGY GROUP - Key offerings
            • 12.7 Eurasian Resources Group.
              • Exhibit 134: Eurasian Resources Group. - Overview
              • Exhibit 135: Eurasian Resources Group. - Product / Service
              • Exhibit 136: Eurasian Resources Group. - Key offerings
            • 12.8 Ferbasa
              • Exhibit 137: Ferbasa - Overview
              • Exhibit 138: Ferbasa - Product / Service
              • Exhibit 139: Ferbasa - Key offerings
            • 12.9 Glencore Plc
              • Exhibit 140: Glencore Plc - Overview
              • Exhibit 141: Glencore Plc - Business segments
              • Exhibit 142: Glencore Plc - Key offerings
              • Exhibit 143: Glencore Plc - Segment focus
            • 12.10 INDIAN METALS AND FERRO ALLOYS LTD.
              • Exhibit 144: INDIAN METALS AND FERRO ALLOYS LTD. - Overview
              • Exhibit 145: INDIAN METALS AND FERRO ALLOYS LTD. - Business segments
              • Exhibit 146: INDIAN METALS AND FERRO ALLOYS LTD. - Key offerings
              • Exhibit 147: INDIAN METALS AND FERRO ALLOYS LTD. - Segment focus
            • 12.11 Mintal Group Cleantech Development Co.Ltd
              • Exhibit 148: Mintal Group Cleantech Development Co.Ltd - Overview
              • Exhibit 149: Mintal Group Cleantech Development Co.Ltd - Product / Service
              • Exhibit 150: Mintal Group Cleantech Development Co.Ltd - Key offerings
            • 12.12 Mitsubishi Corp.
              • Exhibit 151: Mitsubishi Corp. - Overview
              • Exhibit 152: Mitsubishi Corp. - Business segments
              • Exhibit 153: Mitsubishi Corp. - Key news
              • Exhibit 154: Mitsubishi Corp. - Key offerings
              • Exhibit 155: Mitsubishi Corp. - Segment focus
            • 12.13 Outokumpu Oyj
              • Exhibit 156: Outokumpu Oyj - Overview
              • Exhibit 157: Outokumpu Oyj - Business segments
              • Exhibit 158: Outokumpu Oyj - Key news
              • Exhibit 159: Outokumpu Oyj - Key offerings
              • Exhibit 160: Outokumpu Oyj - Segment focus
            • 12.14 Samancor Chrome
              • Exhibit 161: Samancor Chrome - Overview
              • Exhibit 162: Samancor Chrome - Product / Service
              • Exhibit 163: Samancor Chrome - Key offerings
            • 12.15 Tata Steel Ltd.
              • Exhibit 164: Tata Steel Ltd. - Overview
              • Exhibit 165: Tata Steel Ltd. - Business segments
              • Exhibit 166: Tata Steel Ltd. - Key news
              • Exhibit 167: Tata Steel Ltd. - Key offerings
              • Exhibit 168: Tata Steel Ltd. - Segment focus
            • 12.16 Vedanta Ltd
              • Exhibit 169: Vedanta Ltd - Overview
              • Exhibit 170: Vedanta Ltd - Business segments
              • Exhibit 171: Vedanta Ltd - Key offerings
              • Exhibit 172: Vedanta Ltd - Segment focus
            • 12.17 YILDIRIM Group Of Companies
              • Exhibit 173: YILDIRIM Group Of Companies - Overview
              • Exhibit 174: YILDIRIM Group Of Companies - Product / Service
              • Exhibit 175: YILDIRIM Group Of Companies - Key offerings

            13 Appendix

            • 13.1 Scope of the report
              • 13.2 Inclusions and exclusions checklist
                • Exhibit 176: Inclusions checklist
                • Exhibit 177: Exclusions checklist
              • 13.3 Currency conversion rates for US$
                • Exhibit 178: Currency conversion rates for US$
              • 13.4 Research methodology
                • Exhibit 179: Research methodology
                • Exhibit 180: Validation techniques employed for market sizing
                • Exhibit 181: Information sources
              • 13.5 List of abbreviations
                • Exhibit 182: List of abbreviations

              Research Methodology

              Technavio presents a detailed picture of the market by way of study, synthesis, and summation of data from multiple sources. The analysts have presented the various facets of the market with a particular focus on identifying the key industry influencers. The data thus presented is comprehensive, reliable, and the result of extensive research, both primary and secondary.

              INFORMATION SOURCES

              Primary sources

              • Manufacturers and suppliers
              • Channel partners
              • Industry experts
              • Strategic decision makers

              Secondary sources

              • Industry journals and periodicals
              • Government data
              • Financial reports of key industry players
              • Historical data
              • Press releases

              DATA ANALYSIS

              Data Synthesis

              • Collation of data
              • Estimation of key figures
              • Analysis of derived insights

              Data Validation

              • Triangulation with data models
              • Reference against proprietary databases
              • Corroboration with industry experts

              REPORT WRITING

              Qualitative

              • Market drivers
              • Market challenges
              • Market trends
              • Five forces analysis

              Quantitative

              • Market size and forecast
              • Market segmentation
              • Geographical insights
              • Competitive landscape

              Interested in this report?

              Get your sample now to see our research methodology and insights!

              Download Now

              Frequently Asked Questions

              Ferrochrome market growth will increase by $ 7.59 bn during 2024-2028 .

              The Ferrochrome market is expected to grow at a CAGR of 5.94% during 2024-2028 .

              Ferrochrome market is segmented by Product( Charge chrome and high carbon, Low carbon, Medium carbon) End-user( Stainless steel, Carbon and other alloy, Others)

              Afarak Group SE, African Rainbow Minerals Ltd., ArcelorMittal, Balasore Alloys Ltd., EHUI METALLURGY GROUP, Eurasian Resources Group., Ferbasa, Glencore Plc, Henan Star Metallurgy Material Co. Ltd., INDIAN METALS AND FERRO ALLOYS LTD., Merafe Resources Ltd., Metallic Ferro Alloys LLP, Mintal Group Cleantech Development Co.Ltd, Mitsubishi Corp., Outokumpu Oyj, Samancor Chrome, Tata Steel Ltd., Vedanta Ltd, Visa Steel Ltd., YILDIRIM Group Of Companies are a few of the key vendors in the Ferrochrome market.

              APAC will register the highest growth rate of 70% among the other regions. Therefore, the Ferrochrome market in APAC is expected to garner significant business opportunities for the vendors during the forecast period.

              US, China, India, Japan, Germany

              • Increasing demand for stainless steel and other alloy steel from developing countriesThe ferrochrome market is witnessing high growth in developing economies such as China is the driving factor this market.
              • India is the driving factor this market.
              • South Africa is the driving factor this market.
              • Brazil is the driving factor this market.
              • and Indonesia is the driving factor this market.
              • owing to the use of ferrochrome for the production of stainless steel and other alloy steel. Numerous vendors of ferrochrome are shifting their manufacturing sites to India is the driving factor this market.
              • South Africa is the driving factor this market.
              • China is the driving factor this market.
              • and Zimbabwe due to the availability of raw materials is the driving factor this market.
              • low labor and transportation costs is the driving factor this market.
              • and less stringent government regulations and policies in these countries. This is expected to augment the growth of the global ferrochrome market during the forecast period. The growing population is the driving factor this market.
              • disposable income is the driving factor this market.
              • and purchasing power in developing countries of APAC and South America are prompting higher investment in the automobile industry. The use of ferrochrome in making several components in automobiles is the driving factor this market.
              • such as exhaust systems is the driving factor this market.
              • trim is the driving factor this market.
              • and decorative elements is the driving factor this market.
              • is growing. The significant expansion of the automobile sector is expected to boost the demand for stainless steel and other alloy steel is the driving factor this market.
              • driving the demand for ferrochrome globally. This is the driving factor this market.
              • in turn is the driving factor this market.
              • is expected to drive the overall growth of the global ferrochrome market during the forecast period. is the driving factor this market.

              The Ferrochrome market vendors should focus on grabbing business opportunities from the Charge chrome and high carbon segment as it accounted for the largest market share in the base year.