
Generative AI In Customer Services Market Size 2025-2029
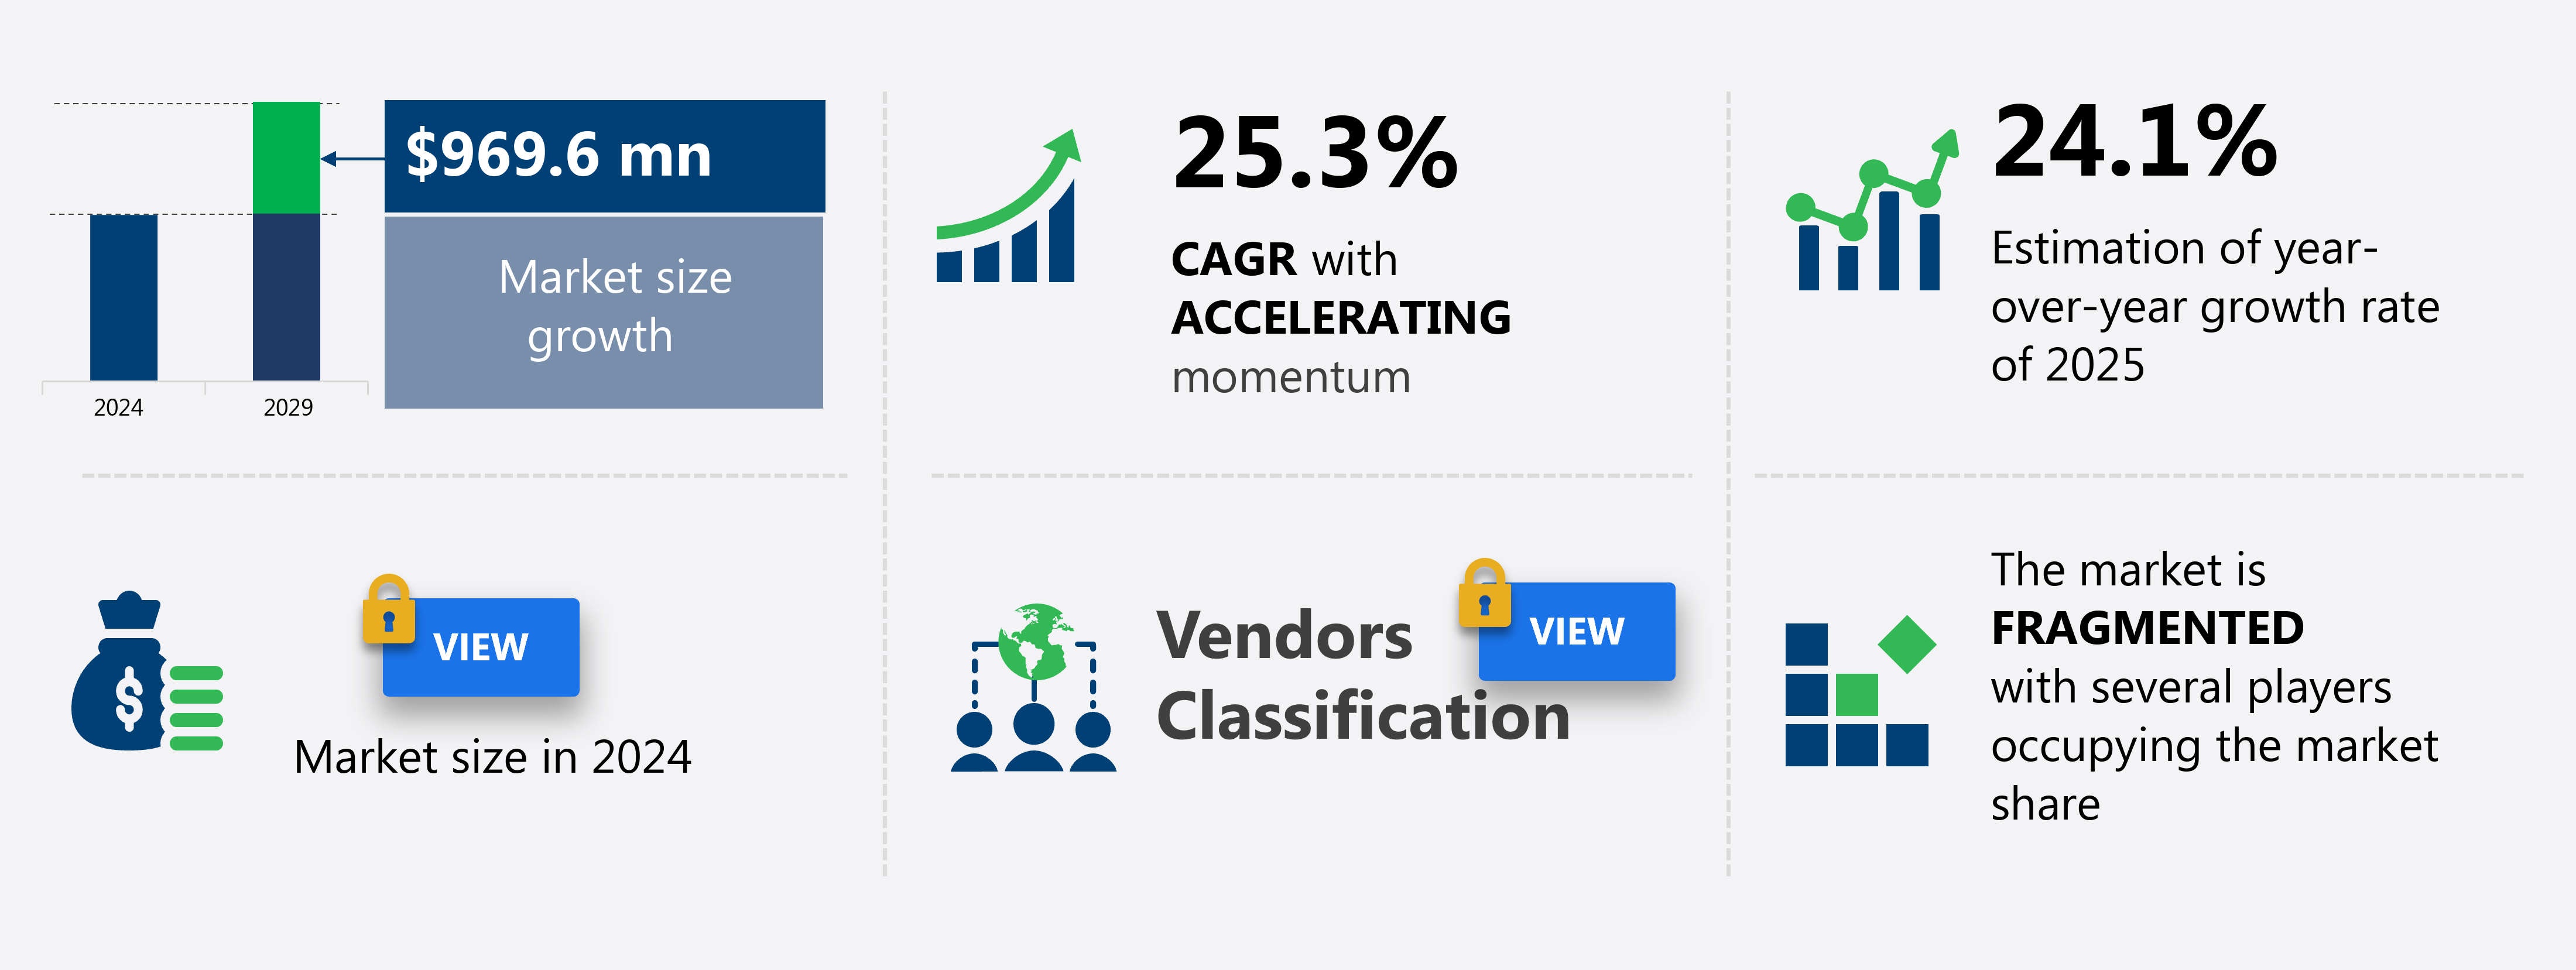
The generative AI in customer services market size is forecast to increase by USD 969.6 million, at a CAGR of 25.3% between 2024 and 2029.
- The market is experiencing significant growth, driven by the rising imperative for hyper-personalized and proactive customer engagement. Companies are increasingly leveraging Generative AI to provide tailored solutions and anticipate customer needs, enhancing the overall customer experience. However, this ascension of hyper-personalization at scale presents complex challenges. Navigating the intricate web of data privacy, security, and evolving regulatory landscapes is essential for businesses seeking to capitalize on this market opportunity. Predictive analytics and Big Data analytics offer advanced capabilities, while deployment models cater to on-premises integration needs.
- Additionally, the integration of Generative AI into existing customer service systems requires careful planning and execution to ensure seamless implementation and optimal performance. Companies must address these challenges head-on to effectively harness the potential of Generative AI in customer services and stay competitive in today's market. Ensuring customer data is protected while generating personalized responses is a critical balance to maintain. Model bias, data privacy, and data security remain critical concerns.
What will be the Size of the Generative AI In Customer Services Market during the forecast period?
Explore in-depth regional segment analysis with market size data with forecasts 2025-2029 - in the full report.
Request Free Sample
- The market for generative AI in customer services continues to evolve, with applications spanning various sectors, including healthcare, finance, and retail. Text-to-speech technology and speech-to-text conversion are integral components, enabling seamless communication between customers and AI systems. A continuous learning system and feedback loop mechanism facilitate improvements, while supervised learning and unsupervised learning algorithms refine intent classification and entity extraction. Security protocols and data privacy measures are essential, with reinforcement learning and model evaluation metrics ensuring compliance with industry standards. Hybrid chatbot approaches, combining rule-based and policy-based systems, provide contextual understanding and response generation. Model training pipelines employ deep learning algorithms, while scalable architecture and API integration strategies ensure efficient integration.
- For instance, a leading retailer reported a 25% increase in sales due to the implementation of a generative AI customer service system. Industry growth is expected to reach 20% annually, driven by the ongoing development of advanced AI technologies and the increasing demand for personalized, efficient customer interactions. Engaging virtual reality (VR) and augmented reality (AR) language learning videos are gaining traction, providing users with authentic language experiences.
How is this Generative AI In Customer Services Market segmented?
The generative AI in customer services market research report provides comprehensive data (region-wise segment analysis), with forecasts and estimates in "USD million" for the period 2025-2029,for the following segments.
- Deployment
- Cloud-based
- On-premises
- Product
- Chatbot and virtual assistance
- Sentiment and feedback analysis tools
- AI driven ticketing system
- Personalized recommendation
- Others
- End-user
- BFSI
- Telecommunication
- Media and entertainment
- Healthcare and life sciences
- Others
- Geography
- North America
- US
- Canada
- Europe
- France
- Germany
- UK
- APAC
- Australia
- China
- India
- Japan
- South America
- Brazil
- Rest of World (ROW)
- North America
By Deployment Insights
The Cloud-based segment is estimated to witness significant growth during the forecast period. The market is witnessing significant growth, with cloud-based deployment leading the way. This model enables businesses to access advanced AI capabilities through third-party cloud service providers like Amazon Web Services, Google Cloud, and Microsoft Azure. The cloud's accessibility, scalability, and economic efficiency make it an attractive option for small and medium-sized enterprises, allowing them to avoid substantial upfront investment in specialized hardware and infrastructure. Generative AI technologies, such as AI-powered chatbots, are revolutionizing customer services by optimizing resolution time, enhancing conversational analytics, and improving first contact resolution. Natural language processing and machine learning models enable intent recognition and response time measurement, while real-time interaction tracking and knowledge graph technology ensure a seamless customer journey.
Contextual awareness engines and proactive customer engagement strategies are driving personalized experiences, while predictive analytics engines and sentiment analysis tools help anticipate customer needs. The implementation of these technologies has led to impressive outcomes. For instance, a leading retailer reported a 30% increase in sales due to the deployment of a voice-enabled chatbot. The market is expected to grow at a rate of 25% annually, as businesses continue to prioritize customer satisfaction and automate support processes using conversational AI platforms, human-in-the-loop systems, and automated ticket routing. Omnichannel customer support is becoming the norm, with dialogue management systems and chatbot integration APIs facilitating seamless interactions across various channels.
Incorporating these technologies results in improved customer support metrics, leading to higher customer satisfaction scores and a more efficient, productive support team. Performance metrics are improved through AI chatbot response time optimization, AI chatbot first contact resolution, and live chat enhancement AI chatbot. Tools like real-time interaction tracking AI, predictive analytics customer service, and agent assist AI customer service streamline support workflows. Features like AI-powered chatbot escalation management, voice-enabled AI chatbot deployment, and sentiment analysis customer service AI round out a robust AI-driven service framework that enhances customer satisfaction and operational efficiency.

Get Key Insights on Market Forecast (PDF)- Request Free Sample
Regional Analysis
North America is estimated to contribute 34% to the growth of the global market during the forecast period. Technavio's analysts have elaborately explained the regional trends and drivers that shape the market during the forecast period.

See How generative AI in customer services market Demand is Rising in North America Request Free Sample
In North America, the generative AI market for customer services is thriving, led predominantly by the United States and Canada. This region's maturity and dominance stem from several factors: the presence of leading AI technology developers, substantial venture capital investments, advanced cloud infrastructure, and a sophisticated consumer base demanding digital-first engagement. Major corporations and tech giants are integrating generative AI into their customer service operations to boost efficiency, personalize interactions, and lower operational costs. The competitive landscape is fierce, driving businesses to adopt advanced solutions, such as AI-powered chatbots, resolution time optimization, conversational analytics, first contact resolution, customer journey mapping, agent assist technology, and predictive analytics engines.
These technologies enable omnichannel customer support, dialogue management systems, chatbot integration APIs, contextual awareness engines, proactive customer engagement, and customer feedback analysis. Virtual agents, voice-enabled chatbots, and AI-driven personalization further enhance the customer experience. The industry is projected to grow by 20% annually, as businesses embrace conversational AI platforms, human-in-the-loop systems, and advanced customer support metrics like natural language processing, machine learning models, automated ticket routing, sentiment analysis tools, self-service knowledge bases, escalation management systems, and customer service automation. Monitoring dashboards and data governance policies ensure performance and compliance with security standards.
Market Dynamics
Our researchers analyzed the data with 2024 as the base year, along with the key drivers, trends, and challenges. A holistic analysis of drivers will help companies refine their marketing strategies to gain a competitive advantage. The Generative AI in Customer Services Market is evolving rapidly, transforming how businesses engage with their customers. At the forefront is the deployment of a conversational AI platform, which enables seamless and intelligent communication. Companies are prioritizing virtual agent deployment to automate routine tasks, improve response times, and reduce human workload. These virtual agents are often supported by a self-service knowledge base, allowing customers to find solutions independently.
To ensure personalization, predictive analytics engine and AI-driven customer service personalization tools analyze behavior in real-time. A human-in-the-loop system enables agents to intervene when complex issues arise, improving service quality. Customer data platform integration ensures that the AI has access to all relevant user data, enhancing the contextual understanding of the AI system. Efficiency is further supported by live chat enhancement, escalation management system, and a contextual awareness engine that guides the conversation intelligently. Advanced capabilities like intent recognition system, dialogue management system, and dialogue state tracking enable more natural conversations.
Organizations use a policy-based chatbot, rule-based chatbot, or a hybrid chatbot approach based on specific business needs. Behind the scenes, the data annotation process and model training pipeline are essential for maintaining accuracy. The a/b testing framework helps test variations for performance improvement, while a strong api integration strategy ensures connectivity with existing systems. Meeting compliance requirements and implementing secure user authentication methods are essential for maintaining trust. Measuring AI chatbot customer service metrics helps track improvements in satisfaction, efficiency, and effectiveness. Neural network architectures and supervised learning provide the foundation for these advancements, while privacy preservation and explainable AI address growing concerns.
Natural conversation capabilities stem from natural language understanding chatbot and machine learning customer support models. Companies are increasingly turning to omnichannel AI chatbot integration for unified customer experiences across platforms, made possible through seamless conversational AI platform deployment. Forward-thinking strategies include proactive engagement AI chatbot strategy and customer journey mapping ai, both of which use real-time behavioral data. Enhanced integration methods, such as customer data platform chatbot integration and self-service knowledge base chatbot integration support faster issue resolution.
What are the key market drivers leading to the rise in the adoption of Generative AI In Customer Services Industry?
- The increasing demand for hyper-personalized and proactive customer engagement is the primary market driver, necessitating businesses to adapt and deliver tailored experiences to maintain a competitive edge. The market is experiencing significant growth due to the evolving consumer landscape. Modern customers, influenced by personalized digital experiences from companies like Netflix, Spotify, and Amazon, now seek more than transactional support. They demand hyper-personalized, contextually aware, and proactive engagement from brands.
- By 2025, the market is projected to reach a value of USD12 billion, representing a substantial increase from its current size. For instance, a leading retailer reported a 10% sales uptick after implementing a generative AI solution that provided personalized product recommendations to customers. Traditional customer service models, with their scripted responses and tiered support systems, struggle to meet these expectations. Generative AI addresses this issue by enabling organizations to deliver bespoke interactions at scale.
What are the market trends shaping the Generative AI In Customer Services Industry?
- The ascension of hyper-personalization at scale is an emerging market trend. This approach to marketing and consumer engagement prioritizes individualized experiences on a grand scale. The market is undergoing a significant transformation, driven by its capacity to deliver hyper-personalized interactions at an unprecedented scale. Beyond basic personalization tactics, such as addressing customers by name in emails, generative AI employs large language models to generate a comprehensive and dynamic understanding of each consumer.
- According to recent studies, the implementation of generative AI in customer services has led to a 15% increase in customer satisfaction ratings. Furthermore, industry experts anticipate that over 50% of customer service interactions will be handled by AI by 2025. These systems process extensive data sources, including past purchasing history, previous support interactions, browsing behavior, sentiment from reviews, and real-time conversational context. Consequently, businesses can create interactions that are not only accurate but also deeply resonant, contextually aware, and empathetic.
What challenges does the Generative AI In Customer Services Industry face during its growth?
- The intricate interplay of data privacy, security, and ever-evolving regulatory landscapes poses a significant challenge to the industry's growth trajectory. Navigating this intricate web of requirements is essential for businesses to maintain compliance and protect sensitive information, ultimately ensuring trust with their customers and stakeholders. Generative AI, driven by large language models (LLMs), holds significant promise for enhancing customer service experiences. However, the adoption of this technology faces a major hurdle in the form of data privacy, security, and regulatory compliance.
- For instance, a leading retailer reported a 20% increase in customer satisfaction after implementing a generative AI-powered chatbot for handling customer queries. Despite these benefits, ensuring data privacy and security remains a formidable challenge, necessitating robust compliance frameworks and advanced data protection measures. With customer service applications relying on vast amounts of personally identifiable information (PII) for training, organizations are confronted with a complex and evolving data protection landscape. According to recent studies, the global generative AI market in customer services is projected to grow by over 25% annually, underscoring its increasing importance.
Exclusive Customer Landscape
The generative AI in customer services market forecasting report includes the adoption lifecycle of the market, covering from the innovator's stage to the laggard's stage. It focuses on adoption rates in different regions based on penetration. Furthermore, the generative AI in customer services market report also includes key purchase criteria and drivers of price sensitivity to help companies evaluate and develop their market growth analysis strategies.

Customer Landscape
Key Companies & Market Insights
Companies are implementing various strategies, such as strategic alliances, generative AI in customer services market forecast, partnerships, mergers and acquisitions, geographical expansion, and product/service launches, to enhance their presence in the industry.
[24]7.ai Inc. - The company specializes in generative AI for customer services, offering Amazon Bedrock for building foundation models and Amazon Connect, a GenAI-powered AI contact center solution.
The industry research and growth report includes detailed analyses of the competitive landscape of the market and information about key companies, including:
- [24]7.ai Inc.
- Amazon Web Services Inc.
- Bitonic Technology Labs Inc.
- Cresta
- Five9 Inc.
- Forethought
- Genesys Telecommunications Laboratories Inc.
- Google Cloud
- HubSpot Inc.
- International Business Machines Corp.
- Jio Haptik Technologies Ltd.
- Kore.ai Inc.
- Microsoft Corp.
- NICE Ltd.
- OpenAI
- Oracle Corp.
- Salesforce Inc.
- SAP SE
- Sprinklr Inc.
- Verint Systems Inc.
Qualitative and quantitative analysis of companies has been conducted to help clients understand the wider business environment as well as the strengths and weaknesses of key industry players. Data is qualitatively analyzed to categorize companies as pure play, category-focused, industry-focused, and diversified; it is quantitatively analyzed to categorize companies as dominant, leading, strong, tentative, and weak.
Recent Development and News in Generative AI In Customer Services Market
- In January 2024, IBM announced the integration of its Watson Assistant with its generative AI technology, enabling businesses to create personalized, conversational experiences for their customers (IBM Press Release).
- In March 2024, Microsoft and OpenAI, the creators of ChatGPT, formed a strategic partnership to integrate OpenAI's generative AI models into Microsoft's customer service solutions, enhancing their capabilities in handling complex queries (Microsoft News Center).
- In May 2024, Amazon's AI customer service platform, Amazon Connect, received regulatory approval in the European Union, expanding its reach and enabling more businesses to leverage generative AI for their customer service operations (Amazon Investor Relations).
- In April 2025, Google Cloud secured a significant investment of USD 2.9 billion in its generative AI division, DeepMind, to accelerate the development and deployment of AI-powered customer service solutions (Google Cloud Press Release).
Research Analyst Overview
- The market for generative AI in customer services continues to evolve, with applications spanning various sectors, including healthcare, finance, and retail. Text-to-speech technology and speech-to-text conversion are integral components, enabling seamless communication between customers and AI systems. A continuous learning system and feedback loop mechanism facilitate improvements, while supervised learning and unsupervised learning algorithms refine intent classification and entity extraction. Security protocols and data privacy measures are essential, with reinforcement learning and model evaluation metrics ensuring compliance with industry standards. Hybrid chatbot approaches, combining rule-based and policy-based systems, provide contextual understanding and response generation. Model training pipelines employ deep learning algorithms, while scalable architecture and API integration strategies ensure efficient integration.
- For instance, a leading retailer reported a 25% increase in sales due to the implementation of a generative AI customer service system. Industry growth is expected to reach 20% annually, driven by the ongoing development of advanced AI technologies and the increasing demand for personalized, efficient customer interactions.
Dive into Technavio's robust research methodology, blending expert interviews, extensive data synthesis, and validated models for unparalleled Generative AI In Customer Services Market insights. See full methodology.
|
Market Scope |
|
|
Report Coverage |
Details |
|
Page number |
241 |
|
Base year |
2024 |
|
Forecast period |
2025-2029 |
|
Growth momentum & CAGR |
Accelerate at a CAGR of 25.3% |
|
Market growth 2025-2029 |
USD 969.6 million |
|
Market structure |
Fragmented |
|
YoY growth 2024-2025(%) |
24.1 |
|
Key countries |
China, India, Japan, Australia, Germany, UK, France, US, Canada, and Brazil |
|
Competitive landscape |
Leading Companies, Market Positioning of Companies, Competitive Strategies, and Industry Risks |
What are the Key Data Covered in this Generative AI In Customer Services Market Research and Growth Report?
- CAGR of the Generative AI In Customer Services industry during the forecast period
- Detailed information on factors that will drive the growth and forecasting between 2025 and 2029
- Precise estimation of the size of the market and its contribution of the industry in focus to the parent market
- Accurate predictions about upcoming growth and trends and changes in consumer behaviour
- Growth of the market across North America, Europe, APAC, South America, and Middle East and Africa
- Thorough analysis of the market's competitive landscape and detailed information about companies
- Comprehensive analysis of factors that will challenge the generative AI in customer services market growth of industry companies
We can help! Our analysts can customize this generative AI in customer services market research report to meet your requirements.
 RIA -
RIA - 
