Green Ai Infrastructure Market Size and Growth Forecast 2026-2030
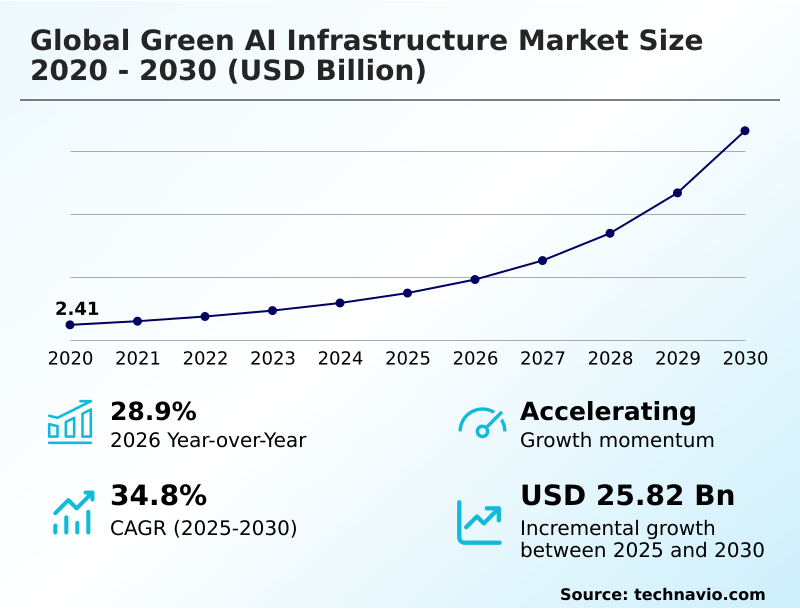
The Green Ai Infrastructure Market size was valued at USD 7.47 billion in 2025 growing at a CAGR of 34.8% during the forecast period 2026-2030.
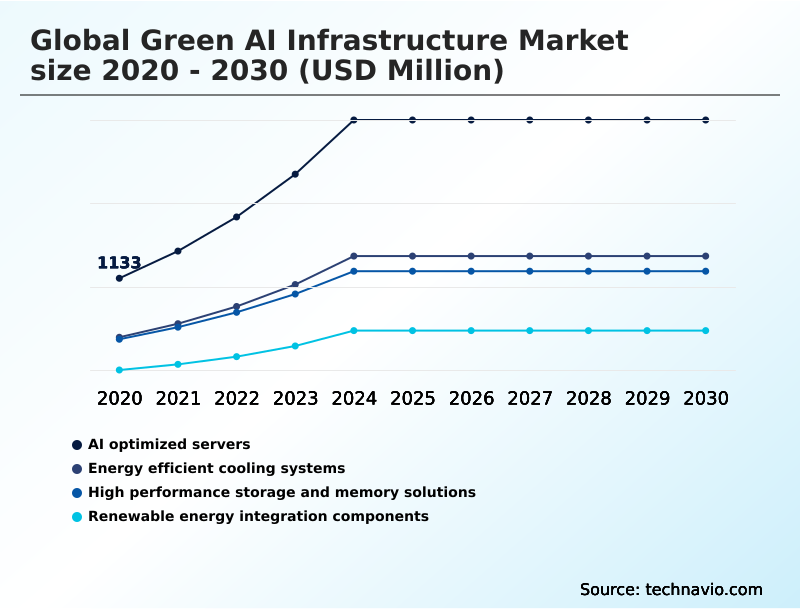
North America accounts for 41% of incremental growth during the forecast period. The AI optimized servers segment by Product was valued at USD 2.72 billion in 2024, while the Cloud service providers segment holds the largest revenue share by End-user.
The market is projected to grow by USD 30.88 billion from 2020 to 2030, with USD 25.82 billion of the growth expected during the forecast period of 2025 to 2030.
Get Key Insights on Market Forecast (PDF) Request Free Sample
Green Ai Infrastructure Market Overview
The green AI infrastructure market is fundamentally shaped by the operational imperative to reconcile the exponential growth of high-performance computing (HPC) workloads with escalating energy costs and stringent environmental mandates. This has shifted procurement focus toward sustainable IT infrastructure that prioritizes data center energy efficiency and a low power usage effectiveness (PUE) ratio. For instance, a hyperscale facility in a water-stressed region implementing closed-loop cooling systems can reduce water consumption by over 95% compared to evaporative cooling towers, a critical factor for operational licensing under frameworks like the EU Green Deal. This move toward green computing solutions is not just about compliance but also about resource resilience, with North America contributing over 41% to incremental growth, driven by investments in renewable energy integration and carbon-aware computing. Enterprises are increasingly adopting AI workload optimization techniques and specialized low-power processors to ensure that the expansion of AI capabilities does not lead to an unsustainable increase in their carbon footprint, making carbon footprint tracking a standard practice in IT operations. The development of grid-interactive data centers further enhances sustainability by allowing facilities to support local energy grids during peak demand.
Drivers, Trends, and Challenges in the Green Ai Infrastructure Market
Strategic decisions within the green AI infrastructure market are increasingly shaped by complex operational and financial trade-offs. For instance, the discussion around direct-to-chip vs immersion cooling efficiency is central to a data center's design, as liquid cooling can reduce energy consumption for thermal management by up to 90% compared to traditional air-based systems.
This directly influences the PUE calculation for green data centers, a key metric for reporting under energy management standards like ISO 50001.
A financial services firm operating a private high-performance computing cluster must carefully evaluate the ROI of renewable energy in data centers, weighing the high initial CapEx of on-site solar or wind against long-term energy cost savings and price stability.
The impact of EU Green Deal on data centers extends beyond European borders, setting global benchmarks for carbon reporting and influencing the design of next-generation facilities worldwide.
Consequently, optimizing HPC workloads for energy efficiency through software-based energy-aware scheduling and hardware co-design is no longer a niche practice but a critical component of maintaining a competitive and compliant operational posture in an energy-constrained digital economy.
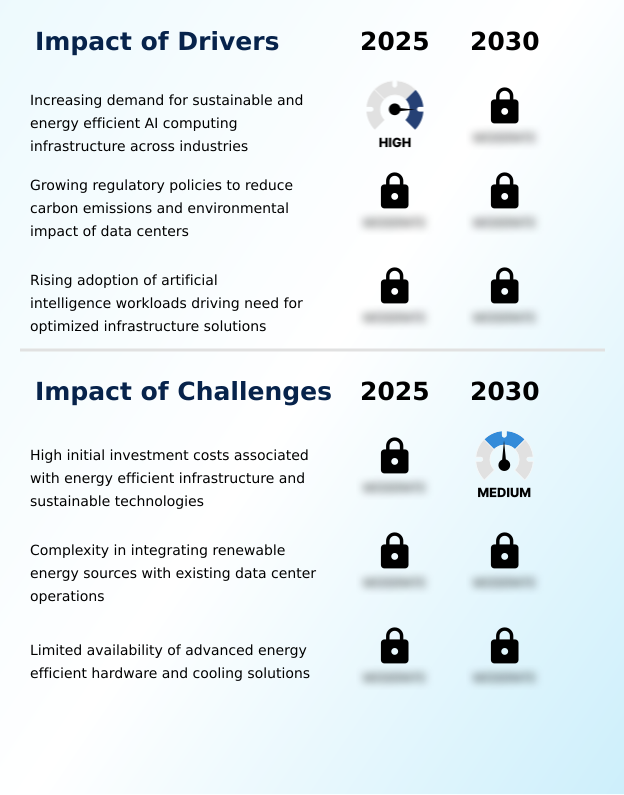
Primary Growth Driver: The increasing demand for sustainable and energy-efficient AI computing infrastructure across industries is a key driver for market growth.
Market expansion, underscored by a year-over-year growth of 28.9%, is primarily fueled by mounting regulatory pressure and corporate sustainability mandates.
Growing awareness of the environmental impact of AI and its associated AI hardware energy consumption has made IT carbon emissions reduction a C-suite priority.
This driver is reinforced by stringent regulatory policies, such as the EU's Corporate Sustainability Reporting Directive, which require transparent reporting on energy use and carbon footprint.
As a result, enterprises and cloud providers are compelled to invest in data center cooling innovations and energy-efficient hardware.
The sheer computational demand of modern AI models necessitates infrastructure that is not only powerful but also sustainable, creating a persistent demand cycle for green computing solutions.
Emerging Market Trend: The adoption of advanced cooling technologies, particularly liquid cooling, is a significant trend, driven by the need for improved energy efficiency in high-density computing environments.
Key trends are centered on mitigating the intensive energy profile of AI workloads. The adoption of liquid cooling technologies is paramount, as direct-to-chip and immersion systems can reduce cooling-related energy consumption by up to 90% compared to legacy air-based methods. This allows for higher rack densities and directly improves data center sustainability metrics.
Beyond cooling, there is a strong push toward waste heat recovery, where thermal output is repurposed for district heating, turning a liability into a community asset. On the silicon level, the development of energy-efficient processors and long-term research into neuromorphic computing aim to fundamentally lower the power required for computation.
These hardware innovations are complemented by software advancements that enable more efficient AI model training, collectively driving the industry toward more sustainable operations.
Key Industry Challenge: High initial investment costs for energy-efficient infrastructure and sustainable technologies represent a primary challenge affecting market growth.
Significant headwinds persist, primarily the high initial investment costs associated with deploying advanced green infrastructure. The capital outlay for specialized thermal management solutions, high performance storage and memory solutions, and systems for sustainable power management can be prohibitive for smaller enterprises.
This financial barrier is compounded by supply chain vulnerabilities for critical components like specialized processors and liquid cooling hardware, leading to long lead times and project delays. Furthermore, the complexity of integrating these new systems with legacy infrastructure and implementing sophisticated software for energy-aware scheduling requires a specialized skillset that is in short supply.
These challenges can slow the pace of adoption and create a tiered market where only the most well-capitalized organizations can fully realize the benefits of the latest green AI hardware.
Explore Full Market Dynamics Analysis Request Free Sample
Green Ai Infrastructure Market Segmentation
The green ai infrastructure industry research report provides comprehensive data including region-wise segment analysis, with forecasts and analysis for the period 2026-2030, as well as historical data from 2020-2024 for the following segments.
Product Segment Analysis
The ai optimized servers segment is estimated to witness significant growth during the forecast period.
The AI optimized servers segment constitutes the foundational hardware layer, engineered to deliver higher compute density with a significantly lower power profile.
These specialized units are shifting from general-purpose designs toward architectures utilizing dedicated tensor processing units (TPU) and application-specific integrated circuits (ASIC), which are engineered for the high parallel workloads of deep learning.
The primary goal is to maximize throughput-per-watt, ensuring that the massive energy requirements of training large language models do not create unsustainable operational costs.
This focus on AI workload optimization is critical as the segment represents the largest portion of the market, reflecting procurement decisions driven by total cost of ownership and the need for sustainable high-performance computing to align with corporate environmental goals.
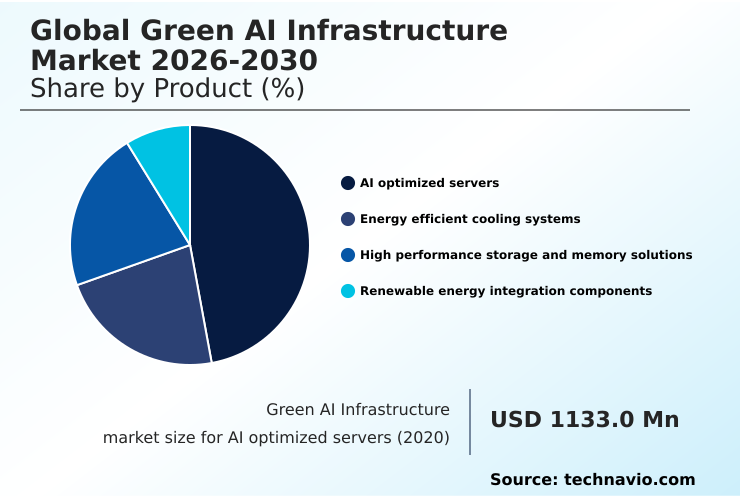
The AI optimized servers segment was valued at USD 2.72 billion in 2024 and showed a gradual increase during the forecast period.
Green Ai Infrastructure Market by Region: North America Leads with 41% Growth Share
North America is estimated to contribute 41% to the growth of the global market during the forecast period.
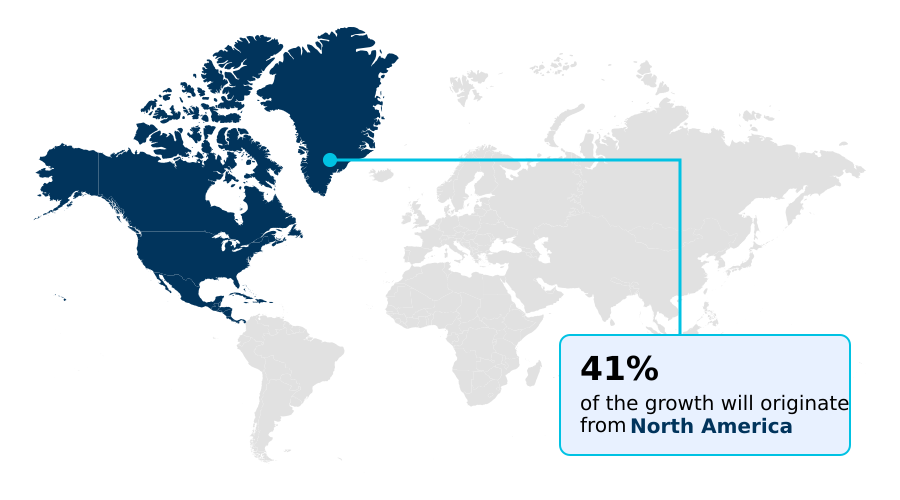
North America, contributing approximately 41% of the market's incremental growth, leads in the deployment of sustainable AI infrastructure, propelled by federal incentives like the Inflation Reduction Act and a high concentration of hyperscale data centers.
The region's focus on IT carbon emissions reduction drives innovation in increasing server rack density through advanced thermal management.
In contrast, APAC, which accounts for over 27% of growth, is rapidly expanding its capacity with a focus on localized edge computing hardware to serve its vast digital-native population.
Europe emphasizes regulatory compliance, pushing for green data center certification under frameworks like the EU's Corporate Sustainability Reporting Directive. Across all regions, sustainable computing research is pivotal for developing next-generation solutions that balance performance with environmental responsibility.
Customer Landscape Analysis for the Green Ai Infrastructure Market
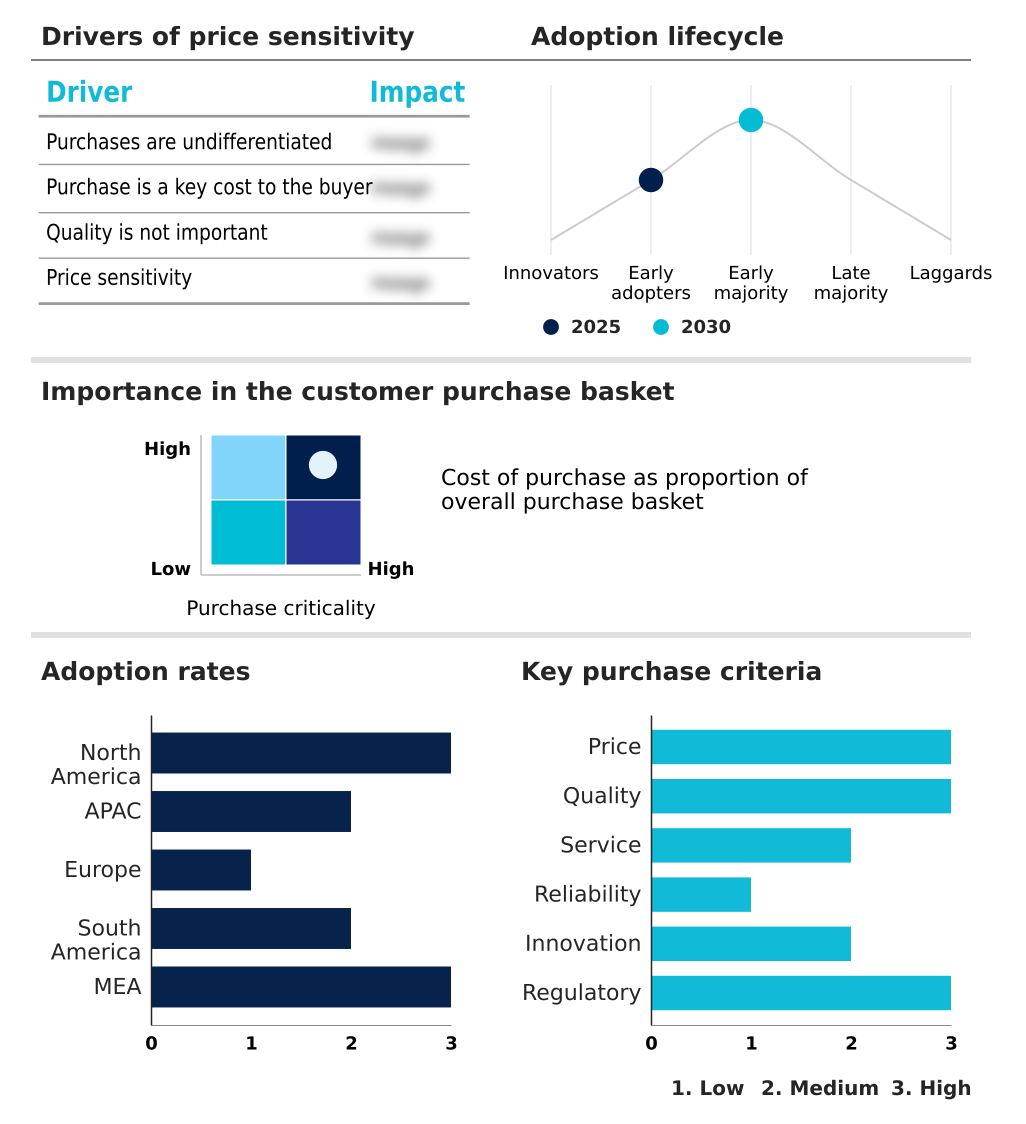
The green ai infrastructure market forecasting report includes the adoption lifecycle of the market, covering from the innovator’s stage to the laggard’s stage. It focuses on adoption rates in different regions based on penetration. Furthermore, the green ai infrastructure market report also includes key purchase criteria and drivers of price sensitivity to help companies evaluate and develop their market growth analysis strategies.
Competitive Landscape of the Green Ai Infrastructure Market
Companies are implementing various strategies, such as strategic alliances, partnerships, mergers and acquisitions, geographical expansion, and product/service launches, to enhance their presence in the green ai infrastructure market industry.
ABB Ltd. - Offerings include energy-efficient electrification, smart grid integration, and AI-enabled industrial automation designed to reduce power consumption and emissions across industrial and data center applications.
The industry research and growth report includes detailed analyses of the competitive landscape of the market and information about key companies, including:
- ABB Ltd.
- Advanced Micro Devices Inc.
- Alibaba Cloud
- Amazon Web Services Inc.
- Cisco Systems Inc.
- Dell Technologies Inc.
- Eaton Corp. Plc
- Equinix Inc.
- Google LLC
- Hewlett Packard Enterprise Co.
- Huawei Technologies Co. Ltd.
- IBM Corp.
- Intel Corp.
- Lenovo Group Ltd.
- Microsoft Corp.
- NVIDIA Corp.
- Oracle Corp.
- Schneider Electric SE
- Siemens AG
- Tencent Holdings Ltd.
- Vertiv Holdings Co.
Qualitative and quantitative analysis of companies has been conducted to help clients understand the wider business environment as well as the strengths and weaknesses of key industry players. Data is qualitatively analyzed to categorize companies as pure play, category-focused, industry-focused, and diversified; it is quantitatively analyzed to categorize companies as dominant, leading, strong, tentative, and weak.
Recent Developments in the Green Ai Infrastructure Market
- In March, 2025, Google LLC achieved 24/7 carbon-free energy operation in key European data center regions by integrating advanced geothermal and solar power sources to meet enterprise demand for sustainable computing.
- In April, 2025, Schneider Electric launched its new prefabricated liquid-cooled data center modules, which feature an integrated system to reuse waste heat for providing hot water to adjacent industrial facilities.
- In September, 2025, Meta Platforms Incorporated revealed a comprehensive redesign of its global data center architecture, specifically optimized for its Llama 4 model series, incorporating standard integrated solar power and proprietary liquid cooling blocks.
- In November, 2025, Intel Corporation unveiled its latest series of specialized processors, featuring a breakthrough backside power delivery architecture that reduces electrical resistance and improves energy efficiency by 20%.
Research Analyst Overview: Green Ai Infrastructure Market
The accelerating market momentum, with a CAGR of 34.8%, reflects a fundamental shift in capital expenditure priorities at the boardroom level. Decisions now pivot on the total cost of ownership of AI optimized servers and their supporting infrastructure, rather than just initial hardware cost. A key consideration is the transition to advanced thermal management solutions.
Adopting direct-to-chip cooling or full immersion cooling has profound implications for server rack density and facility design, directly impacting power usage effectiveness (PUE), a critical metric for green data center certification. This shift is driven by the intensive heat generated by high-performance computing (HPC) systems running on tensor processing units (TPU) and application-specific integrated circuits (ASIC).
To manage this, operators are deploying comprehensive data center infrastructure management (DCIM) platforms for carbon footprint tracking and sustainable power management. The infrastructure stack now incorporates everything from low-power processors and closed-loop cooling systems to smart grid controllers that enable grid-interactive data centers.
Furthermore, integrating renewable energy integration, leveraging waste heat recovery, and exploring futuristic technologies like neuromorphic computing are becoming standard practice for achieving true carbon-aware computing.
Dive into Technavio’s robust research methodology, blending expert interviews, extensive data synthesis, and validated models for unparalleled Green Ai Infrastructure Market insights. See full methodology.
| Market Scope | |
|---|---|
| Page number | 314 |
| Base year | 2025 |
| Historic period | 2020-2024 |
| Forecast period | 2026-2030 |
| Growth momentum & CAGR | Accelerate at a CAGR of 34.8% |
| Market growth 2026-2030 | USD 25820.7 million |
| Market structure | Fragmented |
| YoY growth 2025-2026(%) | 28.9% |
| Key countries | US, Canada, Mexico, China, Japan, India, South Korea, Australia, Indonesia, Germany, UK, France, Italy, Spain, The Netherlands, Brazil, Argentina, Chile, Saudi Arabia, UAE, South Africa, Israel and Turkey |
| Competitive landscape | Leading Companies, Market Positioning of Companies, Competitive Strategies, and Industry Risks |
Green Ai Infrastructure Market: Key Questions Answered in This Report
-
What is the expected growth of the Green Ai Infrastructure Market between 2026 and 2030?
-
The Green Ai Infrastructure Market is expected to grow by USD 25.82 billion during 2026-2030, registering a CAGR of 34.8%. Year-over-year growth in 2026 is estimated at 28.9%%. This acceleration is shaped by increasing demand for sustainable and energy efficient ai computing infrastructure across industries, which is intensifying demand across multiple end-use verticals covered in the report.
-
-
What segmentation does the market report cover?
-
The report is segmented by Product (AI optimized servers, Energy efficient cooling systems, High performance storage and memory solutions, and Renewable energy integration components), End-user (Cloud service providers, Enterprises, Government, and Research institutions and AI startups), Deployment (Cloud based, Hybrid and edge-computing environments, and On premises) and Geography (North America, APAC, Europe, South America, Middle East and Africa). Among these, the AI optimized servers segment is estimated to witness significant growth during the forecast period, driven by rising adoption across key application areas. Each segment includes detailed qualitative and quantitative analysis, along with historical data from 2020-2024 and forecasts through 2030 with year-over-year growth rates.
-
-
Which regions are analyzed in the report?
-
The report covers North America, APAC, Europe, South America and Middle East and Africa. North America is estimated to contribute 41% to market growth during the forecast period. Country-level analysis includes US, Canada, Mexico, China, Japan, India, South Korea, Australia, Indonesia, Germany, UK, France, Italy, Spain, The Netherlands, Brazil, Argentina, Chile, Saudi Arabia, UAE, South Africa, Israel and Turkey, with dedicated market size tables and year-over-year growth for each.
-
-
What are the key growth drivers and market challenges?
-
The primary driver is increasing demand for sustainable and energy efficient ai computing infrastructure across industries, which is accelerating investment and industry demand. The main challenge is high initial investment costs associated with energy efficient infrastructure and sustainable technologies, creating operational barriers for key market participants. The report quantifies the impact of each driver and challenge across 2026 and 2030 with comparative analysis.
-
-
Who are the major players in the Green Ai Infrastructure Market?
-
Key vendors include ABB Ltd., Advanced Micro Devices Inc., Alibaba Cloud, Amazon Web Services Inc., Cisco Systems Inc., Dell Technologies Inc., Eaton Corp. Plc, Equinix Inc., Google LLC, Hewlett Packard Enterprise Co., Huawei Technologies Co. Ltd., IBM Corp., Intel Corp., Lenovo Group Ltd., Microsoft Corp., NVIDIA Corp., Oracle Corp., Schneider Electric SE, Siemens AG, Tencent Holdings Ltd. and Vertiv Holdings Co.. The report provides qualitative and quantitative analysis categorizing companies as dominant, leading, strong, tentative, and weak based on their market positioning. Company profiles include business segment analysis, SWOT assessment, key offerings, and recent strategic developments.
-
Green Ai Infrastructure Market Research Insights
Market dynamics are increasingly dictated by the dual pressures of regulatory compliance and the immense energy demands of AI model training. The push for IT infrastructure sustainability, underscored by policies like the EU Green Deal, compels organizations to prioritize reducing their data center carbon footprint.
This is particularly evident among cloud service providers, whose market segment is more than double that of enterprises, reflecting their scale in deploying sustainable cloud computing solutions. These hyperscalers leverage AI for energy optimization and advanced data center power management to offer competitive services.
This creates a market where AI infrastructure for sustainability is not just a feature but a core competitive differentiator, forcing all players to re-evaluate their hardware and operational strategies to meet both performance and environmental targets.
We can help! Our analysts can customize this green ai infrastructure market research report to meet your requirements.
 RIA -
RIA - 
