Heat Interface Units Market Analysis, Size, and Forecast 2025-2029: Europe (Denmark, Germany, Poland, Russia, Sweden), APAC (China, India, Japan), North America (US and Canada), Middle East and Africa , and South America

Heat Interface Units Market Analysis, Size, and Forecast 2025-2029:
Europe (Denmark, Germany, Poland, Russia, Sweden), APAC (China, India, Japan), North America (US and Canada), Middle East and Africa , and South America

Published: Mar 2025 222 Pages SKU: IRTNTR74328

Market Overview at a Glance

$859.2 Mn
Market Opportunity
10.7%
CAGR
9.4
YoY growth 2024-2025(%)

Heat Interface Units Market Size 2025-2029

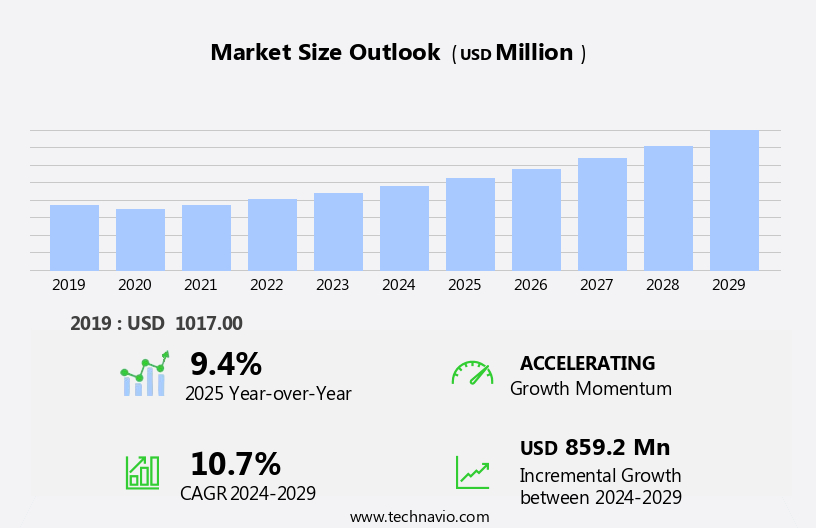
The heat interface units market size is forecast to increase by USD 859.2 million, at a CAGR of 10.7% between 2024 and 2029.

  • The Heat Interface Unit market is experiencing significant growth, driven by the increasing trend towards energy efficiency and cost savings. Reduced investment and maintenance costs associated with Heat Interface Units make them an attractive alternative to traditional heating systems. Furthermore, the growing demand for smart homes and the development of smart cities is boosting market expansion. However, high costs of wood pellets used in district heating systems pose a challenge for market growth. This trend is expected to continue as the focus on sustainable and cost-effective heating solutions gains momentum. Companies seeking to capitalize on market opportunities should consider investing in research and development to improve the efficiency and affordability of Heat Interface Units, while also addressing the challenge of high wood pellet costs.
  • Strategic partnerships and collaborations with pellet producers or alternative fuel suppliers could also provide a solution to mitigate this obstacle. Overall, the Heat Interface Unit market presents a promising landscape for companies looking to innovate and meet the growing demand for energy-efficient and cost-effective heating solutions.

What will be the Size of the Heat Interface Units Market during the forecast period?

Heat Interface Units Market Size

Explore in-depth regional segment analysis with market size data - historical 2019-2023 and forecasts 2025-2029 - in the full report.  
Request Free Sample

The heat interface unit market continues to evolve, driven by the growing demand for energy efficiency and carbon footprint reduction in various sectors. These units play a crucial role in heat distribution systems, enabling the optimization of energy consumption and minimizing heat loss. Integral components such as property management systems, housing associations, energy audits, and quality assurance ensure the efficient operation of these systems. Seamlessly integrated entities, including data logging, pipework insulation, API integrations, fault detection, customer engagement, pressure sensors, and water temperature control, enhance the performance of heat interface units. Heat pumps, pipework fittings, and new build construction are also integral to the market's ongoing development.

Commercial buildings and social housing are significant markets for heat interface units, with a focus on data security, regulatory compliance, reporting tools, remote monitoring, and maintenance contracts. Wireless communication, smart thermostats, software platforms, smart metering, insulation materials, temperature sensors, and remote diagnostics are essential elements that facilitate system integration and optimization. The market's dynamism extends to district heating, central heating systems, installation services, and renewable energy integration. Waste heat recovery, meter reading, boiler efficiency, billing systems, flow meters, remote access, and control systems are integral components that contribute to the market's continuous growth and evolution.

How is this Heat Interface Units Industry segmented?

The heat interface units industry research report provides comprehensive data (region-wise segment analysis), with forecasts and estimates in "USD million" for the period 2025-2029, as well as historical data from 2019-2023 for the following segments.

  • Product
    • Indirect HIU
    • Direct HIU
  • Application
    • Industrial
    • Commercial
    • Residential
  • Component
    • Heat exchangers
    • Controllers
    • Pumps
    • Sensors
    • Valves
  • Geography
    • North America
      • US
      • Canada
    • Europe
      • Denmark
      • Germany
      • Poland
      • Russia
      • Sweden
    • APAC
      • China
      • India
      • Japan
    • Rest of World (ROW)

    By Product Insights

    The indirect hiu segment is estimated to witness significant growth during the forecast period.

    Indirect heat interface units, which utilize a plate heat exchanger to transfer energy between primary and secondary circuits, have gained significant traction in the building sector. These units are particularly suitable for structures requiring a separation between the two circuits. In 2024, indirect heat interface units commanded the largest market share, driven by their advantages over direct units. The separation of primary and secondary circuits in indirect units ensures improved energy efficiency, heat loss reduction, and enhanced water temperature control. Additionally, indirect units offer compatibility with various heating systems, including heat pumps, district heating, and central heating systems.

    They also facilitate system integration with smart metering, remote monitoring, and data logging. In commercial buildings, housing associations, and social housing, indirect heat interface units are increasingly being adopted for new construction and retrofit projects. The integration of API integrations, pressure sensors, temperature sensors, and fault detection systems further enhances their performance and efficiency. Compliance with building codes and regulatory requirements is ensured through the use of quality assurance processes and data analytics. Furthermore, indirect units can be integrated with renewable energy sources and boiler efficiency systems to reduce carbon footprint and optimize energy consumption. The market for heat interface units continues to evolve, with a focus on customer engagement, data security, and wireless communication.

    Maintenance contracts and remote diagnostics enable proactive maintenance and reduce downtime. Smart thermostats and smart meters offer enhanced control and data visualization, while insulation materials and pipework fittings ensure optimal system performance. The integration of valves and actuators, control systems, and billing systems further streamlines operations and enhances user experience.

    Heat Interface Units Market Size

    Request Free Sample

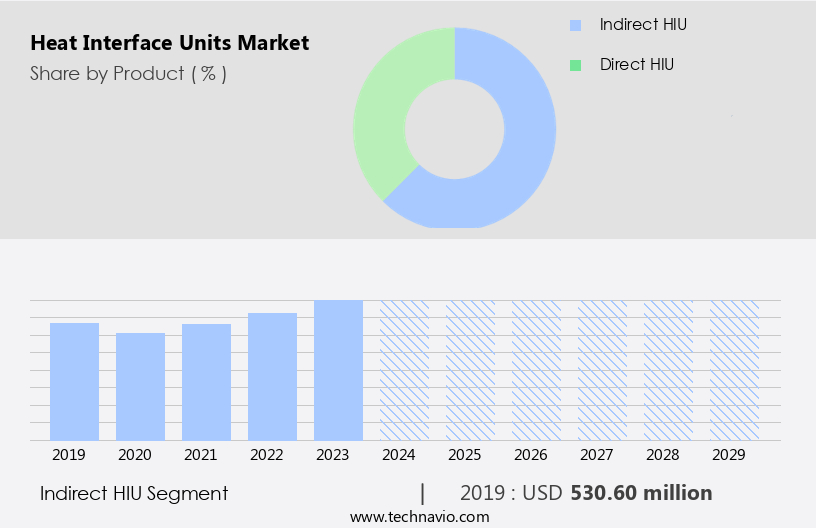
    The Indirect HIU segment was valued at USD 530.60 million in 2019 and showed a gradual increase during the forecast period.

    Regional Analysis

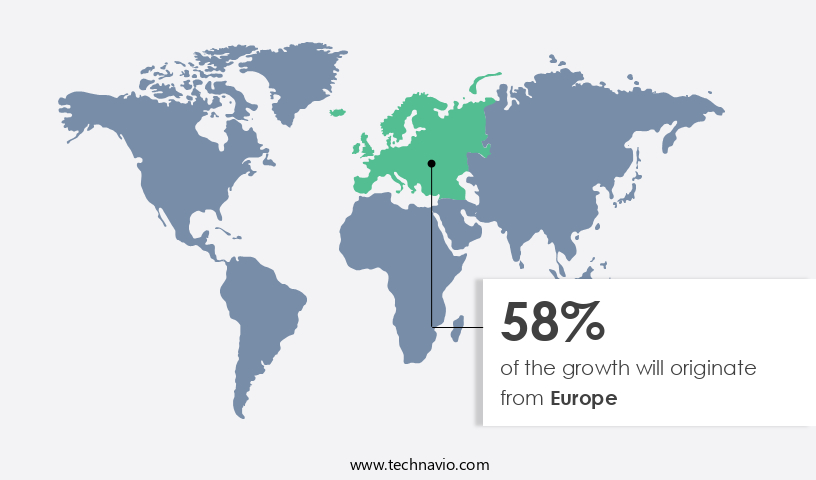
    Europe is estimated to contribute 58% to the growth of the global market during the forecast period.Technavio’s analysts have elaborately explained the regional trends and drivers that shape the market during the forecast period.

    Heat Interface Units Market Share by Geography

     Request Free Sample

    In Europe's cold climate, heating systems and boilers hold significant importance. Centralized heating systems, including heat interface units, are favored over individual boilers in countries like Germany. The construction sector's positive outlook, particularly in the UK, fuels the demand for heat interface units. The UK's housing shortage in the Southeast and population growth drive residential construction, leading to increased adoption of these units. Property management and housing associations prioritize energy efficiency and cost savings, making heat interface units an attractive option. Energy audits and quality assurance ensure the units meet efficiency standards and function optimally. Pipework insulation, pressure sensors, and temperature control systems enhance heat distribution and reduce heat loss.

    Heat pumps, smart thermostats, and renewable energy integration contribute to energy efficiency and carbon footprint reduction. Commercial buildings also adopt heat interface units for energy savings and regulatory compliance. Data security, reporting tools, and remote monitoring enable effective maintenance contracts and customer engagement. Installation services and system integration ensure seamless integration with existing infrastructure. Wireless communication, remote diagnostics, and data logging facilitate efficient maintenance and repair. Valves and actuators, insulation materials, and temperature sensors optimize performance and longevity. District heating and heat metering systems provide cost savings and improved energy management. New build construction and retrofit projects present opportunities for growth.

    Building codes and regulatory compliance ensure safety and sustainability. Software platforms, smart metering, and data analytics enable efficient energy management and billing systems. Remote access, control systems, and flow meters facilitate real-time monitoring and optimization. Waste heat recovery and meter reading contribute to overall energy efficiency. In conclusion, the European heating market is dynamic and evolving, with various entities driving growth and innovation in heat interface units. From construction to energy efficiency, these units play a crucial role in addressing the region's heating needs while promoting sustainability and cost savings.

    Market Dynamics

    Our researchers analyzed the data with 2024 as the base year, along with the key drivers, trends, and challenges. A holistic analysis of drivers will help companies refine their marketing strategies to gain a competitive advantage.

    The heat interface unit market encompasses innovative solutions designed to transfer thermal energy from a central heating source to individual buildings or spaces, enhancing energy efficiency and reducing carbon emissions. These units, including heat exchangers and buffer tanks, facilitate the integration of renewable heating systems and district heating networks. They ensure optimal temperature control through advanced technologies like thermal energy storage and intelligent control systems. Heat interface units enable the transition towards low-carbon heating solutions, contributing significantly to the decarbonization of the built environment. Their compact design and ease of installation make them an attractive choice for both new and retrofit projects. Moreover, they promote energy savings and improve overall system performance, making them a valuable investment for property developers, building owners, and utility companies.

    What are the key market drivers leading to the rise in the adoption of Heat Interface Units Industry?

    • The significant reduction in investment and maintenance costs serves as the primary market driver. 

    • Heat Interface Units (HIUs) have gained popularity in both new build construction and commercial buildings due to their water temperature control capabilities and energy efficiency. HIUs integrate heat pumps and heat exchangers to provide heating and hot water, reducing the need for separate systems. In the construction process, pipework fittings are essential for ensuring proper water flow and pressure. Smart thermostats offer advanced temperature control and remote monitoring capabilities, enhancing comfort and energy savings. Commercial buildings particularly benefit from these features, as they can be managed centrally and offer data security through reporting tools and maintenance contracts.
    • The integration of wireless communication technology enables remote monitoring and maintenance, further reducing costs and downtime. Building codes require strict adherence to safety regulations, ensuring that all components, including pipework fittings and heat exchangers, meet the necessary standards. HIUs provide a harmonious and immersive solution for heating and hot water, emphasizing energy efficiency and cost savings. With the increasing focus on sustainability and data-driven management, HIUs are poised to become a preferred choice for businesses and developers.

    What are the market trends shaping the Heat Interface Units Industry?

    • The rising demand for smart homes and the development of smart cities represent a significant market trend in the modern world. These advancements reflect a growing preference for technology-driven living and urban planning.

    • The Heat Interface Unit (HIU) market is experiencing significant growth due to the increasing adoption of smart home technologies. HIUs, which include radiator valves, temperature sensors, and insulation materials, are integral components of heat metering systems and district heating networks. These systems offer improved energy efficiency and cost savings for both residential and commercial applications. Software platforms and smart metering enable remote diagnostics and system integration, enhancing the functionality and convenience of HIUs. The integration of renewable energy sources, such as solar and wind, is also driving market growth. Smart HIUs are increasingly being used in social housing projects to improve energy efficiency and reduce energy poverty.
    • The use of HIUs in central heating systems is also on the rise, with installation services becoming more accessible and affordable. The development of advanced HIUs with features like remote diagnostics, temperature control, and energy optimization is further boosting market growth. The integration of HIUs with other smart home appliances, such as lighting and entertainment systems, is also creating new opportunities for market expansion. In conclusion, the Heat Interface Unit market is witnessing robust growth due to the increasing adoption of smart home technologies, the integration of renewable energy sources, and the growing demand for energy efficiency and cost savings.
    • The market is expected to continue its growth trajectory in the coming years, offering significant opportunities for stakeholders.

    What challenges does the Heat Interface Units Industry face during its growth?

    • The escalating costs of wood pellets represent a significant challenge to the expansion and growth of the district heating industry. 

    • Heat interface units are essential components in buildings connected to district heating networks. By eliminating the need for individual boilers and heating systems, district heating reduces costs and minimizes the need for additional pipework for gas supply. However, the trend of using pellet boilers in district heating systems, contributing significantly to the total heat supplied, has resulted in increased prices due to rising pellet fuel costs. This price hike has led some users to disconnect from district heating systems. To mitigate these challenges, advanced technologies such as data logging, carbon footprint reduction, and waste heat recovery are being integrated into heat interface units.
    • Data analytics and data visualization tools enable users to monitor energy consumption, optimize system performance, and ensure regulatory compliance. Valves and actuators, along with control systems, offer remote access and automated control, enhancing efficiency and reducing energy waste. Meter reading systems and billing systems ensure accurate and transparent billing, while boiler efficiency improvements and flow meters provide real-time data for better energy management. These advancements contribute to a more sustainable and cost-effective heating solution, making district heating an attractive option for businesses and residential properties.

    Exclusive Customer Landscape

    The heat interface units market forecasting report includes the adoption lifecycle of the market, covering from the innovator’s stage to the laggard’s stage. It focuses on adoption rates in different regions based on penetration. Furthermore, the heat interface units market report also includes key purchase criteria and drivers of price sensitivity to help companies evaluate and develop their market growth analysis strategies.

    Heat Interface Units Market Share by Geography

     Customer Landscape

    Key Companies & Market Insights

    Companies are implementing various strategies, such as strategic alliances, heat interface units market forecast, partnerships, mergers and acquisitions, geographical expansion, and product/service launches, to enhance their presence in the industry.

    Alfa Laval AB - The company specializes in providing heat interface units, including AXPM, AXP, CB, and AC models. These advanced systems optimize energy efficiency and temperature control in residential and commercial applications. The AXPM and AXP models feature pumped hot water systems, while the CB and AC units offer direct heating and cooling solutions. By integrating these innovative heat interface units, the company aims to enhance overall building performance and reduce energy consumption.

    The industry research and growth report includes detailed analyses of the competitive landscape of the market and information about key companies, including:

    • Alfa Laval AB
    • Caleffi SpA
    • Cetetherm
    • Danfoss AS
    • Dutypoint Ltd.
    • ELCO GmbH
    • Fortes Energy Systems
    • GIACOMINI Spa
    • Heatweb Solutions ltd.
    • Honeywell International Inc.
    • Ideal Heating Ltd.
    • Intatec Ltd.
    • Johnson and Starley Ltd.
    • Kingspan Group Plc
    • KOZANLAR Heating Technologies and Solutions Inc. Org.
    • Rhico District Heating Products Ltd.
    • Robert Bosch GmbH
    • S.A. Armstrong Ltd.
    • SAV Systems UK Ltd.
    • Vital Energi Ltd.

    Qualitative and quantitative analysis of companies has been conducted to help clients understand the wider business environment as well as the strengths and weaknesses of key industry players. Data is qualitatively analyzed to categorize companies as pure play, category-focused, industry-focused, and diversified; it is quantitatively analyzed to categorize companies as dominant, leading, strong, tentative, and weak.

    Recent Development and News in Heat Interface Units Market

    • In January 2024, Danfoss, a leading manufacturer of heating solutions, announced the launch of their new line of AquaPLex Heat Interface Units (HIUs), integrating advanced energy efficiency technologies and AI capabilities (Danfoss Press Release, 2024). In March 2024, Veolia, a global water, waste, and energy management company, entered into a strategic partnership with Siemens Energy to jointly develop and offer integrated heating solutions, including HIUs, to their combined customer base (Veolia Press Release, 2024).
    • In April 2025, NIBE, a leading European heating technology company, acquired the UK-based HIU manufacturer, Stelrad Radiators, to expand its product portfolio and strengthen its presence in the UK market (NIBE Press Release, 2025). In May 2025, the European Commission approved the Horizon 2020 project "Smart Heating and Cooling," which aims to accelerate the market deployment of HIUs and other smart heating and cooling solutions through research, innovation, and education initiatives (European Commission Press Release, 2025). These developments underscore the growing importance and investment in Heat Interface Units, driven by technological advancements, strategic partnerships, and regulatory support.

    Research Analyst Overview

    • The heat interface unit market is experiencing significant activity and trends, driven by various factors. Life cycle assessment and environmental impact are increasingly important considerations, as building owners and operators seek to minimize their carbon footprint and comply with green building standards. Security protocols are also a priority, as energy storage and data analytics techniques are integrated into building performance systems. Wireless networks, machine learning, and AI algorithms are transforming the industry, enabling predictive modeling and real-time energy management strategies. Policy and regulations, such as renewable heat incentives and sustainability initiatives, are shaping the market landscape.
    • Supply chain management, calibration methods, and installation techniques are critical to ensuring the efficiency and effectiveness of heat interface units. Smart grids, IoT devices, and energy modeling analytics platforms are revolutionizing building automation and indoor air quality. Training and education, customer support, and maintenance procedures are essential components of the market, ensuring that professionals are equipped with the knowledge and skills to design, install, and maintain these complex systems. Energy management strategies, communication protocols, and meter accuracy are also key areas of focus, as building owners and operators seek to optimize their energy usage and reduce costs.

    Dive into Technavio’s robust research methodology, blending expert interviews, extensive data synthesis, and validated models for unparalleled Heat Interface Units Market insights. See full methodology.

    Market Scope

    Report Coverage

    Details

    Page number

    222

    Base year

    2024

    Historic period

    2019-2023

    Forecast period

    2025-2029

    Growth momentum & CAGR

    Accelerate at a CAGR of 10.7%

    Market growth 2025-2029

    USD 859.2 million

    Market structure

    Fragmented

    YoY growth 2024-2025(%)

    9.4

    Key countries

    Russia, China, Poland, US, Sweden, India, Denmark, Germany, Japan, and Canada

    Competitive landscape

    Leading Companies, Market Positioning of Companies, Competitive Strategies, and Industry Risks

    Request Free Sample

    What are the Key Data Covered in this Heat Interface Units Market Research and Growth Report?

    • CAGR of the Heat Interface Units industry during the forecast period
    • Detailed information on factors that will drive the growth and forecasting between 2025 and 2029
    • Precise estimation of the size of the market and its contribution of the industry in focus to the parent market
    • Accurate predictions about upcoming growth and trends and changes in consumer behaviour
    • Growth of the market across Europe, APAC, North America, Middle East and Africa, and South America
    • Thorough analysis of the market’s competitive landscape and detailed information about companies
    • Comprehensive analysis of factors that will challenge the heat interface units market growth of industry companies

    We can help! Our analysts can customize this heat interface units market research report to meet your requirements.

    Get in touch


    1 Executive Summary

    • 1.1 Market overview
      • Executive Summary - Chart on Market Overview
      • Executive Summary - Data Table on Market Overview
      • Executive Summary - Chart on Global Market Characteristics
      • Executive Summary - Chart on Market by Geography
      • Executive Summary - Chart on Market Segmentation by Product
      • Executive Summary - Chart on Market Segmentation by Application
      • Executive Summary - Chart on Market Segmentation by Component
      • Executive Summary - Chart on Incremental Growth
      • Executive Summary - Data Table on Incremental Growth
      • Executive Summary - Chart on Company Market Positioning

    2 Technavio Analysis

    • 2.1 Analysis of price sensitivity, lifecycle, customer purchase basket, adoption rates, and purchase criteria
      • Analysis of price sensitivity, lifecycle, customer purchase basket, adoption rates, and purchase criteria
    • 2.2 Criticality of inputs and Factors of differentiation
      • Overview on criticality of inputs and factors of differentiation
    • 2.3 Factors of disruption
      • Overview on factors of disruption
    • 2.4 Impact of drivers and challenges
      • Impact of drivers and challenges in 2024 and 2029

    3 Market Landscape

    • 3.1 Market ecosystem
      • Parent Market
      • Data Table on - Parent Market
    • 3.2 Market characteristics
      • Market characteristics analysis
    • 3.3 Value chain analysis
      • Value chain analysis

    4 Market Sizing

    • 4.1 Market definition
      • Offerings of companies included in the market definition
    • 4.2 Market segment analysis
      • Market segments
    • 4.3 Market size 2024
      • 4.4 Market outlook: Forecast for 2024-2029
        • Chart on Global - Market size and forecast 2024-2029 ($ million)
        • Data Table on Global - Market size and forecast 2024-2029 ($ million)
        • Chart on Global Market: Year-over-year growth 2024-2029 (%)
        • Data Table on Global Market: Year-over-year growth 2024-2029 (%)

      5 Historic Market Size

      • 5.1 Global Heat Interface Units Market 2019 - 2023
        • Historic Market Size - Data Table on Global Heat Interface Units Market 2019 - 2023 ($ million)
      • 5.2 Product segment analysis 2019 - 2023
        • Historic Market Size - Product Segment 2019 - 2023 ($ million)
      • 5.3 Application segment analysis 2019 - 2023
        • Historic Market Size - Application Segment 2019 - 2023 ($ million)
      • 5.4 Component segment analysis 2019 - 2023
        • Historic Market Size - Component Segment 2019 - 2023 ($ million)
      • 5.5 Geography segment analysis 2019 - 2023
        • Historic Market Size - Geography Segment 2019 - 2023 ($ million)
      • 5.6 Country segment analysis 2019 - 2023
        • Historic Market Size - Country Segment 2019 - 2023 ($ million)

      6 Qualitative Analysis

      • 6.1 Impact of AI on Global Heat Interface Units Market

        7 Five Forces Analysis

        • 7.1 Five forces summary
          • Five forces analysis - Comparison between 2024 and 2029
        • 7.2 Bargaining power of buyers
          • Bargaining power of buyers - Impact of key factors 2024 and 2029
        • 7.3 Bargaining power of suppliers
          • Bargaining power of suppliers - Impact of key factors in 2024 and 2029
        • 7.4 Threat of new entrants
          • Threat of new entrants - Impact of key factors in 2024 and 2029
        • 7.5 Threat of substitutes
          • Threat of substitutes - Impact of key factors in 2024 and 2029
        • 7.6 Threat of rivalry
          • Threat of rivalry - Impact of key factors in 2024 and 2029
        • 7.7 Market condition
          • Chart on Market condition - Five forces 2024 and 2029

        8 Market Segmentation by Product

        • 8.1 Market segments
          • Chart on Product - Market share 2024-2029 (%)
          • Data Table on Product - Market share 2024-2029 (%)
        • 8.2 Comparison by Product
          • Chart on Comparison by Product
          • Data Table on Comparison by Product
        • 8.3 Indirect HIU - Market size and forecast 2024-2029
          • Chart on Indirect HIU - Market size and forecast 2024-2029 ($ million)
          • Data Table on Indirect HIU - Market size and forecast 2024-2029 ($ million)
          • Chart on Indirect HIU - Year-over-year growth 2024-2029 (%)
          • Data Table on Indirect HIU - Year-over-year growth 2024-2029 (%)
        • 8.4 Direct HIU - Market size and forecast 2024-2029
          • Chart on Direct HIU - Market size and forecast 2024-2029 ($ million)
          • Data Table on Direct HIU - Market size and forecast 2024-2029 ($ million)
          • Chart on Direct HIU - Year-over-year growth 2024-2029 (%)
          • Data Table on Direct HIU - Year-over-year growth 2024-2029 (%)
        • 8.5 Market opportunity by Product
          • Market opportunity by Product ($ million)
          • Data Table on Market opportunity by Product ($ million)

        9 Market Segmentation by Application

        • 9.1 Market segments
          • Chart on Application - Market share 2024-2029 (%)
          • Data Table on Application - Market share 2024-2029 (%)
        • 9.2 Comparison by Application
          • Chart on Comparison by Application
          • Data Table on Comparison by Application
        • 9.3 Industrial - Market size and forecast 2024-2029
          • Chart on Industrial - Market size and forecast 2024-2029 ($ million)
          • Data Table on Industrial - Market size and forecast 2024-2029 ($ million)
          • Chart on Industrial - Year-over-year growth 2024-2029 (%)
          • Data Table on Industrial - Year-over-year growth 2024-2029 (%)
        • 9.4 Commercial - Market size and forecast 2024-2029
          • Chart on Commercial - Market size and forecast 2024-2029 ($ million)
          • Data Table on Commercial - Market size and forecast 2024-2029 ($ million)
          • Chart on Commercial - Year-over-year growth 2024-2029 (%)
          • Data Table on Commercial - Year-over-year growth 2024-2029 (%)
        • 9.5 Residential - Market size and forecast 2024-2029
          • Chart on Residential - Market size and forecast 2024-2029 ($ million)
          • Data Table on Residential - Market size and forecast 2024-2029 ($ million)
          • Chart on Residential - Year-over-year growth 2024-2029 (%)
          • Data Table on Residential - Year-over-year growth 2024-2029 (%)
        • 9.6 Market opportunity by Application
          • Market opportunity by Application ($ million)
          • Data Table on Market opportunity by Application ($ million)

        10 Market Segmentation by Component

        • 10.1 Market segments
          • Chart on Component - Market share 2024-2029 (%)
          • Data Table on Component - Market share 2024-2029 (%)
        • 10.2 Comparison by Component
          • Chart on Comparison by Component
          • Data Table on Comparison by Component
        • 10.3 Heat exchangers - Market size and forecast 2024-2029
          • Chart on Heat exchangers - Market size and forecast 2024-2029 ($ million)
          • Data Table on Heat exchangers - Market size and forecast 2024-2029 ($ million)
          • Chart on Heat exchangers - Year-over-year growth 2024-2029 (%)
          • Data Table on Heat exchangers - Year-over-year growth 2024-2029 (%)
        • 10.4 Controllers - Market size and forecast 2024-2029
          • Chart on Controllers - Market size and forecast 2024-2029 ($ million)
          • Data Table on Controllers - Market size and forecast 2024-2029 ($ million)
          • Chart on Controllers - Year-over-year growth 2024-2029 (%)
          • Data Table on Controllers - Year-over-year growth 2024-2029 (%)
        • 10.5 Pumps - Market size and forecast 2024-2029
          • Chart on Pumps - Market size and forecast 2024-2029 ($ million)
          • Data Table on Pumps - Market size and forecast 2024-2029 ($ million)
          • Chart on Pumps - Year-over-year growth 2024-2029 (%)
          • Data Table on Pumps - Year-over-year growth 2024-2029 (%)
        • 10.6 Sensors - Market size and forecast 2024-2029
          • Chart on Sensors - Market size and forecast 2024-2029 ($ million)
          • Data Table on Sensors - Market size and forecast 2024-2029 ($ million)
          • Chart on Sensors - Year-over-year growth 2024-2029 (%)
          • Data Table on Sensors - Year-over-year growth 2024-2029 (%)
        • 10.7 Valves - Market size and forecast 2024-2029
          • Chart on Valves - Market size and forecast 2024-2029 ($ million)
          • Data Table on Valves - Market size and forecast 2024-2029 ($ million)
          • Chart on Valves - Year-over-year growth 2024-2029 (%)
          • Data Table on Valves - Year-over-year growth 2024-2029 (%)
        • 10.8 Market opportunity by Component
          • Market opportunity by Component ($ million)
          • Data Table on Market opportunity by Component ($ million)

        11 Customer Landscape

        • 11.1 Customer landscape overview
          • Analysis of price sensitivity, lifecycle, customer purchase basket, adoption rates, and purchase criteria

        12 Geographic Landscape

        • 12.1 Geographic segmentation
          • Chart on Market share by geography 2024-2029 (%)
          • Data Table on Market share by geography 2024-2029 (%)
        • 12.2 Geographic comparison
          • Chart on Geographic comparison
          • Data Table on Geographic comparison
        • 12.3 Europe - Market size and forecast 2024-2029
          • Chart on Europe - Market size and forecast 2024-2029 ($ million)
          • Data Table on Europe - Market size and forecast 2024-2029 ($ million)
          • Chart on Europe - Year-over-year growth 2024-2029 (%)
          • Data Table on Europe - Year-over-year growth 2024-2029 (%)
        • 12.4 APAC - Market size and forecast 2024-2029
          • Chart on APAC - Market size and forecast 2024-2029 ($ million)
          • Data Table on APAC - Market size and forecast 2024-2029 ($ million)
          • Chart on APAC - Year-over-year growth 2024-2029 (%)
          • Data Table on APAC - Year-over-year growth 2024-2029 (%)
        • 12.5 North America - Market size and forecast 2024-2029
          • Chart on North America - Market size and forecast 2024-2029 ($ million)
          • Data Table on North America - Market size and forecast 2024-2029 ($ million)
          • Chart on North America - Year-over-year growth 2024-2029 (%)
          • Data Table on North America - Year-over-year growth 2024-2029 (%)
        • 12.6 Middle East and Africa - Market size and forecast 2024-2029
          • Chart on Middle East and Africa - Market size and forecast 2024-2029 ($ million)
          • Data Table on Middle East and Africa - Market size and forecast 2024-2029 ($ million)
          • Chart on Middle East and Africa - Year-over-year growth 2024-2029 (%)
          • Data Table on Middle East and Africa - Year-over-year growth 2024-2029 (%)
        • 12.7 South America - Market size and forecast 2024-2029
          • Chart on South America - Market size and forecast 2024-2029 ($ million)
          • Data Table on South America - Market size and forecast 2024-2029 ($ million)
          • Chart on South America - Year-over-year growth 2024-2029 (%)
          • Data Table on South America - Year-over-year growth 2024-2029 (%)
        • 12.8 Russia - Market size and forecast 2024-2029
          • Chart on Russia - Market size and forecast 2024-2029 ($ million)
          • Data Table on Russia - Market size and forecast 2024-2029 ($ million)
          • Chart on Russia - Year-over-year growth 2024-2029 (%)
          • Data Table on Russia - Year-over-year growth 2024-2029 (%)
        • 12.9 China - Market size and forecast 2024-2029
          • Chart on China - Market size and forecast 2024-2029 ($ million)
          • Data Table on China - Market size and forecast 2024-2029 ($ million)
          • Chart on China - Year-over-year growth 2024-2029 (%)
          • Data Table on China - Year-over-year growth 2024-2029 (%)
        • 12.10 Poland - Market size and forecast 2024-2029
          • Chart on Poland - Market size and forecast 2024-2029 ($ million)
          • Data Table on Poland - Market size and forecast 2024-2029 ($ million)
          • Chart on Poland - Year-over-year growth 2024-2029 (%)
          • Data Table on Poland - Year-over-year growth 2024-2029 (%)
        • 12.11 Sweden - Market size and forecast 2024-2029
          • Chart on Sweden - Market size and forecast 2024-2029 ($ million)
          • Data Table on Sweden - Market size and forecast 2024-2029 ($ million)
          • Chart on Sweden - Year-over-year growth 2024-2029 (%)
          • Data Table on Sweden - Year-over-year growth 2024-2029 (%)
        • 12.12 US - Market size and forecast 2024-2029
          • Chart on US - Market size and forecast 2024-2029 ($ million)
          • Data Table on US - Market size and forecast 2024-2029 ($ million)
          • Chart on US - Year-over-year growth 2024-2029 (%)
          • Data Table on US - Year-over-year growth 2024-2029 (%)
        • 12.13 Denmark - Market size and forecast 2024-2029
          • Chart on Denmark - Market size and forecast 2024-2029 ($ million)
          • Data Table on Denmark - Market size and forecast 2024-2029 ($ million)
          • Chart on Denmark - Year-over-year growth 2024-2029 (%)
          • Data Table on Denmark - Year-over-year growth 2024-2029 (%)
        • 12.14 India - Market size and forecast 2024-2029
          • Chart on India - Market size and forecast 2024-2029 ($ million)
          • Data Table on India - Market size and forecast 2024-2029 ($ million)
          • Chart on India - Year-over-year growth 2024-2029 (%)
          • Data Table on India - Year-over-year growth 2024-2029 (%)
        • 12.15 Germany - Market size and forecast 2024-2029
          • Chart on Germany - Market size and forecast 2024-2029 ($ million)
          • Data Table on Germany - Market size and forecast 2024-2029 ($ million)
          • Chart on Germany - Year-over-year growth 2024-2029 (%)
          • Data Table on Germany - Year-over-year growth 2024-2029 (%)
        • 12.16 Japan - Market size and forecast 2024-2029
          • Chart on Japan - Market size and forecast 2024-2029 ($ million)
          • Data Table on Japan - Market size and forecast 2024-2029 ($ million)
          • Chart on Japan - Year-over-year growth 2024-2029 (%)
          • Data Table on Japan - Year-over-year growth 2024-2029 (%)
        • 12.17 Canada - Market size and forecast 2024-2029
          • Chart on Canada - Market size and forecast 2024-2029 ($ million)
          • Data Table on Canada - Market size and forecast 2024-2029 ($ million)
          • Chart on Canada - Year-over-year growth 2024-2029 (%)
          • Data Table on Canada - Year-over-year growth 2024-2029 (%)
        • 12.18 Market opportunity by geography
          • Market opportunity by geography ($ million)
          • Data Tables on Market opportunity by geography ($ million)

        13 Drivers, Challenges, and Opportunity/Restraints

        • 13.1 Market drivers
          • 13.2 Market challenges
            • 13.3 Impact of drivers and challenges
              • Impact of drivers and challenges in 2024 and 2029
            • 13.4 Market opportunities/restraints

              14 Competitive Landscape

              • 14.1 Overview
                • 14.2 Competitive Landscape
                  • Overview on criticality of inputs and factors of differentiation
                • 14.3 Landscape disruption
                  • Overview on factors of disruption
                • 14.4 Industry risks
                  • Impact of key risks on business

                15 Competitive Analysis

                • 15.1 Companies profiled
                  • Companies covered
                • 15.2 Company ranking index
                  • Company ranking index
                • 15.3 Market positioning of companies
                  • Matrix on companies position and classification
                • 15.4 Alfa Laval AB
                  • Alfa Laval AB - Overview
                  • Alfa Laval AB - Business segments
                  • Alfa Laval AB - Key news
                  • Alfa Laval AB - Key offerings
                  • Alfa Laval AB - Segment focus
                  • SWOT
                • 15.5 Caleffi SpA
                  • Caleffi SpA - Overview
                  • Caleffi SpA - Product / Service
                  • Caleffi SpA - Key offerings
                  • SWOT
                • 15.6 Cetetherm
                  • Cetetherm - Overview
                  • Cetetherm - Product / Service
                  • Cetetherm - Key offerings
                  • SWOT
                • 15.7 Danfoss AS
                  • Danfoss AS - Overview
                  • Danfoss AS - Product / Service
                  • Danfoss AS - Key offerings
                  • SWOT
                • 15.8 Dutypoint Ltd.
                  • Dutypoint Ltd. - Overview
                  • Dutypoint Ltd. - Product / Service
                  • Dutypoint Ltd. - Key offerings
                  • SWOT
                • 15.9 Fortes Energy Systems
                  • Fortes Energy Systems - Overview
                  • Fortes Energy Systems - Product / Service
                  • Fortes Energy Systems - Key offerings
                  • SWOT
                • 15.10 GIACOMINI Spa
                  • GIACOMINI Spa - Overview
                  • GIACOMINI Spa - Product / Service
                  • GIACOMINI Spa - Key offerings
                  • SWOT
                • 15.11 Heatweb Solutions ltd.
                  • Heatweb Solutions ltd. - Overview
                  • Heatweb Solutions ltd. - Product / Service
                  • Heatweb Solutions ltd. - Key offerings
                  • SWOT
                • 15.12 Honeywell International Inc.
                  • Honeywell International Inc. - Overview
                  • Honeywell International Inc. - Business segments
                  • Honeywell International Inc. - Key news
                  • Honeywell International Inc. - Key offerings
                  • Honeywell International Inc. - Segment focus
                  • SWOT
                • 15.13 Ideal Heating Ltd.
                  • Ideal Heating Ltd. - Overview
                  • Ideal Heating Ltd. - Product / Service
                  • Ideal Heating Ltd. - Key offerings
                  • SWOT
                • 15.14 Intatec Ltd.
                  • Intatec Ltd. - Overview
                  • Intatec Ltd. - Product / Service
                  • Intatec Ltd. - Key offerings
                  • SWOT
                • 15.15 Kingspan Group Plc
                  • Kingspan Group Plc - Overview
                  • Kingspan Group Plc - Business segments
                  • Kingspan Group Plc - Key offerings
                  • Kingspan Group Plc - Segment focus
                  • SWOT
                • 15.16 Rhico District Heating Products Ltd.
                  • Rhico District Heating Products Ltd. - Overview
                  • Rhico District Heating Products Ltd. - Product / Service
                  • Rhico District Heating Products Ltd. - Key offerings
                  • SWOT
                • 15.17 Robert Bosch GmbH
                  • Robert Bosch GmbH - Overview
                  • Robert Bosch GmbH - Product / Service
                  • Robert Bosch GmbH - Key news
                  • Robert Bosch GmbH - Key offerings
                  • SWOT
                • 15.18 S.A. Armstrong Ltd.
                  • S.A. Armstrong Ltd. - Overview
                  • S.A. Armstrong Ltd. - Product / Service
                  • S.A. Armstrong Ltd. - Key offerings
                  • SWOT

                16 Appendix

                • 16.1 Scope of the report
                  • 16.2 Inclusions and exclusions checklist
                    • Inclusions checklist
                    • Exclusions checklist
                  • 16.3 Currency conversion rates for US$
                    • Currency conversion rates for US$
                  • 16.4 Research methodology
                    • Research methodology
                  • 16.5 Data procurement
                    • Information sources
                  • 16.6 Data validation
                    • Data validation
                  • 16.7 Validation techniques employed for market sizing
                    • Validation techniques employed for market sizing
                  • 16.8 Data synthesis
                    • Data synthesis
                  • 16.9 360 degree market analysis
                    • 360 degree market analysis
                  • 16.10 List of abbreviations
                    • List of abbreviations

                  Research Methodology

                  Technavio presents a detailed picture of the market by way of study, synthesis, and summation of data from multiple sources. The analysts have presented the various facets of the market with a particular focus on identifying the key industry influencers. The data thus presented is comprehensive, reliable, and the result of extensive research, both primary and secondary.

                  INFORMATION SOURCES

                  Primary sources

                  • Manufacturers and suppliers
                  • Channel partners
                  • Industry experts
                  • Strategic decision makers

                  Secondary sources

                  • Industry journals and periodicals
                  • Government data
                  • Financial reports of key industry players
                  • Historical data
                  • Press releases

                  DATA ANALYSIS

                  Data Synthesis

                  • Collation of data
                  • Estimation of key figures
                  • Analysis of derived insights

                  Data Validation

                  • Triangulation with data models
                  • Reference against proprietary databases
                  • Corroboration with industry experts

                  REPORT WRITING

                  Qualitative

                  • Market drivers
                  • Market challenges
                  • Market trends
                  • Five forces analysis

                  Quantitative

                  • Market size and forecast
                  • Market segmentation
                  • Geographical insights
                  • Competitive landscape

                  Interested in this report?

                  Get your sample now to see our research methodology and insights!

                  Download Now

                  Frequently Asked Questions

                  Heat Interface Units market growth will increase by $ 859.2 mn during 2025-2029 .

                  The Heat Interface Units market is expected to grow at a CAGR of 10.7% during 2025-2029 .

                  Heat Interface Units market is segmented by Product( Indirect HIU, Direct HIU) Application( Industrial, Commercial, Residential, Middle East and Africa, South America) Component( Heat exchangers, Controllers, Pumps, Sensors, Valves)

                  Alfa Laval AB, Caleffi SpA, Cetetherm, Danfoss AS, Dutypoint Ltd., ELCO GmbH, Fortes Energy Systems, GIACOMINI Spa, Heatweb Solutions ltd., Honeywell International Inc., Ideal Heating Ltd., Intatec Ltd., Johnson and Starley Ltd., Kingspan Group Plc, KOZANLAR Heating Technologies and Solutions Inc. Org., Rhico District Heating Products Ltd., Robert Bosch GmbH, S.A. Armstrong Ltd., SAV Systems UK Ltd., Vital Energi Ltd. are a few of the key vendors in the Heat Interface Units market.

                  Europe will register the highest growth rate of 58% among the other regions. Therefore, the Heat Interface Units market in Europe is expected to garner significant business opportunities for the vendors during the forecast period.

                  Russia, China, Poland, US, Sweden, India, Denmark, Germany, Japan, Canada

                  • Reduced investment and maintenance costsInstalling gas boilers in individual dwellings in a multi-dwelling apartment complex includes various costs. Out of all the tasks associated with installing boilers is the driving factor this market.
                  • installation and repairing gas pipelines are the most labor- and skill-intensive and contribute significantly to the overall costs. As the repair and installation of pipelines deal with potentially hazardous and flammable gases is the driving factor this market.
                  • they require appropriate materials and procedures. In order to prevent any compromise with the integrity of the pipe and the possibility of explosions is the driving factor this market.
                  • it is important to ensure that all the procedures are carried out properly is the driving factor this market.
                  • which requires trained professionals that add to the costs.Installing a central boiler plant eliminates the need for connecting individual dwellings to gas lines is the driving factor this market.
                  • resulting in significant cost savings. Heat interface units only require a centralized boiler and hot water risers. Therefore is the driving factor this market.
                  • there is no need for a piping network running through the buildings; this results in reduced costs and brings down future costs for repair and maintenance. Moreover is the driving factor this market.
                  • the installation of heat interface units is relatively easier than individual boilers and gas pipelines. Thus is the driving factor this market.
                  • it does not require trained and qualified installers and further saves costs. In addition is the driving factor this market.
                  • the absence of flue pipes also eliminates the need for ventilation routes. Therefore is the driving factor this market.
                  • the significant reduction in various costs associated with using heat interface units will drive the growth of the global heat interface units market during the forecast period. is the driving factor this market.

                  The Heat Interface Units market vendors should focus on grabbing business opportunities from the Indirect HIU segment as it accounted for the largest market share in the base year.