Hot Sauce Market Size 2025-2029
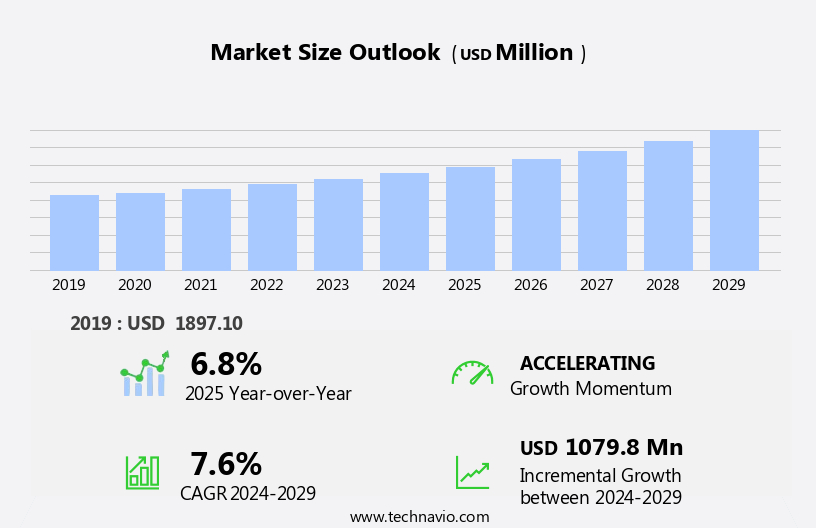
The hot sauce market size is forecast to increase by USD 1.08 billion at a CAGR of 7.6% between 2024 and 2029.
- The market is experiencing significant growth, driven by the increasing trend of consumers preparing restaurant-quality dishes at home. This shift in consumer behavior is fueled by the availability of diverse and authentic hot sauce options, which cater to various cultural and culinary preferences. Another key factor propelling market expansion is the rising global vegan population. As more individuals adopt plant-based diets, the demand for vegan-friendly hot sauces and dressing is surging. However, the market is not without challenges. The food and beverage industry faces stringent regulations, which require manufacturers to adhere to stringent safety and quality standards. Compliance with these regulations can add to production costs, potentially impacting profitability.
- To capitalize on market opportunities and navigate challenges effectively, companies must focus on innovation, sustainability, and regulatory compliance. Developing unique and authentic hot sauce flavors, while adhering to consumer preferences and dietary trends, can help companies differentiate themselves in a competitive landscape. Additionally, implementing sustainable production practices and investing in research and development to stay abreast of evolving regulations can help mitigate risks and ensure long-term success.
What will be the Size of the Hot Sauce Market during the forecast period?
- The market experiences vibrant growth, driven by a diverse range of factors. Consumers' increasing preference for ethnic and spicy food trends fuels market expansion. Food technology advancements enable the production of innovative hot sauces, catering to various dietary requirements such as vegan, keto, and plant-based. Food delivery services and entrepreneurship facilitate easy access to restaurant-quality dishes, further boosting demand. Food history and food fusion continue to inspire new product development. Regulatory compliance with food labeling and obesity control initiatives shapes the market landscape.
- Home cooking and food blogging fuel consumer interest, while food waste reduction and sustainability concerns influence production practices. Exports of hot sauces and food innovation in the food service industry further propel market growth. Food advertising, food influencers, and calorie reduction trends also contribute to the dynamic market environment.
How is this Hot Sauce Industry segmented?
The hot sauce industry research report provides comprehensive data (region-wise segment analysis), with forecasts and estimates in "USD million" for the period 2025-2029, as well as historical data from 2019-2023 for the following segments.
- Distribution Channel
- Offline
- Online
- End-user
- Household
- Commercial
- Geography
- North America
- US
- Canada
- Mexico
- APAC
- China
- India
- South Korea
- Thailand
- Europe
- France
- UK
- South America
- Brazil
- Middle East and Africa
- North America
By Distribution Channel Insights
The offline segment is estimated to witness significant growth during the forecast period.
The market encompasses both online and offline sales channels. Offline sales, which include supermarkets, hypermarkets, convenience stores, and others, remain significant due to consumers' preference for conventional shopping experiences. In these retail outlets, customers can physically inspect products and compare brands, ranging from mass-market to specialty and foreign options. Hot sauces with varying flavor profiles, such as garlic, sweet and spicy, habanero pepper sauce, sriracha, and chili pepper paste, are readily available. Convenience is a key factor, as hot sauces are often used as condiments for various cuisine dishes, including Mexican, Indian, and Asian, as well as for quick-serve foods like sandwiches, burgers, and rolls.
With the rise of dietary trends like keto, vegan, and flexitarian, product availability caters to diverse consumer needs, including keto-friendly, vegan, and vegetarian options. Weather conditions and product shelf lives are crucial considerations for hot sauce suppliers and raw material suppliers. Distribution channels include mass merchandisers, digital media platforms, and hospitality industries, among others. The market is dynamic, with new product launches, flavor varieties, and condiment combinations continually emerging.

Get a glance at the market report of share of various segments Request Free Sample
The Offline segment was valued at USD 1.68 billion in 2019 and showed a gradual increase during the forecast period.
Regional Analysis
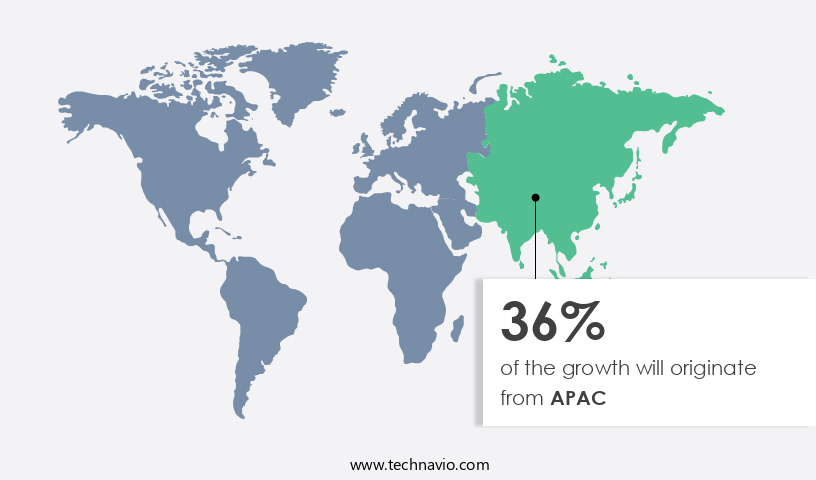
APAC is estimated to contribute 36% to the growth of the global market during the forecast period.Technavio's analysts have elaborately explained the regional trends and drivers that shape the market during the forecast period.
For more insights on the market size of various regions, Request Free Sample
The market in North America experienced significant growth in 2024, driven by consumers with high disposable incomes and a growing appreciation for diverse food flavors. Hot sauces, such as chili sauce and sriracha hot sauce, have gained popularity in countries like the US and Canada, leading to an increase in their trade. The region's multicultural population has fueled the acceptance of various global cuisines, many of which incorporate spicy flavors and hot sauces. This exposure to new tastes has broadened consumers' culinary horizons, leading to increased demand for hot sauces in meal kits, specialist retailers, and quick-serve foods. Weather conditions and flavor varieties also influence consumer preferences, with sweet and spicy, habanero pepper sauce, and jalapeño sauce being popular choices.
The market caters to various dietary needs, including vegan, keto, and flexitarian, with product lines ranging from raw material suppliers to sauce distribution and e-commerce platforms. The availability of hot sauces in convenience stores, supermarkets, and food festivals further enhances accessibility. However, production shortages and raw material shortages may impact product shelf lives and distribution channels. Despite these challenges, the market continues to grow, offering a wide range of condiments, from garlic-infused to vinegar-based, to enhance the taste profile of various food dishes, including sandwiches, burgers, rolls, and dressings.
Market Dynamics
Our researchers analyzed the data with 2024 as the base year, along with the key drivers, trends, and challenges. A holistic analysis of drivers will help companies refine their marketing strategies to gain a competitive advantage.
What are the key market drivers leading to the rise in the adoption of Hot Sauce Industry?
- Growing preference for cooking restaurant-quality dishes at home is the key driver of the market.
- The market is experiencing significant growth due to the increasing preference for preparing restaurant-quality meals at home. This trend is driven by various factors, including shifting consumer preferences, easier access to culinary resources, and the proliferation of digital media. By cooking at home, individuals can customize meals to suit their taste preferences, dietary needs, and nutritional requirements. Additionally, the growing concern for health and wellness has led many people to seek transparency in their food sources and ingredients.
- As a result, the market is poised for continued expansion, providing companies with ample opportunities for growth. Home cooks value the control they have over the ingredients, flavors, and portion sizes, making the market a dynamic and evolving space.
What are the market trends shaping the Hot Sauce Industry?
- Rising global vegan population is the upcoming market trend.
- The market is experiencing significant growth due to the increasing vegan population and their preference for plant-based diets. Veganism, a practice of abstaining from animal products, has seen a notable in recent years, with an approximate 300% increase in the number of individuals adhering to this lifestyle over the last decade. This trend is driving the demand for vegan-friendly food options, including hot sauces, in both retail and foodservice sectors. Foodservice outlets are responding to this consumer preference by expanding their menus to include vegan offerings such as veggie cheese, vegetarian burgers, and vegetarian beverages.
- The health benefits associated with a vegan diet are also contributing to its popularity, making it a favorable choice for health-conscious consumers. The market is poised to capitalize on this trend and continue its growth trajectory during the forecast period.
What challenges does the Hot Sauce Industry face during its growth?
- Stringent regulations in food and beverage industry is a key challenge affecting the industry growth.
- The market faces regulatory challenges due to stringent rules and policies issued by various government bodies. These regulations cover marketing, sales, and labeling aspects, including permits, entry of new players, product expiry, and management issues. The increasing awareness against excessive use of hot sauces has led to these regulations, which may restrict certain ingredients in hot sauce formulations, potentially affecting traditional recipes or unique flavor profiles.
- Adhering to these regulations adds to the operational costs for market companies, which could negatively impact market growth.
Exclusive Customer Landscape
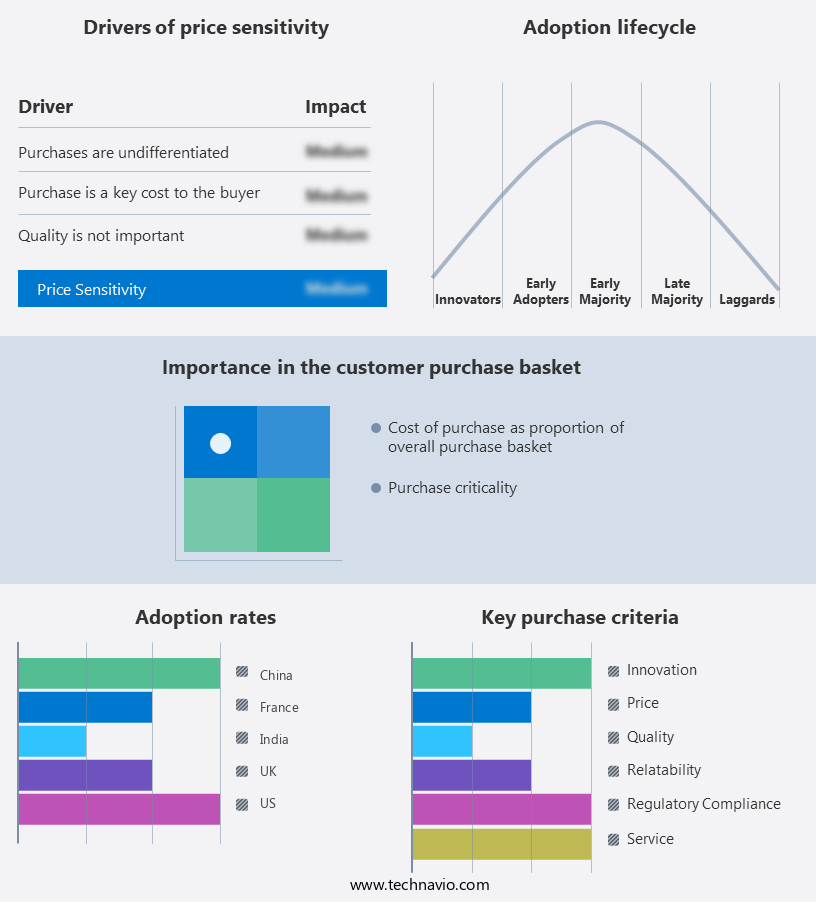
The hot sauce market forecasting report includes the adoption lifecycle of the market, covering from the innovator's stage to the laggard's stage. It focuses on adoption rates in different regions based on penetration. Furthermore, the hot sauce market report also includes key purchase criteria and drivers of price sensitivity to help companies evaluate and develop their market growth analysis strategies.
Customer Landscape
Key Companies & Market Insights
Companies are implementing various strategies, such as strategic alliances, hot sauce market forecast, partnerships, mergers and acquisitions, geographical expansion, and product/service launches, to enhance their presence in the industry.
AAK AB - The company specializes in producing a diverse range of hot sauces, including Lion Buffalo Sauce and a BBQ Sauce with an authentic SouthWestern Hickory flavor, as well as a fiery chili sauce. Each product offers unique, bold flavors, enhancing culinary creations for discerning consumers. With a commitment to quality and authenticity, the company's offerings elevate meals and add excitement to the table.
The industry research and growth report includes detailed analyses of the competitive landscape of the market and information about key companies, including:
- AAK AB
- Angry Goat Pepper Co.
- B and G Foods Inc.
- Baumer Foods Inc.
- Daves Gourmet
- DNV Food Pvt. Ltd.
- GraceKennedy Ltd.
- Haco NV
- Hot-Headz
- Huy Fong Foods Inc.
- Marie Sharp USA
- McCormick and Co. Inc.
- PepsiCo Inc.
- Tabasco
- Tapatio Hot Sauce
- The Kraft Heinz Co.
- Unilever PLC
- Veeba Food Services Pvt. Ltd.
- Walkerswood
- Windmill Organics Ltd.
Qualitative and quantitative analysis of companies has been conducted to help clients understand the wider business environment as well as the strengths and weaknesses of key industry players. Data is qualitatively analyzed to categorize companies as pure play, category-focused, industry-focused, and diversified; it is quantitatively analyzed to categorize companies as dominant, leading, strong, tentative, and weak.
Research Analyst Overview
The market is experiencing significant growth due to the increasing preference for spicy and flavorful condiments among consumers. This trend is driven by various factors, including the growing popularity of specialist retailers and the availability of a wide range of flavor varieties. One notable trend in the market is the demand for garlic and sweet and spicy hot sauces. Weather conditions also play a role in the production and consumption of hot sauces, with some regions experiencing higher demand during certain seasons. Manufacturers are expanding their product lines to cater to diverse consumer preferences, including those following specific diets such as keto, vegan, and flexitarian.
Frozen foods and pre-packaged supplies have gained popularity among home cooks, particularly those with hectic work schedules, leading to an increase in demand for convenient hot sauce options. Hot sauces are used in various cuisines, from Mexican to Asian, and are often used as seasonings for a wide range of dishes, from elaborate dinners to quick-serve foods. Digital media and e-commerce platforms have made it easier for consumers to access and purchase hot sauces from anywhere in the world, expanding the supplier base and increasing exports. The market for hot sauces is not limited to traditional condiments but also includes chili pepper pastes, salsas, and dressings.
The nutritional profiles of these products are also gaining attention, with consumers seeking low-sodium, keto-friendly, and vegan options. The taste profile of hot sauces varies widely, from mild and sweet to extremely spicy and savory. Some popular flavors include jalapeño, habanero, and sriracha. Raw material suppliers are under pressure to ensure a steady supply of high-quality chili peppers and other ingredients to meet the growing demand. The market for hot sauces is not without its challenges, however. Production shortages and raw material shortages can impact supply chains, leading to price fluctuations and product availability issues.
Distribution channels, including mass merchandisers and convenience stores, are also important considerations for manufacturers looking to reach a wider audience. Despite these challenges, the future looks bright for the market. Consumers continue to seek out new and exciting flavor combinations, and the versatility of hot sauces as a condiment, seasoning, and ingredient makes them a staple in many kitchens around the world. Whether used to add heat to buffalo wings or umami properties to vegetarian burgers, hot sauces are here to stay.
|
Market Scope |
|
|
Report Coverage |
Details |
|
Page number |
188 |
|
Base year |
2024 |
|
Historic period |
2019-2023 |
|
Forecast period |
2025-2029 |
|
Growth momentum & CAGR |
Accelerate at a CAGR of 7.6% |
|
Market growth 2025-2029 |
USD 1079.8 million |
|
Market structure |
Fragmented |
|
YoY growth 2024-2025(%) |
6.8 |
|
Key countries |
US, UK, China, India, France, Mexico, Thailand, Canada, South Korea, and Brazil |
|
Competitive landscape |
Leading Companies, Market Positioning of Companies, Competitive Strategies, and Industry Risks |
What are the Key Data Covered in this Hot Sauce Market Research and Growth Report?
- CAGR of the Hot Sauce industry during the forecast period
- Detailed information on factors that will drive the growth and forecasting between 2025 and 2029
- Precise estimation of the size of the market and its contribution of the industry in focus to the parent market
- Accurate predictions about upcoming growth and trends and changes in consumer behaviour
- Growth of the market across North America, APAC, Europe, South America, and Middle East and Africa
- Thorough analysis of the market's competitive landscape and detailed information about companies
- Comprehensive analysis of factors that will challenge the hot sauce market growth of industry companies
We can help! Our analysts can customize this hot sauce market research report to meet your requirements.
 RIA -
RIA - 
