Hydrolyzed Vegetable Protein Market Size 2025-2029
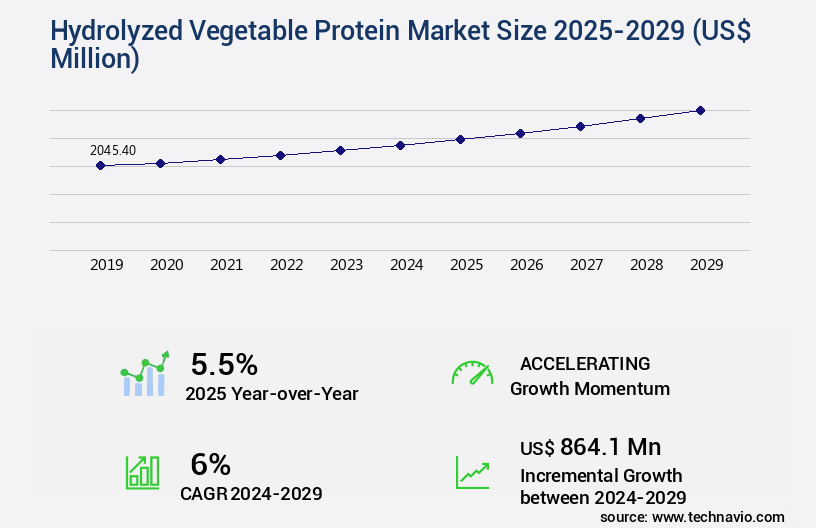
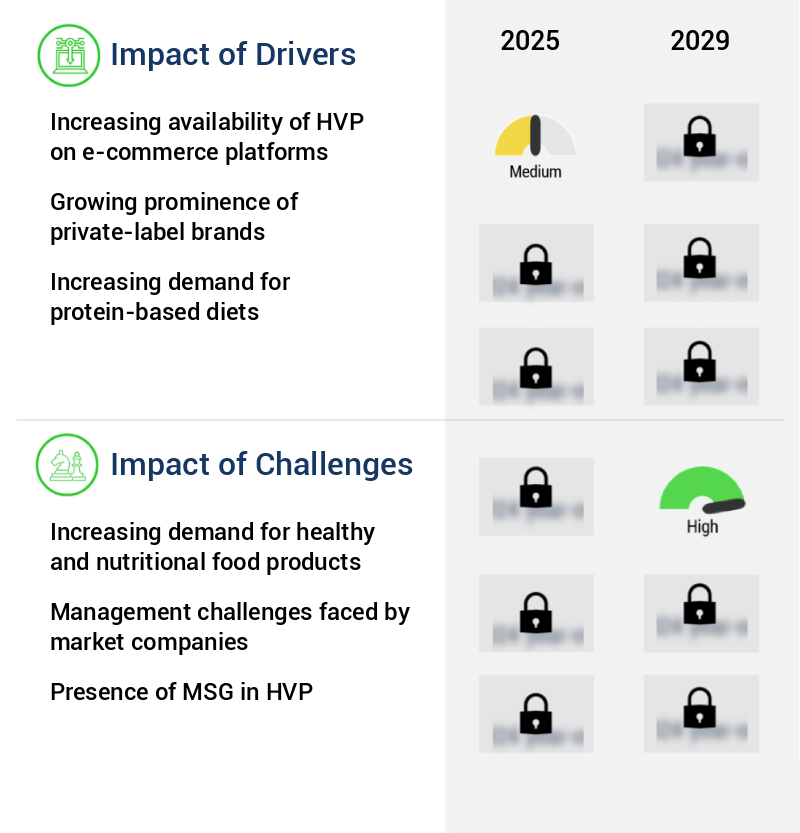
The hydrolyzed vegetable protein market size is valued to increase USD 864.1 million, at a CAGR of 6% from 2024 to 2029. Increasing availability of HVP on e-commerce platforms will drive the hydrolyzed vegetable protein market.
Major Market Trends & Insights
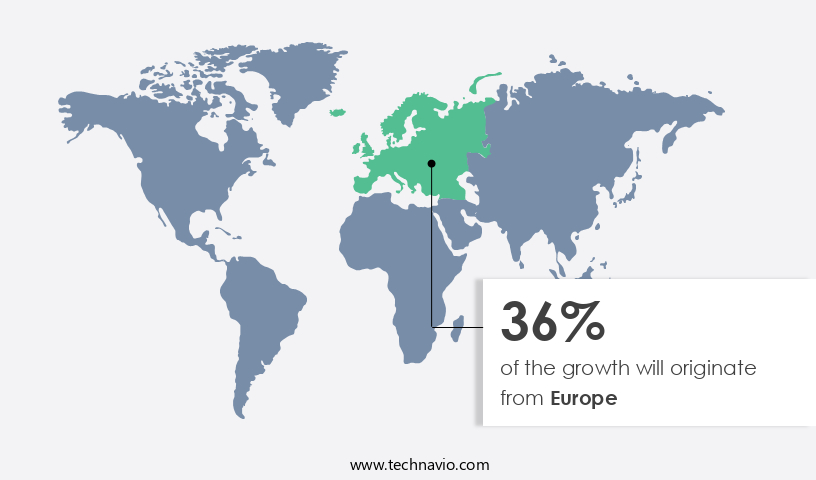
- Europe dominated the market and accounted for a 36% growth during the forecast period.
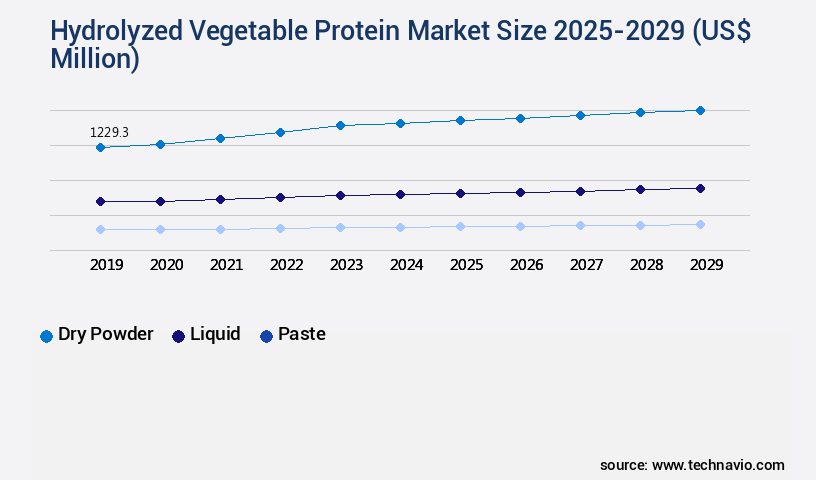
- By Type - Dry powder segment was valued at USD 1229.30 million in 2023
- By Distribution Channel - Direct segment accounted for the largest market revenue share in 2023
Market Size & Forecast
- Market Opportunities: USD 66.30 million
- Market Future Opportunities: USD 864.10 million
- CAGR : 6%
- Europe: Largest market in 2023
Market Summary
- The Hydrolyzed Vegetable Protein (HVP) Market represents a significant and continually evolving sector within the global food industry. This market is characterized by the production and utilization of hydrolyzed plant-based proteins, primarily derived from sources such as soy, corn, and wheat. The core technologies and applications of HVP span various industries, including food and beverage manufacturing, pharmaceuticals, and cosmetics. The market's growth is fueled by several factors, including the increasing availability of HVP on e-commerce platforms, the rising adoption of organic and natural ingredients, and the growing demand for healthy and nutritional food products.
- According to recent market research, the global HVP market is projected to account for over 30% of the total vegetable protein market share by 2026. Despite these opportunities, challenges such as regulatory compliance and price volatility persist. Nonetheless, the potential for innovation and expansion in emerging markets presents significant growth prospects for market participants.
What will be the Size of the Hydrolyzed Vegetable Protein Market during the forecast period?
Get Key Insights on Market Forecast (PDF) Request Free Sample
How is the Hydrolyzed Vegetable Protein Market Segmented and what are the key trends of market segmentation?
The hydrolyzed vegetable protein industry research report provides comprehensive data (region-wise segment analysis), with forecasts and estimates in "USD million" for the period 2025-2029, as well as historical data from 2019-2023 for the following segments.
- Type
- Dry powder
- Liquid
- Paste
- Distribution Channel
- Direct
- Indirect
- Source
- Soy protein
- Wheat protein
- Pea protein
- Rice protein
- Geography
- North America
- US
- Canada
- Europe
- France
- Germany
- Italy
- UK
- APAC
- China
- India
- Japan
- South America
- Brazil
- Rest of World (ROW)
- North America
By Type Insights
The dry powder segment is estimated to witness significant growth during the forecast period.
Hydrolyzed Vegetable Protein (HVP) market trends showcase the continuous evolution of this industry, with significant growth in various applications across the food processing sector. In 2024, the dry powder segment held a substantial market share, accounting for approximately 60% of the global market. This dominance can be attributed to the increasing use of HVP powder in enhancing the flavor of processed foods by breaking down vegetable proteins into their fundamental amino acids, contributing to around 20% of the glutamate content. Manufacturing HVP powder involves careful consideration of factors such as the natural nutrient content in vegetables, their shelf life, accurate composition, and precise pH value.
Texture modification, microbial contamination control, and process optimization strategies are crucial elements in HVP production. Foaming properties and rheological characteristics are essential considerations in food processing applications, ensuring emulsion stability and solubility characteristics. Quality control measures, including sensory evaluation methods, flavor enhancement, functional properties evaluation, and allergen reduction methods, are essential for maintaining the highest standards in HVP production. Peptide chain length and degree of hydrolysis are critical factors in determining the nutritional value improvement and digestibility assessment of HVP. Plant-based protein sources, such as soy, corn, and pea, are increasingly popular in HVP production due to their sustainability and cost-effective production.
Enzymatic hydrolysis processes are commonly used to achieve the desired degree of hydrolysis and nitrogen content determination. Protein denaturation and protein isolate purification are essential steps in the hydrolysis degree measurement process. Future industry growth expectations indicate a potential 15% increase in demand for HVP in the meat analog formulation sector due to its bitterness control and nutritional value improvement properties. Packaging optimization and flavor masking techniques are also gaining importance to extend shelf life and enhance consumer appeal. Overall, the HVP market continues to unfold with ongoing innovation and evolving patterns, offering significant opportunities for businesses in the food processing industry.
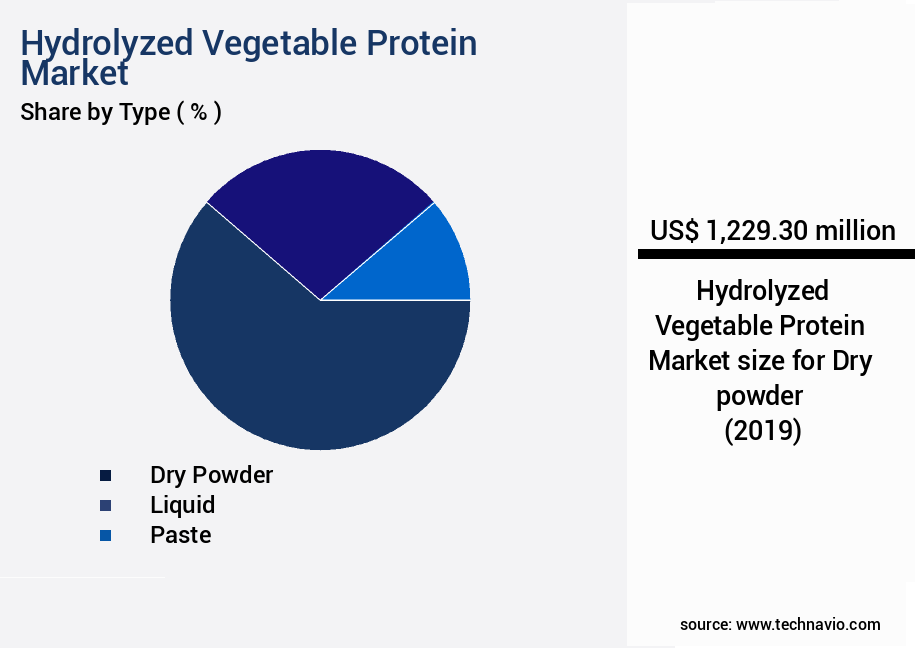
The Dry powder segment was valued at USD 1229.30 million in 2019 and showed a gradual increase during the forecast period.
Regional Analysis
Europe is estimated to contribute 36% to the growth of the global market during the forecast period.Technavio’s analysts have elaborately explained the regional trends and drivers that shape the market during the forecast period.
See How Hydrolyzed Vegetable Protein Market Demand is Rising in Europe Request Free Sample
The market in Europe is primarily driven by key countries such as the UK, France, Italy, and Germany. These nations account for significant revenue contributions due to their robust food processing industries. However, the European economic crisis has imposed taxes and escalated manufacturing costs, moderating the market's expansion. Despite these challenges, the market in Europe continues to witness growth in various sectors, including fat replacers, artificial sweeteners, and hydrocolloids.
Notable companies like Givaudan SA and Kerry Group Plc dominate the market, offering hydrolyzed vegetable protein solutions. However, the competitive landscape remains intense due to the presence of numerous local and international players, potentially hindering market penetration for new entrants.
Market Dynamics
Our researchers analyzed the data with 2024 as the base year, along with the key drivers, trends, and challenges. A holistic analysis of drivers will help companies refine their marketing strategies to gain a competitive advantage.
The market is witnessing significant growth due to the increasing demand for plant-based alternatives in various industries, particularly in meat substitutes and baked goods. Hydrolyzed vegetable proteins (HVP) offer functional benefits, including improved texture, flavor, and nutritional value, making them an attractive alternative to animal-derived proteins. The vegetable protein extraction methods comparison plays a crucial role in optimizing the amino acid composition for specific functionalities. Enzymatic hydrolysis is a popular method for producing HVP, as it enhances the desired properties, such as solubility and emulsifying capacity. However, the degree of hydrolysis significantly impacts protein digestibility and sensory attributes.
Processing parameters, including temperature and time, influence protein stability during hydrolysis. Methods for reducing bitterness in HVP, a common challenge, are under continuous research. Quality control parameters, such as protein content, color, and taste, are essential for ensuring consistent product quality. Regulatory guidelines for hydrolyzed vegetable protein labeling vary by region, necessitating a focus on sustainable sourcing and transparent supply chains. Cost analysis of different vegetable protein hydrolysis methods is a critical consideration for market players, with optimization for enhanced nutritional value and sensory attributes being key priorities. Comparatively, the protein hydrolysate application in dairy products is growing, accounting for a substantial share of the market.
The optimization of hydrolysis for improved nutritional value and the evaluation of sensory attributes in protein hydrolysates are essential for market success. In the competitive landscape, a minority of players dominate the high-end instrument market for hydrolysis techniques, offering advanced solutions for various vegetable sources. Determining the optimal hydrolysis time and temperature is a critical factor in minimizing protein allergenicity and maximizing yield. The development of novel applications for hydrolyzed vegetable protein, such as in cosmetics and pharmaceuticals, presents new opportunities for market expansion. Analyzing peptide profiles in vegetable protein hydrolysates can provide valuable insights into their unique functional properties and potential applications.
What are the key market drivers leading to the rise in the adoption of Hydrolyzed Vegetable Protein Industry?
- The surge in the availability of High-Value Proteins (HVP) on e-commerce platforms serves as the primary growth catalyst for the market.
- Grocery shopping is increasingly moving online, joining apparel and other commodities as significant categories in digital marketplaces. The online channel is poised to become a primary distribution avenue for High Value Products (HVP) during the forecast period. Consumers are drawn to online platforms due to their convenience, time-saving benefits, and expedited delivery services. For small retailers and businesses, selling online expands product visibility and profitability.
- The global penetration of online grocery shopping is on the rise, offering a seamless shopping experience that attracts HVP companies to target the internet-savvy demographic and adopt the online retail format. This shift underscores the continuous evolution and growing importance of online sales channels in various sectors.
What are the market trends shaping the Hydrolyzed Vegetable Protein Industry?
- The increasing trend in the market is characterized by the growing adoption of organic and natural ingredients. (Or: Organic and natural ingredients are increasingly adopted in the market trend.)
- The surge in consumer preference for natural and organic products is driven by health and safety concerns and heightened awareness regarding ingredient sourcing. In the personal care sector, the demand for natural and organic offerings has witnessed significant growth due to their ability to address various skin issues, such as irritation, allergies, hair loss, acne, and dark spots. This trend is likely to fuel the demand for natural Hydrolyzed Vegetable Proteins (HVPs) in the future. The natural and organic product market's expansion has been particularly noticeable in the personal care and cosmeceutical industries, where these products serve as effective alternatives to synthetic solutions.
- As a professional, it is essential to maintain a formal tone and provide authoritative, data-driven insights into this evolving market. The natural and organic product sector's continuous growth can be attributed to its ability to cater to consumers' increasing health consciousness and desire for safer, more effective alternatives.
What challenges does the Hydrolyzed Vegetable Protein Industry face during its growth?
- The escalating demand for healthful and nutritious food products poses a significant challenge to the industry's growth trajectory.
- In the dynamic and evolving market landscape, the demand for healthy and nutritional products continues to rise, surpassing that of frozen, preservative-laden alternatives. This trend is driven by increasing consumer awareness regarding the health benefits associated with fresh produce. The shift towards fresh and nutritional products offers numerous advantages, such as enhanced energy levels, reduced aging effects, and weight management. The World Health Organization's (WHO) promotion of fresh fruit and vegetable consumption and the proliferation of supermarkets have negatively influenced the growth of the market.
- This pattern is observable across various sectors, as businesses adapt to consumer preferences and prioritize health-conscious offerings. The global market for healthy and nutritional products presents a significant opportunity for innovation and growth.
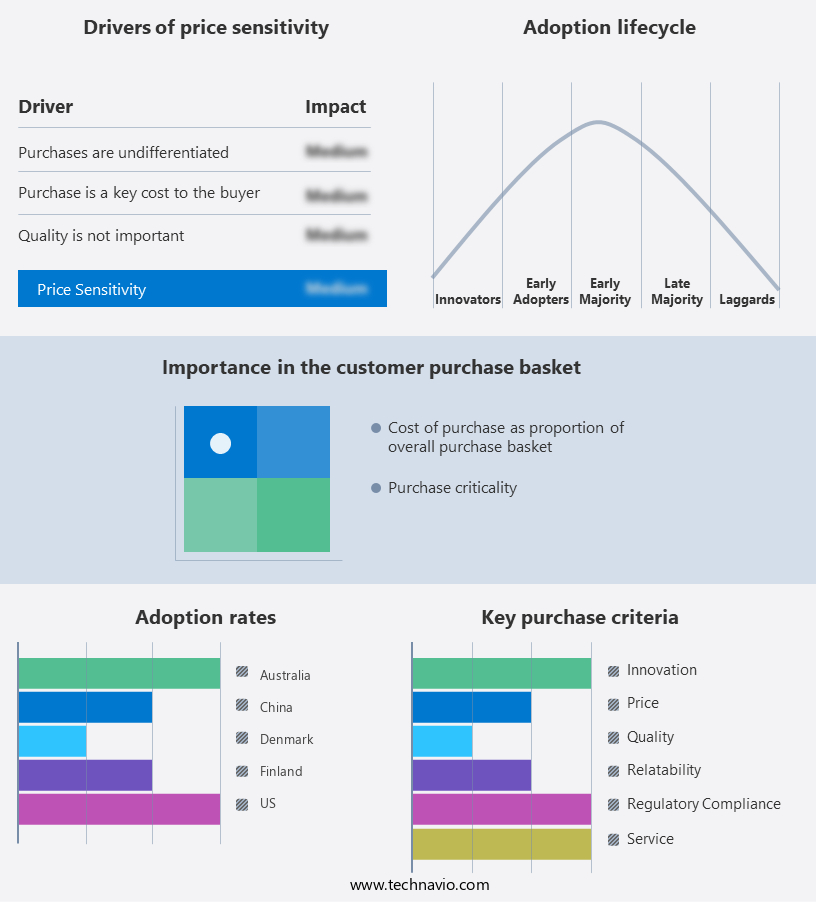
Exclusive Technavio Analysis on Customer Landscape
The hydrolyzed vegetable protein market forecasting report includes the adoption lifecycle of the market, covering from the innovator’s stage to the laggard’s stage. It focuses on adoption rates in different regions based on penetration. Furthermore, the hydrolyzed vegetable protein market report also includes key purchase criteria and drivers of price sensitivity to help companies evaluate and develop their market growth analysis strategies.
Customer Landscape of Hydrolyzed Vegetable Protein Industry
Competitive Landscape
Companies are implementing various strategies, such as strategic alliances, hydrolyzed vegetable protein market forecast, partnerships, mergers and acquisitions, geographical expansion, and product/service launches, to enhance their presence in the industry.
Aarkay Food Products Ltd. - This company specializes in producing hydrolyzed vegetable proteins, including soya, groundnut, and wheat, for various industries. These proteins undergo a hydrolysis process, resulting in high-quality, easily digestible nutrients. The company's commitment to innovation and sustainability sets it apart in the market.
The industry research and growth report includes detailed analyses of the competitive landscape of the market and information about key companies, including:
- Aarkay Food Products Ltd.
- Aipu Food Industry
- Ajinomoto Co. Inc.
- Akola Chemicals Ltd.
- BELVITA FOOD INGREDIENTS PVT. LTD.
- Caremoli SpA
- Chaitanya Agro Biotech Pvt. Ltd.
- DSM-Firmenich AG
- Foodchem International Corp.
- Givaudan SA
- Griffith Foods Worldwide Inc.
- Innova Flavors
- Kerry Group Plc
- New Alliance Dye Chem Pvt. Ltd.
- SINOFI INGREDIENTS
- Sun Impex International Foods LLC
- Tate and Lyle PLC
- Titan Biotech Ltd.
- YESRAJ AGRO EXPORTS PVT. LTD.
Qualitative and quantitative analysis of companies has been conducted to help clients understand the wider business environment as well as the strengths and weaknesses of key industry players. Data is qualitatively analyzed to categorize companies as pure play, category-focused, industry-focused, and diversified; it is quantitatively analyzed to categorize companies as dominant, leading, strong, tentative, and weak.
Recent Development and News in Hydrolyzed Vegetable Protein Market
- In January 2024, Ajinomoto Co. Inc., a leading global manufacturer of amino acids and umami seasoning, announced the expansion of its hydrolyzed vegetable protein (HVP) production capacity at its facility in the United States. This expansion aimed to meet the growing demand for plant-based protein alternatives in the food industry (Source: Ajinomoto Co. Inc. Press Release).
- In March 2024, DuPont Nutrition & Biosciences, a leading global producer of specialty food ingredients, entered into a strategic partnership with Greenleaf Foods, a plant-based protein company, to develop and commercialize new plant-based meat alternatives using HVP. This collaboration aimed to leverage DuPont's expertise in HVP production and Greenleaf's capabilities in plant-based meat production (Source: DuPont Nutrition & Biosciences Press Release).
- In May 2024, Royal DSM, a global science-based company active in health, nutrition, and materials, completed the acquisition of Vintus LLC, a US-based producer of HVP. This acquisition strengthened DSM's position in the HVP market and expanded its production capacity (Source: Royal DSM Press Release).
- In April 2025, Corbion, a global leader in sustainable biobased solutions, received regulatory approval from the European Commission for its new HVP production facility in the Netherlands. This approval marked the completion of the construction phase and the start of commercial production (Source: Corbion Press Release).
Dive into Technavio’s robust research methodology, blending expert interviews, extensive data synthesis, and validated models for unparalleled Hydrolyzed Vegetable Protein Market insights. See full methodology.
|
Market Scope |
|
|
Report Coverage |
Details |
|
Page number |
222 |
|
Base year |
2024 |
|
Historic period |
2019-2023 |
|
Forecast period |
2025-2029 |
|
Growth momentum & CAGR |
Accelerate at a CAGR of 6% |
|
Market growth 2025-2029 |
USD 864.1 million |
|
Market structure |
Fragmented |
|
YoY growth 2024-2025(%) |
5.5 |
|
Key countries |
US, China, Germany, UK, Japan, France, Canada, Brazil, India, and Italy |
|
Competitive landscape |
Leading Companies, Market Positioning of Companies, Competitive Strategies, and Industry Risks |
Research Analyst Overview
- The market is a dynamic and evolving sector in the food industry, with ongoing advancements in production techniques, product applications, and quality control measures. Hydrolyzed vegetable proteins, derived from plant-based sources through processes like enzymatic hydrolysis, offer numerous advantages in food processing. Maintaining microbial contamination control is a critical aspect of hydrolyzed vegetable protein production. Texture modification and optimization strategies are employed to enhance the foaming properties, rheological characteristics, and water binding capacity of these proteins. Shelf life extension is another significant focus, with quality control measures ensuring the desired sensory attributes and functional properties are maintained.
- Peptide chain length plays a crucial role in determining the nutritional value improvement and digestibility assessment of hydrolyzed vegetable proteins. The degree of hydrolysis is a key parameter in the enzymatic hydrolysis process, influencing the nitrogen content determination and cost-effective production. In food processing applications, hydrolyzed vegetable proteins are utilized for their flavor enhancement and allergen reduction methods. Functional properties evaluation, including emulsion stability, solubility characteristics, and gelation properties, are essential to ensure optimal performance in various applications. Plant-based protein sources, such as soy, pea, and rice, are commonly used in hydrolyzed vegetable protein production.
- Process optimization strategies are continually being explored to enhance the production efficiency and reduce protein denaturation during processing. Bitterness control is a significant challenge in hydrolyzed vegetable protein production, with packaging optimization and flavor masking techniques employed to address this issue. The market is continually evolving, with ongoing research focusing on improving the nutritional value, texture, and sensory attributes of hydrolyzed vegetable proteins.
What are the Key Data Covered in this Hydrolyzed Vegetable Protein Market Research and Growth Report?
-
What is the expected growth of the Hydrolyzed Vegetable Protein Market between 2025 and 2029?
-
USD 864.1 million, at a CAGR of 6%
-
-
What segmentation does the market report cover?
-
The report segmented by Type (Dry powder, Liquid, and Paste), Distribution Channel (Direct and Indirect), Source (Soy protein, Wheat protein, Pea protein, and Rice protein), and Geography (Europe, North America, APAC, South America, and Middle East and Africa)
-
-
Which regions are analyzed in the report?
-
Europe, North America, APAC, South America, and Middle East and Africa
-
-
What are the key growth drivers and market challenges?
-
Increasing availability of HVP on e-commerce platforms, Increasing demand for healthy and nutritional food products
-
-
Who are the major players in the Hydrolyzed Vegetable Protein Market?
-
Key Companies Aarkay Food Products Ltd., Aipu Food Industry, Ajinomoto Co. Inc., Akola Chemicals Ltd., BELVITA FOOD INGREDIENTS PVT. LTD., Caremoli SpA, Chaitanya Agro Biotech Pvt. Ltd., DSM-Firmenich AG, Foodchem International Corp., Givaudan SA, Griffith Foods Worldwide Inc., Innova Flavors, Kerry Group Plc, New Alliance Dye Chem Pvt. Ltd., SINOFI INGREDIENTS, Sun Impex International Foods LLC, Tate and Lyle PLC, Titan Biotech Ltd., and YESRAJ AGRO EXPORTS PVT. LTD.
-
Market Research Insights
- The market continues to evolve, driven by increasing consumer demand for plant-based alternatives and advancements in production methods. According to industry estimates, the market value is projected to reach USD2.5 billion by 2025, growing at a CAGR of 6% during the forecast period. This growth is attributed to the adoption of sustainable production techniques, such as waste reduction strategies and yield optimization, which contribute to both cost reduction and improved environmental sustainability. Hydrolysate characterization and stability studies are crucial aspects of product development in this market. Sensory attributes, protein functionality, and nutritional labeling are key considerations in ensuring consumer acceptance and regulatory compliance.
- Market demand for hydrolyzed vegetable proteins is diverse, with applications in various food ingredient sectors, including beverages, baked goods, and processed meats. As product formulation and application suitability continue to evolve, so too do storage conditions, regulatory requirements, and cost reduction strategies. Energy efficiency improvements and quality assurance systems are essential for maintaining competitiveness in this dynamic market.
We can help! Our analysts can customize this hydrolyzed vegetable protein market research report to meet your requirements.
 RIA -
RIA - 
