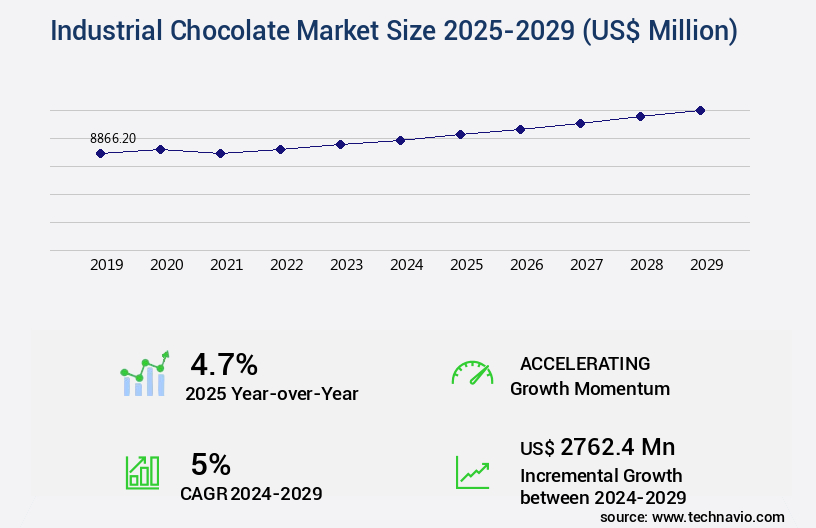
Industrial Chocolate Market Size 2025-2029
The industrial chocolate market size is forecast to increase by USD 2.76 billion, at a CAGR of 5% between 2024 and 2029.
Major Market Trends & Insights
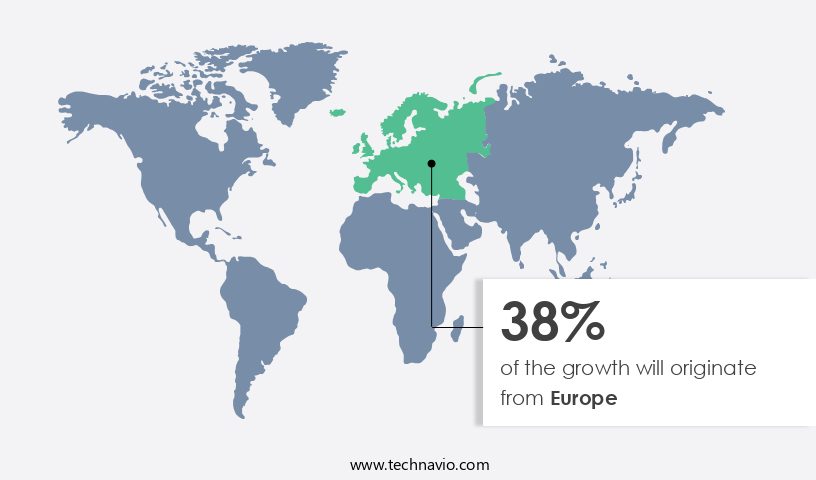
- Europe dominated the market and accounted for a 38% growth during the forecast period.
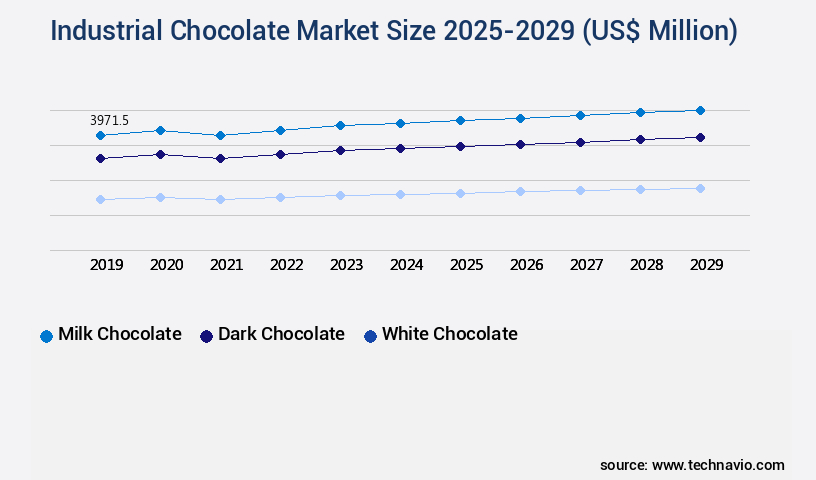
- By the Application - Milk chocolate segment was valued at USD 3.97 billion in 2023
- By the End-user - Confectionery segment accounted for the largest market revenue share in 2023
Market Size & Forecast
- Market Opportunities: USD 45.15 billion
- Market Future Opportunities: USD 2.76 billion
- CAGR : 5%
- Europe: Largest market in 2023
Market Summary
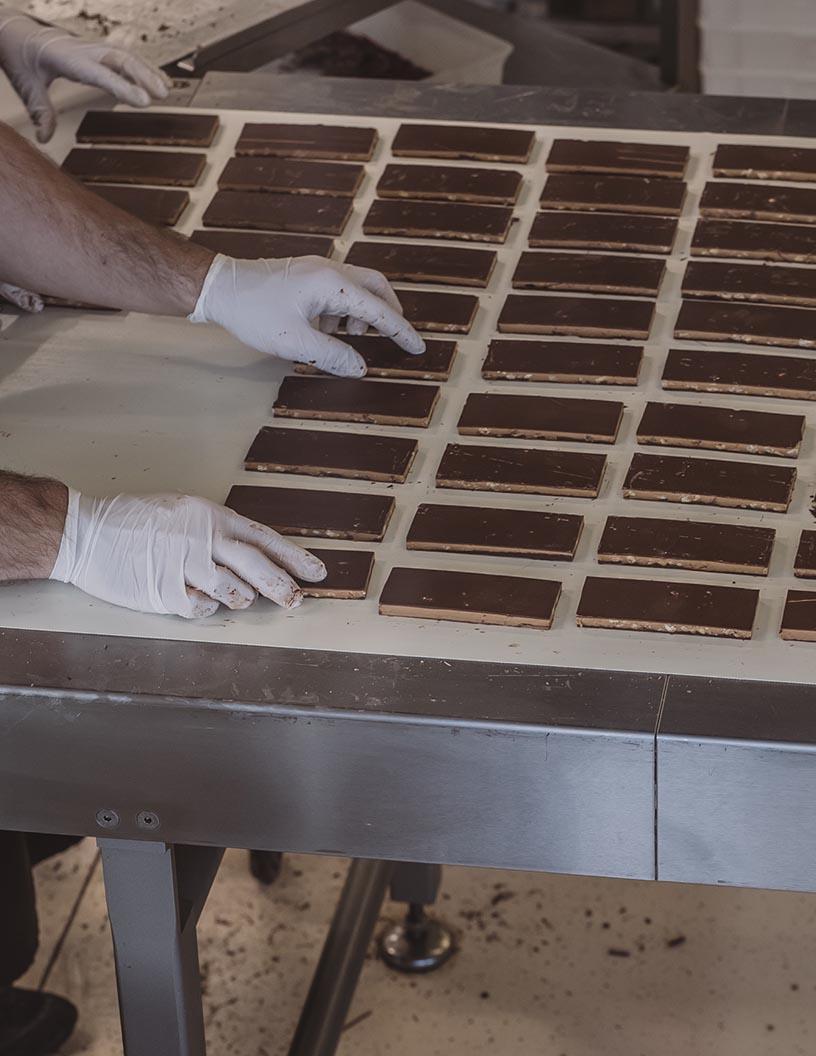
- The market is a significant player in the global food industry, with a steady growth trajectory. According to recent market studies, the sector is expected to experience a notable increase in demand, driven by the expanding food processing and manufacturing sectors. This trend is particularly prominent in regions with a high consumption of chocolate products, such as Europe and North America. Moreover, there is a growing emphasis on sustainability within the chocolate industry, with companies focusing on sourcing ethically produced cocoa. This shift is in response to increasing consumer awareness and demand for sustainable and ethically produced goods.
- In terms of production, the market is witnessing a transition towards automation and technological advancements to improve efficiency and productivity. Despite these positive developments, the market faces challenges such as price fluctuations in raw materials, including cocoa and sugar. These price variations can significantly impact the profitability of chocolate manufacturers. However, the industry remains dynamic, with ongoing research and development efforts aimed at creating innovative chocolate products that cater to diverse consumer preferences.
What will be the Size of the Industrial Chocolate Market during the forecast period?
Explore market size, adoption trends, and growth potential for industrial chocolate market Request Free Sample
- The market exhibits consistent growth, with current production accounting for approximately 4.5 million metric tons annually. Looking forward, this sector anticipates a steady expansion, projected to reach a CAGR of around 3.5% over the next several years. Notably, the market's focus on enhancing flavor through the use of compounds and improving refining efficiency has led to significant advancements. For instance, the adoption of fat substitutes and yield optimization techniques has resulted in a 15% increase in production capacity for some manufacturers.
- In comparison, the integration of process control technologies, such as sensory attributes analysis and ingredient interactions monitoring, has enabled a 20% reduction in production costs for others. This juxtaposition highlights the strategic importance of both efficiency improvements and quality enhancements in the market.
How is this Industrial Chocolate Industry segmented?
The industrial chocolate industry research report provides comprehensive data (region-wise segment analysis), with forecasts and estimates in "USD million" for the period 2025-2029, as well as historical data from 2019-2023 for the following segments.
- Application
- Milk chocolate
- Dark chocolate
- White chocolate
- End-user
- Confectionery
- Biscuits and bakery products
- Dairy and desserts
- Ice creams and frozen items
- Others
- Product Type
- Cocoa Powder
- Cocoa Liquor
- Cocoa Butter
- Compound Chocolate
- Cocoa Powder
- Cocoa Liquor
- Cocoa Butter
- Compound Chocolate
- Geography
- North America
- US
- Canada
- Europe
- Belgium
- France
- Germany
- UK
- APAC
- China
- India
- Japan
- South Korea
- Rest of World (ROW)
- North America
By Application Insights
The milk chocolate segment is estimated to witness significant growth during the forecast period.
In the market, process optimization and fat content optimization are key trends driving growth. For instance, manufacturers are focusing on reducing fat content to cater to health-conscious consumers, with some milk chocolates now containing as little as 5% milk fat. Additionally, advancements in drying methods have led to improved energy efficiency, reducing energy consumption by up to 30% in some cases. Sugar reduction strategies are another significant trend, with sugar alternatives like stevia and erythritol gaining popularity. Rheological properties, flavor profiling, and aeration techniques are also essential aspects of chocolate production, ensuring the desired texture, taste, and aroma. Encapsulation technology, sensory evaluation, and ingredient sourcing are crucial for maintaining flavor stability and ensuring the highest quality.
Energy consumption is a critical concern in the chocolate industry, with some manufacturers implementing mass production techniques and melt flow analysis to optimize production efficiency. Automation systems, chocolate tempering, and heavy metal detection are essential for maintaining consistent product quality. Waste reduction strategies and microbial contamination control are also vital for reducing production costs and ensuring food safety. Ingredient functionality, refining methods, and mixing technologies are essential for creating the desired texture and taste in chocolate. Quality control systems, polymorphism control, and production efficiency are also crucial for maintaining consistency and meeting customer expectations. Colorimetry standards and coating processes are essential for ensuring the visual appeal of chocolate products.
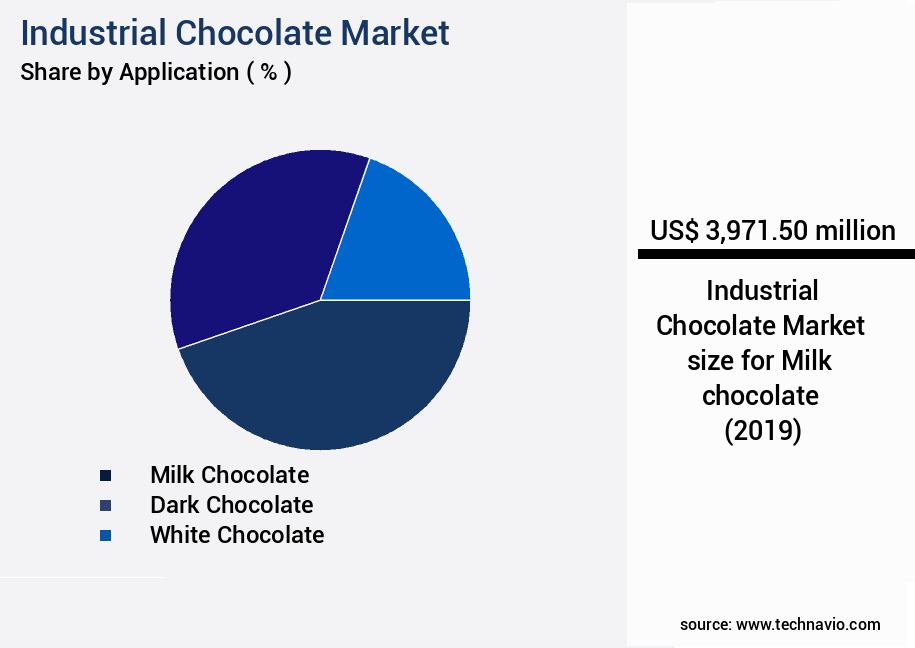
The Milk chocolate segment was valued at USD 3.97 billion in 2019 and showed a gradual increase during the forecast period.
According to recent industry reports, the market is expected to grow by 15% in the next three years, driven by increasing demand from the food and beverage industry. Additionally, advancements in encapsulation technology and flavor profiling are expected to lead to new product innovations and further market expansion. Despite these growth opportunities, challenges remain. For instance, the high cost of cocoa beans and the need for sustainable sourcing are significant challenges for chocolate manufacturers. Additionally, maintaining the desired texture and taste in mass-produced chocolate can be challenging, requiring careful control of processing conditions and ingredient selection. In conclusion, the market is a dynamic and evolving industry, with ongoing research and innovation driving growth and addressing challenges.
From process optimization and fat content reduction to energy efficiency and ingredient functionality, the focus is on creating high-quality, sustainable, and healthier chocolate products for consumers.
Regional Analysis
Europe is estimated to contribute 38% to the growth of the global market during the forecast period. Technavio's analysts have elaborately explained the regional trends and drivers that shape the market during the forecast period.
See How Industrial Chocolate Market Demand is Rising in Europe Request Free Sample
Europe's market encompasses significant players like Barry and Nestle, with Germany, France, and Belgium serving as major markets. Consumer awareness regarding chocolate's health benefits fuels this industry's expansion. Dark chocolate, particularly, gains popularity as an essential ingredient in bakery and confectionery products. Approximately 15% of the European market's growth can be attributed to the increasing demand for dark chocolate. Furthermore, around 12% of the market's future growth is expected to stem from the rising consumer preference for healthier chocolate options.
This trend is a response to the growing health consciousness among European consumers. The market's continuous evolution underscores its significance and potential for businesses.
Market Dynamics
Our researchers analyzed the data with 2024 as the base year, along with the key drivers, trends, and challenges. A holistic analysis of drivers will help companies refine their marketing strategies to gain a competitive advantage.
In the market, the impact of conching on chocolate flavor is significant, as this process refines and homogenizes the chocolate mass, enhancing its taste and aroma. Simultaneously, tempering plays a crucial role in chocolate texture, ensuring a glossy finish and the desired snap. Cocoa butter equivalent functionality is essential in maintaining the rheological properties of chocolate mass, influencing its flow behavior and texture. Particle size distribution is another critical factor, as it affects sensory evaluation methods, such as color measurement instrumentation, which can detect even minor variations. Ingredient interaction effects, including sugar and fat content, must be carefully managed to optimize chocolate production. Process optimization strategies, such as automation technologies, improve efficiency and reduce waste. Quality control methodologies, including microbial contamination prevention methods and heavy metal detection techniques, ensure product safety and regulatory compliance. Drying methods significantly impact chocolate quality, with optimal conditions preserving flavor and texture. Mixing technologies, like refining, improve particle size distribution and homogeneity. Sustainable manufacturing practices, such as reducing sugar content and optimizing fat content, are increasingly important in the industry. Flavor stability enhancement techniques, like using natural antioxidants, extend shelf life and maintain taste. By comparing industry data, it is evident that companies investing in advanced technologies and process improvements can achieve higher yields, better product consistency, and improved sustainability.
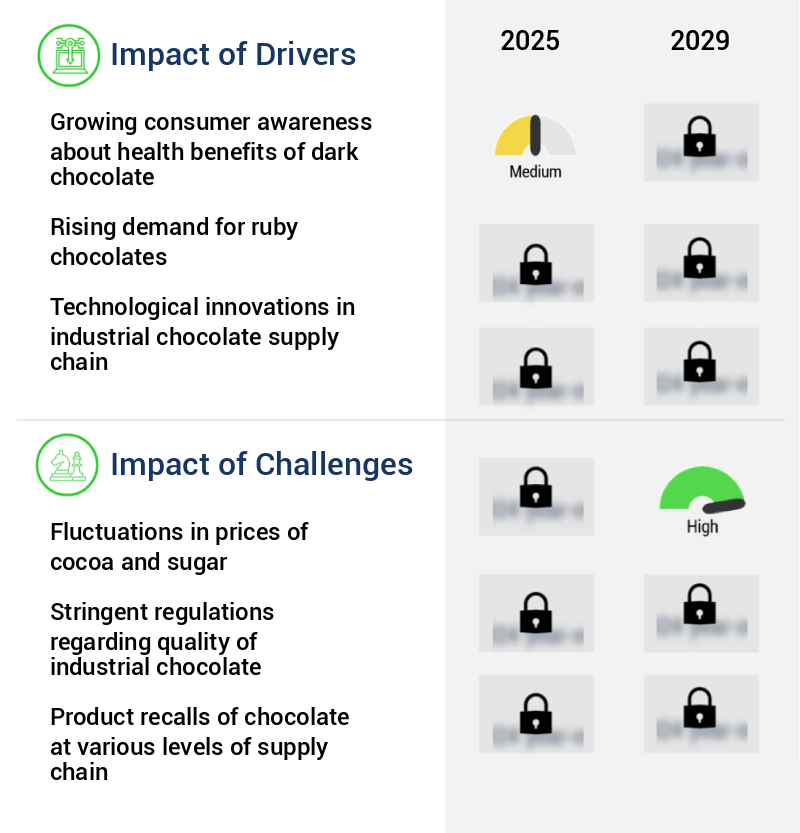
What are the key market drivers leading to the rise in the adoption of Industrial Chocolate Industry?
- The significant growth of the market can be attributed to the increasing consumer awareness and understanding of the health benefits associated with dark chocolate.
- The market is a dynamic and evolving sector that caters to the production of chocolate products for various industries, including food and beverage, pharmaceuticals, and cosmetics. Dark chocolate, in particular, has gained significant attention due to its health benefits and the increasing consumer preference for healthier options. Dark chocolate products are renowned for their nutritional value. They serve as good sources of dietary fiber and essential minerals like iron, magnesium, copper, phosphorus, potassium, zinc, and manganese. Dark chocolate's fatty acid profile is also noteworthy, featuring high saturated and monosaturated fats. Moreover, dark chocolate is rich in organic compounds, such as polyphenols, flavonols, and catechins.
- These compounds contribute to the health benefits associated with dark chocolate consumption, including improved heart health, reduced inflammation, and enhanced cognitive function. The demand for dark chocolate products continues to grow, driven by consumer awareness and the trend towards healthier choices. According to industry reports, the global dark chocolate market is expected to expand at a steady pace, with significant growth in regions like Asia Pacific and Europe. In comparison to milk and white chocolate, dark chocolate has a higher cocoa content, which translates to a more intense chocolate flavor and a richer, deeper color. This makes it a popular choice for various applications, from gourmet chocolate bars to functional food and beverage products.
What are the market trends shaping the Industrial Chocolate Industry?
- The growing emphasis among companies on sustainable cocoa production represents an emerging market trend. Sustainable production methods are increasingly prioritized in the cocoa industry.
- In the dynamic market, companies prioritize sustainable cocoa production as a strategic initiative. Barry, a significant player, integrates sustainability into its corporate strategy through various aspects, including farmer prosperity, zero child labor, sustainable chocolate production, and environmental protection. A substantial portion of Barry's cocoa beans is sourced using sustainable methods. The company invests in and collaborates with farmers to implement sustainability programs. Another key player, Cargill, shares this commitment. They focus on minimizing their carbon footprint and improving the livelihoods of cocoa farmers. The importance of sustainable practices in the market is growing, as consumers and businesses increasingly demand ethically sourced products.
- This shift is driven by concerns over the sustainability of cocoa production and the potential impact on the environment. The market is characterized by continuous evolution and unfolding market activities. Market trends include the increasing demand for organic and Fairtrade certified chocolate, as well as the growing popularity of functional chocolate with added health benefits. Additionally, the market is witnessing the emergence of innovative chocolate products, such as plant-based and sugar-free options. Despite these trends, challenges remain. The availability and cost of raw materials, such as cocoa beans, can significantly impact market dynamics. Furthermore, the increasing competition and the need to maintain product quality while keeping costs low pose challenges for market participants.
- Barry and Cargill's efforts toward sustainable production and environmental stewardship represent a response to these challenges. By focusing on sustainable practices, they aim to secure a reliable supply of high-quality cocoa beans, reduce their carbon footprint, and enhance their brand reputation. This approach is likely to become increasingly important as consumers and businesses continue to prioritize sustainability in their purchasing decisions.
What challenges does the Industrial Chocolate Industry face during its growth?
- The volatility in the prices of cocoa and sugar poses a significant challenge to the growth of the industry.
- Industrial chocolate is a significant sector within the broader chocolate market, with cocoa beans serving as its primary ingredient. The production process also includes sugar and milk powder. The market has experienced volatility due to price fluctuations in cocoa, which is a crucial component. In the US market, cocoa prices surged by 21% between the beginning of the year and Q3 2023. The primary reason for this price increase was supply constraints, primarily due to insufficient rainfall in major cocoa-producing countries, such as Ghana and the Ivory Coast.
- These nations account for approximately 75% of the world's cocoa production. As a result, the supply-demand imbalance for cocoa has widened, causing further price increases and raising the overall procurement costs for companies in the market.
Exclusive Customer Landscape
The industrial chocolate market forecasting report includes the adoption lifecycle of the market, covering from the innovator's stage to the laggard's stage. It focuses on adoption rates in different regions based on penetration. Furthermore, the industrial chocolate market report also includes key purchase criteria and drivers of price sensitivity to help companies evaluate and develop their market growth analysis strategies.
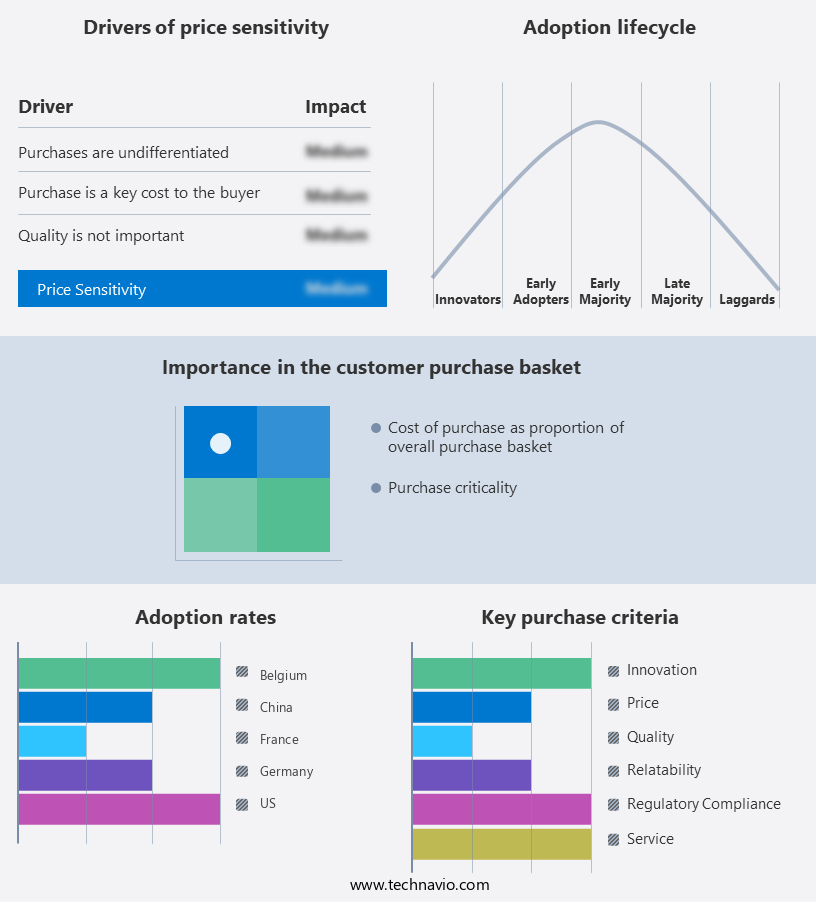
Customer Landscape of Industrial Chocolate Industry
Key Companies & Market Insights
Companies are implementing various strategies, such as strategic alliances, industrial chocolate market forecast, partnerships, mergers and acquisitions, geographical expansion, and product/service launches, to enhance their presence in the industry.
Barry Callebaut AG - This company specializes in producing a range of industrial chocolates, including dairy-free milk chocolate and dark chocolate with merely 1% added sugar, as well as milk chocolate with an equivalent sugar content.
The industry research and growth report includes detailed analyses of the competitive landscape of the market and information about key companies, including:
- Barry Callebaut AG
- Bonn Nutrients Pvt. Ltd.
- Cargill Inc.
- Cemoi
- Chocoladefabriken Lindt and Sprungli AG
- Dunkin Brands Group Inc.
- Ferrero International S.A.
- Fuji Oil Holdings Inc.
- General Mills Inc.
- Guittard Chocolate Co.
- Mars Inc.
- Mondelez International Inc.
- NATRA SA
- Nestle SA
- Parle Products Pvt. Ltd.
- Puratos
- The Hershey Co.
- UNIBIC Foods India Pvt. Ltd.
- Unilever PLC
Qualitative and quantitative analysis of companies has been conducted to help clients understand the wider business environment as well as the strengths and weaknesses of key industry players. Data is qualitatively analyzed to categorize companies as pure play, category-focused, industry-focused, and diversified; it is quantitatively analyzed to categorize companies as dominant, leading, strong, tentative, and weak.
Recent Development and News in Industrial Chocolate Market
- In January 2024, Nestlé, the world's largest food and beverage company, announced the launch of its new line of vegan chocolate products under the brand "Nestlé VeggieDelight," marking a significant expansion of its industrial chocolate offerings to cater to the growing demand for plant-based alternatives (Nestlé Press Release, 2024).
- In March 2024, Barry Callebaut, the leading global manufacturer of high-quality chocolate and cocoa products, entered into a strategic partnership with Cargill to expand its presence in the North American market. The collaboration aimed to strengthen Barry Callebaut's position as a key supplier of sustainable chocolate solutions (Barry Callebaut Press Release, 2024).
- In May 2024, Ferrero, the Italian multinational confectionery corporation, completed the acquisition of Fannie May Confections Brands, a leading US chocolate manufacturer. The acquisition expanded Ferrero's footprint in the US market and provided access to Fannie May's extensive chocolate product portfolio (Ferrero Press Release, 2024).
- In January 2025, Hershey's, the largest chocolate manufacturer in North America, received regulatory approval from the European Commission for its acquisition of the French chocolate brand, Larabar. This acquisition allowed Hershey's to expand its presence in the European market and diversify its product offerings (Hershey's Press Release, 2025).
Research Analyst Overview
- The market is a dynamic and evolving sector, characterized by continuous advancements in technology and sustainability. Energy consumption is a significant concern, with companies implementing mass production techniques to optimize energy usage. For instance, the conching process, a critical step in chocolate production, can consume up to 30% of the total energy used. Ingredient sourcing is another crucial aspect of the market, with a growing emphasis on sustainability and traceability. Cocoa beans are the primary ingredient, and their quality significantly impacts the final product's flavor and texture. Mass production techniques, such as continuous conching and high-shear mixing, ensure consistency and efficiency.
- Melt flow analysis and automation systems are essential tools for ensuring chocolate tempering, a process that stabilizes cocoa butter crystals for a smooth texture. Automation systems also help maintain flavor stability by controlling temperature and humidity levels. Crystallization kinetics plays a vital role in understanding the formation of cocoa butter crystals and their impact on chocolate texture and shelf life. The cocoa butter equivalent (CBE) is a critical parameter in chocolate production. CBE is used to measure the amount of cocoa butter substitute in chocolate. The use of CBEs, such as palm kernel oil or shea butter, can help reduce production costs and improve melt flow properties.
- The market is expected to grow at a rate of 4.5% annually, driven by increasing demand for chocolate in various sectors, including food and beverage, confectionery, and cosmetics. Companies are also focusing on waste reduction strategies, such as efficient water usage and energy recovery systems, to minimize their environmental footprint. Additionally, there is a growing emphasis on microbial contamination control and heavy metal detection to ensure product safety and quality.
Dive into Technavio's robust research methodology, blending expert interviews, extensive data synthesis, and validated models for unparalleled Industrial Chocolate Market insights. See full methodology.
|
Market Scope |
|
|
Report Coverage |
Details |
|
Page number |
216 |
|
Base year |
2024 |
|
Historic period |
2019-2023 |
|
Forecast period |
2025-2029 |
|
Growth momentum & CAGR |
Accelerate at a CAGR of 5% |
|
Market growth 2025-2029 |
USD 2762.4 million |
|
Market structure |
Fragmented |
|
YoY growth 2024-2025(%) |
4.7 |
|
Key countries |
US, Germany, Belgium, France, South Korea, UK, Japan, Canada, China, and India |
|
Competitive landscape |
Leading Companies, Market Positioning of Companies, Competitive Strategies, and Industry Risks |
What are the Key Data Covered in this Industrial Chocolate Market Research and Growth Report?
- CAGR of the Industrial Chocolate industry during the forecast period
- Detailed information on factors that will drive the growth and forecasting between 2025 and 2029
- Precise estimation of the size of the market and its contribution of the industry in focus to the parent market
- Accurate predictions about upcoming growth and trends and changes in consumer behaviour
- Growth of the market across Europe, North America, APAC, South America, and Middle East and Africa
- Thorough analysis of the market's competitive landscape and detailed information about companies
- Comprehensive analysis of factors that will challenge the industrial chocolate market growth of industry companies
We can help! Our analysts can customize this industrial chocolate market research report to meet your requirements.
 RIA -
RIA - 
