Laboratory Automation Systems Market Analysis North America, Europe, Asia, Rest of World (ROW) - US, Germany, UK, China, Japan - Size and Forecast 2024-2028

Laboratory Automation Systems Market Analysis North America, Europe, Asia, Rest of World (ROW) - US, Germany, UK, China, Japan - Size and Forecast 2024-2028

Published: Feb 2024 172 Pages SKU: IRTNTR70151

Market Overview at a Glance

$2.01 B
Market Opportunity
8.68%
CAGR
8.26
YoY growth 2023-2024(%)

Laboratory Automation Systems Market Size 2024-2028 

The laboratory automation systems market size is forecast to increase by USD 2.01 billion at a CAGR of 8.68% between 2023 and 2028.

  • In the laboratory industry, the demand for automation systems is on the rise due to several factors. The need for high-volume testing in healthcare applications, such as hospitals and diagnostic laboratories, is driving the market. Additionally, regulatory requirements in food safety and healthcare industries necessitate the use of automated solutions to ensure accuracy and compliance. Automation in laboratories is transforming the way clinical chemistry analysis, immunoassay analysis, and high-throughput analysis are conducted.
  • However, budget constraints and the lack of adoption by smaller laboratories present challenges. The market is witnessing an increase in the adoption of automated workstations and tables with accessories to streamline processes and enhance productivity. Developing nations are also witnessing a growth in FDA-approved manufacturing facilities, leading to further growth opportunities. Despite these trends, the market faces challenges in gaining traction among small-scale and medium-scale laboratories due to cost constraints. Overall, the market is poised for growth, offering significant opportunities for companies and stakeholders.

What will be the Laboratory Automation Systems Market Size During the Forecast Period?

Laboratory Automation Systems Market Size

 Request Free Sample

  • The market is witnessing significant growth due to the increasing demand for reliable results and safe working conditions in clinical laboratories. Laboratory automation systems are designed to streamline various laboratory processes, including sample handling, liquid handling, and data analysis. These systems enable laboratories to handle large volumes of samples efficiently and accurately, reducing human intervention and minimizing errors. The healthcare sector, particularly diagnostic laboratories, is the primary consumer of laboratory automation systems. These systems help laboratories meet the growing demand for quick and accurate diagnostic tests, ensuring that patients receive timely and reliable results. Automated workstations and robotic systems are the most popular types of laboratory automation systems. These systems offer advanced data management capabilities, allowing laboratories to store, retrieve, and analyze data efficiently.
  • Furthermore, they also help ensure consistent and standardized results, which is crucial in the healthcare industry. Sample preparation is a critical process in laboratory analysis, and laboratory automation systems are increasingly being used to automate this process. Automated sample preparation reduces the risk of human error and ensures consistent results, leading to increased productivity and improved patient outcomes. Liquid handling is another process that is being automated in laboratories. Automated liquid handling systems offer precise and accurate measurement and dispensing of liquids, reducing the risk of errors and minimizing the need for manual intervention. The total automation segment of the market is expected to grow significantly in the coming years. This growth is driven by the increasing demand for fully automated laboratory processes, which offer significant benefits in terms of increased productivity, reduced errors, and improved safety.
  • In conclusion, laboratory automation systems are becoming an essential tool for clinical laboratories, enabling them to deliver reliable results in a safe and efficient manner. These systems offer numerous benefits, including reduced human intervention, improved data management, and increased productivity. As the demand for quick and accurate diagnostic tests continues to grow, the market is expected to continue its growth trajectory.

How is this market segmented and which is the largest segment?

The market research report provides comprehensive data (region-wise segment analysis), with forecasts and estimates in "USD billion" for the period 2024-2028, as well as historical data from 2018-2022 for the following segments.

  • End-user
    • Pharmaceutical and biotechnology companies
    • Clinical and reference laboratories
    • Academic institutions and research organizations
    • Others
  • Type
    • Equipment
    • Software
    • services
  • Geography
    • North America
      • US
    • Europe
      • Germany
      • UK
    • Asia
      • China
      • Japan
    • Rest of World (ROW)

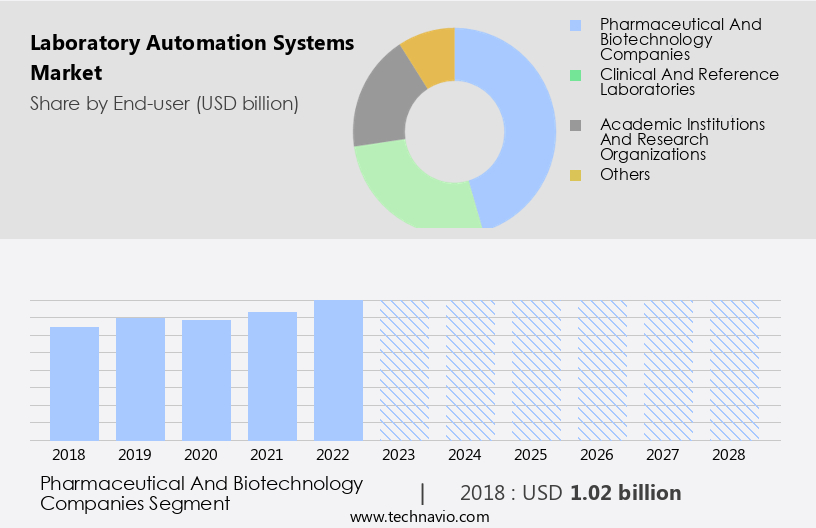
By End-user Insights

  • The pharmaceutical and biotechnology companies segment is estimated to witness significant growth during the forecast period.

In the realm of pharmaceutical and biotechnology research, the implementation of automated work cells, including robotic systems, has significantly increased efficiency in laboratories, particularly within the diagnostics segment. These advanced technologies have revolutionized processes in drug discovery and genomics, as well as proteomics solutions. Laboratories and forensic facilities are major end users of these systems, which reduce repetitiveness and human intervention.

Furthermore, automated liquid handling systems are integral to the drug discovery process, enabling high-throughput screening of clinically relevant compounds. These systems precisely measure and analyze liquid samples in a timely and accurate manner, expediting the identification of compounds with desirable properties for drug development. The pharmaceutical and biotechnology companies segment is experiencing substantial growth due to these advancements, streamlining the drug discovery process and enhancing overall productivity.

Laboratory Automation Systems Market Size

Get a glance at the market report of share of various segments Request Free Sample

The pharmaceutical and biotechnology companies segment was valued at USD 1.02 billion in 2018 and showed a gradual increase during the forecast period.

Regional Analysis

  • North America is estimated to contribute 42% to the growth of the global market during the forecast period.

Technavio's analysts have elaborately explained the regional trends and drivers that shape the market during the forecast period.

Laboratory Automation Systems Market Share by Geography

For more insights on the market share of various regions, Request Free Sample

In the global landscape, North America led the market in 2023, with the United States being the frontrunner. Factors such as substantial investments in areas like precision medicine, genomics, and proteomics; robust distribution networks; intense focus of pharmaceutical companies on drug discovery and development; and the presence of major players, including Abbott Laboratories, Agilent Technologies Inc., and Thermo Fisher Scientific Inc., fuel the market growth in the US. Companies in this region are continually launching innovative products and associated services, such as software solutions, which are drawing end-users to procure laboratory automation systems.

Furthermore, these systems offer significant benefits, including increased productivity, safe working conditions, reliable results, time savings, and cost efficiency, making them indispensable in various industries, including clinical laboratories and research institutions. The US market for laboratory automation systems is poised for continued expansion due to these advantages and the ongoing technological advancements in the field of automated instruments and process automation.

Market Dynamics

Our researchers analyzed the data with 2023 as the base year, along with the key drivers, trends, and challenges. A holistic analysis of drivers will help companies refine their marketing strategies to gain a competitive advantage.

What are the key market drivers leading to the rise in adoption of Laboratory Automation Systems Market?

Increasing demand for laboratory automation software services is the key driver of the market.

  • Laboratory automation systems have gained significant traction in the scientific community due to their ability to streamline processes and enhance accuracy in various applications, including sample handling, verifications, and labeling tubes. companies are now integrating software services with their laboratory equipment to cater to the evolving needs of customers and ensure consistent, high-quality results. These software solutions offer an intuitive and adaptable user interface, enabling users to analyze data from samples. Compliance with regulatory standards, such as Certificates of Analysis (COA) and Certificates of Conformance (COC), is a priority for these software services.
  • Furthermore, they can be customized to meet the specific requirements of end-users. For instance, Thermo Fisher Scientific Inc.'s Versette ControlMate Software enables users to create and execute pipetting programs for intricate pipetting sequences, such as plate reformatting, serial dilutions, or immunoaffinity sample preparations, using mass spectrometric immunoassay (MSIA) pipette tips. Overall, these software services are essential tools for laboratories in microbiology, biotechnology, clinical chemistry, and other fields, enabling miniaturization and physical strain reduction while maintaining the highest standards of precision and accuracy.

What are the market trends shaping the Laboratory Automation Systems Market?

The rising number of FDA-approved manufacturing facilities in developing nations is the upcoming trend in the market.

  • In the healthcare sector, outsourcing laboratory needs to trusted partners is a significant trend. Companies prioritize partners with US FDA-approved facilities, a competent workforce, and cost-effective operations when outsourcing drug discovery and medical device manufacturing. For instance, US-based firms prefer partners that adhere to WHO-Good Manufacturing Practice (GMP) standards.
  • Furthermore, these criteria have led to increased investments in laboratory automation systems and contract research outsourcing in developing countries. High-volume laboratories in these regions offer healthcare applications, including diagnostics, food safety testing, and regulatory compliance, at competitive prices. Hospitals and diagnostic laboratories in the US face budget constraints, making it essential to collaborate with reliable outsourcing partners. Automated workstations and tables with accessories are crucial for high-volume laboratories to meet the growing demand for efficient and accurate testing.

What challenges does Laboratory Automation Systems Market face during the growth?

The lack of adoption of automated solutions by small-scale and medium-scale laboratories is a key challenge affecting the market growth.

  • In the realm of laboratory operations, medium and small-sized facilities face unique challenges due to their limited budgets, staff, and space. These laboratories primarily focus on specific applications, such as diagnostic testing and analysis of biological samples, and thus prioritize manual processes over automation. However, the significance of data analysis and accuracy in laboratory work cannot be overstated. Laboratory Automation Systems (LAS) offer solutions to enhance data management, sample preparation, and integration, thereby improving efficiency and flexibility. Government legislation mandates stringent quality control measures, making it essential for laboratories to maintain accuracy in their results.
  • Furthermore, immunoassay analysis, a critical process in various industries, benefits significantly from LAS. Data analysis is a crucial aspect of LAS, enabling labs to gain valuable insights from the vast amounts of data generated. Total automation segments of LAS offer advanced capabilities, including customization services, to cater to the unique requirements of various applications. Despite the benefits, small and medium-sized laboratories often shy away from investing in LAS due to space constraints and budget limitations. Nevertheless, the integration of LAS with existing infrastructure can lead to substantial improvements in productivity and accuracy, making it a worthwhile investment in the long run.

Exclusive Customer Landscape

The market forecasting report includes the adoption lifecycle of the market, covering from the innovator's stage to the laggard's stage. It focuses on adoption rates in different regions based on penetration. Furthermore, the market report also includes key purchase criteria and drivers of price sensitivity to help companies evaluate and develop their market growth analysis strategies.

Laboratory Automation Systems Market Share by Geography

 Customer Landscape

Key Companies & Market Insights

Companies are implementing various strategies, such as strategic alliances, market forecast, partnerships, mergers and acquisitions, geographical expansion, and product/service launches, to enhance their presence in the market. The market research and growth report includes detailed analyses of the competitive landscape of the market and information about key companies, including:

  • Abbott Laboratories
  • Agilent Technologies Inc.
  • Becton Dickinson and Co.
  • Bee Robotics Ltd.
  • Biosero Inc.
  • Cognex Corp.
  • Eppendorf SE
  • F. Hoffmann La Roche Ltd.
  • Gilson Inc.
  • LabVantage Solutions Inc.
  • LabWare Inc.
  • Olympus Corp.
  • PerkinElmer Inc
  • QIAGEN NV
  • SCINOMIX
  • Siemens AG
  • SPT Labtech Ltd.
  • Tecan Trading AG
  • Thermo Fisher Scientific Inc.

Qualitative and quantitative analysis of companies has been conducted to help clients understand the wider business environment as well as the strengths and weaknesses of key market players. Data is qualitatively analyzed to categorize companies as pure play, category-focused, industry-focused, and diversified; it is quantitatively analyzed to categorize companies as dominant, leading, strong, tentative, and weak.

Research Analyst Overview

Laboratory automation technology is revolutionizing the way scientific research and diagnostic processes are carried out in various industries. Automated instruments play a significant role in process automation, particularly in clinical laboratories, where productivity, safe working conditions, reliable results, and cost efficiency are crucial. Miniaturization of laboratory equipment, such as automated systems for liquid handling, data analysis, sample preparation, and immunoassay analysis, have become essential in microbiology, biotechnology, clinical chemistry, and other fields. Automation in laboratories reduces physical strain, repetitiveness, and human intervention, enhancing workflow scope, improving data quality, and reducing time cycles. Government legislation and regulatory requirements have increased the demand for automated systems in healthcare applications, including hospitals, diagnostic laboratories, and forensic laboratories.

Furthermore, the total automation segment of the laboratory automation market is growing due to budget constraints and the need for high volume processing in emerging countries. Customization services cater to the unique laboratory needs of various end users, including healthcare, food safety, and research institutions. Automated workstations, off-the-shelf automated workcells, and robotic systems are transforming laboratories by offering flexibility capabilities, integration, and increased efficiency. Automated liquid handlers, data management, and data analysis systems are critical components of these systems. Sample contamination and automation dependence are key challenges that need to be addressed in the development of integrated systems. Advancements in technology, such as machine learning, Insilico Medicine, and precision medicine development, are driving the market for automated systems in drug discovery, genomics solutions, and proteomics solutions. FDA clearance, wireless connectivity, and robots restocking shelves are some of the emerging trends in the laboratory automation market.

Laboratory automation systems have revolutionized the scientific landscape, particularly in the drug discovery market. These integrated systems leverage the power of the Internet of Things (IoT) to streamline workflows, reduce repetitiveness, and enhance scope. By automating large volumes of sample tests, they save significant time and cost. The development of automation systems has led to time cycle reductions in high-throughput compound screening, including fragment screening, computer modeling, and insilico medicine. These techniques help identify potential therapeutic candidates more efficiently. Maintenance and service costs are minimized due to the precision and durability of these systems. Tables and accessories are designed for efficient dispensing of dead volumes, ensuring accurate results.

Automation systems have become essential in various industries, from lifesaving medical equipment to manufacturing machinery. Their immersive experience offers a competitive edge, enabling scientists to focus on innovation rather than manual labor. Key market trends include the integration of automation in drug discovery processes, such as high-throughput compound screening, which saves effort and improves data quality. The future of laboratory automation lies in its ability to continue driving advancements in research and development.

Market Scope

Report Coverage

Details

Page number

172

Base year

2023

Historic period

2018-2022

Forecast period

2024-2028

Growth momentum & CAGR

Accelerate at a CAGR of 8.68%

Market growth 2024-2028

USD 2.01 billion

Market structure

Fragmented

YoY growth 2023-2024(%)

8.26

Key countries

US, Germany, UK, China, and Japan

Competitive landscape

Leading Companies, Market Positioning of Companies, Competitive Strategies, and Industry Risks

Request Free Sample

What are the Key Data Covered in this Market Research and Growth Report?

  • CAGR of the market during the forecast period
  • Detailed information on factors that will drive the market growth and forecasting between 2024 and 2028
  • Precise estimation of the size of the market  and its contribution of the market in focus to the parent market
  • Accurate predictions about upcoming market growth and trends and changes in consumer behaviour
  • Growth of the market across North America, Europe, Asia, and Rest of World (ROW)
  • Thorough analysis of the market's competitive landscape and detailed information about companies
  • Comprehensive analysis of factors that will challenge the growth of market companies

We can help! Our analysts can customize this market research report to meet your requirements. Get in touch

1 Executive Summary

  • 1.1 Market overview
    • Exhibit 01: Executive Summary – Chart on Market Overview
    • Exhibit 02: Executive Summary – Data Table on Market Overview
    • Exhibit 03: Executive Summary – Chart on Global Market Characteristics
    • Exhibit 04: Executive Summary – Chart on Market by Geography
    • Exhibit 05: Executive Summary – Chart on Market Segmentation by End-user
    • Exhibit 06: Executive Summary – Chart on Market Segmentation by Type
    • Exhibit 07: Executive Summary – Chart on Incremental Growth
    • Exhibit 08: Executive Summary – Data Table on Incremental Growth
    • Exhibit 09: Executive Summary – Chart on Vendor Market Positioning

2 Market Landscape

  • 2.1 Market ecosystem
    • Exhibit 10: Parent market
    • Exhibit 11: Market Characteristics

3 Market Sizing

  • 3.1 Market definition
    • Exhibit 12: Offerings of vendors included in the market definition
  • 3.2 Market segment analysis
    • Exhibit 13: Market segments
  • 3.3 Market size 2023
    • 3.4 Market outlook: Forecast for 2023-2028
      • Exhibit 14: Chart on Global - Market size and forecast 2023-2028 ($ billion)
      • Exhibit 15: Data Table on Global - Market size and forecast 2023-2028 ($ billion)
      • Exhibit 16: Chart on Global Market: Year-over-year growth 2023-2028 (%)
      • Exhibit 17: Data Table on Global Market: Year-over-year growth 2023-2028 (%)

    4 Historic Market Size

    • 4.1 Global laboratory automation systems market 2018 - 2022
      • Exhibit 18: Historic Market Size – Data Table on global laboratory automation systems market 2018 - 2022 ($ billion)
    • 4.2 End-user Segment Analysis 2018 - 2022
      • Exhibit 19: Historic Market Size – End-user Segment 2018 - 2022 ($ billion)
    • 4.3 Type Segment Analysis 2018 - 2022
      • Exhibit 20: Historic Market Size – Type Segment 2018 - 2022 ($ billion)
    • 4.4 Geography Segment Analysis 2018 - 2022
      • Exhibit 21: Historic Market Size – Geography Segment 2018 - 2022 ($ billion)
    • 4.5 Country Segment Analysis 2018 - 2022
      • Exhibit 22: Historic Market Size – Country Segment 2018 - 2022 ($ billion)

    5 Five Forces Analysis

    • 5.1 Five forces summary
      • Exhibit 23: Five forces analysis - Comparison between 2023 and 2028
    • 5.2 Bargaining power of buyers
      • Exhibit 24: Chart on Bargaining power of buyers – Impact of key factors 2023 and 2028
    • 5.3 Bargaining power of suppliers
      • Exhibit 25: Bargaining power of suppliers – Impact of key factors in 2023 and 2028
    • 5.4 Threat of new entrants
      • Exhibit 26: Threat of new entrants – Impact of key factors in 2023 and 2028
    • 5.5 Threat of substitutes
      • Exhibit 27: Threat of substitutes – Impact of key factors in 2023 and 2028
    • 5.6 Threat of rivalry
      • Exhibit 28: Threat of rivalry – Impact of key factors in 2023 and 2028
    • 5.7 Market condition
      • Exhibit 29: Chart on Market condition - Five forces 2023 and 2028

    6 Market Segmentation by End-user

    • 6.1 Market segments
      • Exhibit 30: Chart on End-user - Market share 2023-2028 (%)
      • Exhibit 31: Data Table on End-user - Market share 2023-2028 (%)
    • 6.2 Comparison by End-user
      • Exhibit 32: Chart on Comparison by End-user
      • Exhibit 33: Data Table on Comparison by End-user
    • 6.3 Pharmaceutical and biotechnology companies - Market size and forecast 2023-2028
      • Exhibit 34: Chart on Pharmaceutical and biotechnology companies - Market size and forecast 2023-2028 ($ billion)
      • Exhibit 35: Data Table on Pharmaceutical and biotechnology companies - Market size and forecast 2023-2028 ($ billion)
      • Exhibit 36: Chart on Pharmaceutical and biotechnology companies - Year-over-year growth 2023-2028 (%)
      • Exhibit 37: Data Table on Pharmaceutical and biotechnology companies - Year-over-year growth 2023-2028 (%)
    • 6.4 Clinical and reference laboratories - Market size and forecast 2023-2028
      • Exhibit 38: Chart on Clinical and reference laboratories - Market size and forecast 2023-2028 ($ billion)
      • Exhibit 39: Data Table on Clinical and reference laboratories - Market size and forecast 2023-2028 ($ billion)
      • Exhibit 40: Chart on Clinical and reference laboratories - Year-over-year growth 2023-2028 (%)
      • Exhibit 41: Data Table on Clinical and reference laboratories - Year-over-year growth 2023-2028 (%)
    • 6.5 Academic institutions and research organizations - Market size and forecast 2023-2028
      • Exhibit 42: Chart on Academic institutions and research organizations - Market size and forecast 2023-2028 ($ billion)
      • Exhibit 43: Data Table on Academic institutions and research organizations - Market size and forecast 2023-2028 ($ billion)
      • Exhibit 44: Chart on Academic institutions and research organizations - Year-over-year growth 2023-2028 (%)
      • Exhibit 45: Data Table on Academic institutions and research organizations - Year-over-year growth 2023-2028 (%)
    • 6.6 Others - Market size and forecast 2023-2028
      • Exhibit 46: Chart on Others - Market size and forecast 2023-2028 ($ billion)
      • Exhibit 47: Data Table on Others - Market size and forecast 2023-2028 ($ billion)
      • Exhibit 48: Chart on Others - Year-over-year growth 2023-2028 (%)
      • Exhibit 49: Data Table on Others - Year-over-year growth 2023-2028 (%)
    • 6.7 Market opportunity by End-user
      • Exhibit 50: Market opportunity by End-user ($ billion)
      • Exhibit 51: Data Table on Market opportunity by End-user ($ billion)

    7 Market Segmentation by Type

    • 7.1 Market segments
      • Exhibit 52: Chart on Type - Market share 2023-2028 (%)
      • Exhibit 53: Data Table on Type - Market share 2023-2028 (%)
    • 7.2 Comparison by Type
      • Exhibit 54: Chart on Comparison by Type
      • Exhibit 55: Data Table on Comparison by Type
    • 7.3 Equipment - Market size and forecast 2023-2028
      • Exhibit 56: Chart on Equipment - Market size and forecast 2023-2028 ($ billion)
      • Exhibit 57: Data Table on Equipment - Market size and forecast 2023-2028 ($ billion)
      • Exhibit 58: Chart on Equipment - Year-over-year growth 2023-2028 (%)
      • Exhibit 59: Data Table on Equipment - Year-over-year growth 2023-2028 (%)
    • 7.4 Software and services - Market size and forecast 2023-2028
      • Exhibit 60: Chart on Software and services - Market size and forecast 2023-2028 ($ billion)
      • Exhibit 61: Data Table on Software and services - Market size and forecast 2023-2028 ($ billion)
      • Exhibit 62: Chart on Software and services - Year-over-year growth 2023-2028 (%)
      • Exhibit 63: Data Table on Software and services - Year-over-year growth 2023-2028 (%)
    • 7.5 Market opportunity by Type
      • Exhibit 64: Market opportunity by Type ($ billion)
      • Exhibit 65: Data Table on Market opportunity by Type ($ billion)

    8 Customer Landscape

    • 8.1 Customer landscape overview
      • Exhibit 66: Analysis of price sensitivity, lifecycle, customer purchase basket, adoption rates, and purchase criteria

    9 Geographic Landscape

    • 9.1 Geographic segmentation
      • Exhibit 67: Chart on Market share by geography 2023-2028 (%)
      • Exhibit 68: Data Table on Market share by geography 2023-2028 (%)
    • 9.2 Geographic comparison
      • Exhibit 69: Chart on Geographic comparison
      • Exhibit 70: Data Table on Geographic comparison
    • 9.3 North America - Market size and forecast 2023-2028
      • Exhibit 71: Chart on North America - Market size and forecast 2023-2028 ($ billion)
      • Exhibit 72: Data Table on North America - Market size and forecast 2023-2028 ($ billion)
      • Exhibit 73: Chart on North America - Year-over-year growth 2023-2028 (%)
      • Exhibit 74: Data Table on North America - Year-over-year growth 2023-2028 (%)
    • 9.4 Europe - Market size and forecast 2023-2028
      • Exhibit 75: Chart on Europe - Market size and forecast 2023-2028 ($ billion)
      • Exhibit 76: Data Table on Europe - Market size and forecast 2023-2028 ($ billion)
      • Exhibit 77: Chart on Europe - Year-over-year growth 2023-2028 (%)
      • Exhibit 78: Data Table on Europe - Year-over-year growth 2023-2028 (%)
    • 9.5 Asia - Market size and forecast 2023-2028
      • Exhibit 79: Chart on Asia - Market size and forecast 2023-2028 ($ billion)
      • Exhibit 80: Data Table on Asia - Market size and forecast 2023-2028 ($ billion)
      • Exhibit 81: Chart on Asia - Year-over-year growth 2023-2028 (%)
      • Exhibit 82: Data Table on Asia - Year-over-year growth 2023-2028 (%)
    • 9.6 Rest of World (ROW) - Market size and forecast 2023-2028
      • Exhibit 83: Chart on Rest of World (ROW) - Market size and forecast 2023-2028 ($ billion)
      • Exhibit 84: Data Table on Rest of World (ROW) - Market size and forecast 2023-2028 ($ billion)
      • Exhibit 85: Chart on Rest of World (ROW) - Year-over-year growth 2023-2028 (%)
      • Exhibit 86: Data Table on Rest of World (ROW) - Year-over-year growth 2023-2028 (%)
    • 9.7 US - Market size and forecast 2023-2028
      • Exhibit 87: Chart on US - Market size and forecast 2023-2028 ($ billion)
      • Exhibit 88: Data Table on US - Market size and forecast 2023-2028 ($ billion)
      • Exhibit 89: Chart on US - Year-over-year growth 2023-2028 (%)
      • Exhibit 90: Data Table on US - Year-over-year growth 2023-2028 (%)
    • 9.8 Germany - Market size and forecast 2023-2028
      • Exhibit 91: Chart on Germany - Market size and forecast 2023-2028 ($ billion)
      • Exhibit 92: Data Table on Germany - Market size and forecast 2023-2028 ($ billion)
      • Exhibit 93: Chart on Germany - Year-over-year growth 2023-2028 (%)
      • Exhibit 94: Data Table on Germany - Year-over-year growth 2023-2028 (%)
    • 9.9 UK - Market size and forecast 2023-2028
      • Exhibit 95: Chart on UK - Market size and forecast 2023-2028 ($ billion)
      • Exhibit 96: Data Table on UK - Market size and forecast 2023-2028 ($ billion)
      • Exhibit 97: Chart on UK - Year-over-year growth 2023-2028 (%)
      • Exhibit 98: Data Table on UK - Year-over-year growth 2023-2028 (%)
    • 9.10 China - Market size and forecast 2023-2028
      • Exhibit 99: Chart on China - Market size and forecast 2023-2028 ($ billion)
      • Exhibit 100: Data Table on China - Market size and forecast 2023-2028 ($ billion)
      • Exhibit 101: Chart on China - Year-over-year growth 2023-2028 (%)
      • Exhibit 102: Data Table on China - Year-over-year growth 2023-2028 (%)
    • 9.11 Japan - Market size and forecast 2023-2028
      • Exhibit 103: Chart on Japan - Market size and forecast 2023-2028 ($ billion)
      • Exhibit 104: Data Table on Japan - Market size and forecast 2023-2028 ($ billion)
      • Exhibit 105: Chart on Japan - Year-over-year growth 2023-2028 (%)
      • Exhibit 106: Data Table on Japan - Year-over-year growth 2023-2028 (%)
    • 9.12 Market opportunity by geography
      • Exhibit 107: Market opportunity by geography ($ billion)
      • Exhibit 108: Data Tables on Market opportunity by geography ($ billion)

    10 Drivers, Challenges, and Trends

    • 10.1 Market drivers
      • 10.2 Market challenges
        • 10.3 Impact of drivers and challenges
          • Exhibit 109: Impact of drivers and challenges in 2023 and 2028
        • 10.4 Market trends

          11 Vendor Landscape

          • 11.1 Overview
            • 11.2 Vendor landscape
              • Exhibit 110: Overview on Criticality of inputs and Factors of differentiation
            • 11.3 Landscape disruption
              • Exhibit 111: Overview on factors of disruption
            • 11.4 Industry risks
              • Exhibit 112: Impact of key risks on business

            12 Vendor Analysis

            • 12.1 Vendors covered
              • Exhibit 113: Vendors covered
            • 12.2 Market positioning of vendors
              • Exhibit 114: Matrix on vendor position and classification
            • 12.3 Abbott Laboratories
              • Exhibit 115: Abbott Laboratories - Overview
              • Exhibit 116: Abbott Laboratories - Business segments
              • Exhibit 117: Abbott Laboratories - Key news
              • Exhibit 118: Abbott Laboratories - Key offerings
              • Exhibit 119: Abbott Laboratories - Segment focus
            • 12.4 Agilent Technologies Inc.
              • Exhibit 120: Agilent Technologies Inc. - Overview
              • Exhibit 121: Agilent Technologies Inc. - Business segments
              • Exhibit 122: Agilent Technologies Inc. - Key offerings
              • Exhibit 123: Agilent Technologies Inc. - Segment focus
            • 12.5 Bee Robotics Ltd.
              • Exhibit 124: Bee Robotics Ltd. - Overview
              • Exhibit 125: Bee Robotics Ltd. - Key offerings
            • 12.6 Eppendorf SE
              • Exhibit 126: Eppendorf SE - Overview
              • Exhibit 127: Eppendorf SE - Product / Service
              • Exhibit 128: Eppendorf SE - Key news
              • Exhibit 129: Eppendorf SE - Key offerings
            • 12.7 Gilson Inc.
              • Exhibit 130: Gilson Inc. - Overview
              • Exhibit 131: Gilson Inc. - Product / Service
              • Exhibit 132: Gilson Inc. - Key offerings
            • 12.8 LabVantage Solutions Inc.
              • Exhibit 133: LabVantage Solutions Inc. - Overview
              • Exhibit 134: LabVantage Solutions Inc. - Product / Service
              • Exhibit 135: LabVantage Solutions Inc. - Key offerings
            • 12.9 LabWare Inc.
              • Exhibit 136: LabWare Inc. - Overview
              • Exhibit 137: LabWare Inc. - Product / Service
              • Exhibit 138: LabWare Inc. - Key offerings
            • 12.10 Olympus Corp.
              • Exhibit 139: Olympus Corp. - Overview
              • Exhibit 140: Olympus Corp. - Business segments
              • Exhibit 141: Olympus Corp. - Key news
              • Exhibit 142: Olympus Corp. - Key offerings
              • Exhibit 143: Olympus Corp. - Segment focus
            • 12.11 PerkinElmer Inc
              • Exhibit 144: PerkinElmer Inc - Overview
              • Exhibit 145: PerkinElmer Inc - Business segments
              • Exhibit 146: PerkinElmer Inc - Key news
              • Exhibit 147: PerkinElmer Inc - Key offerings
              • Exhibit 148: PerkinElmer Inc - Segment focus
            • 12.12 QIAGEN NV
              • Exhibit 149: QIAGEN NV - Overview
              • Exhibit 150: QIAGEN NV - Product / Service
              • Exhibit 151: QIAGEN NV - Key news
              • Exhibit 152: QIAGEN NV - Key offerings
            • 12.13 SCINOMIX
              • Exhibit 153: SCINOMIX - Overview
              • Exhibit 154: SCINOMIX - Product / Service
              • Exhibit 155: SCINOMIX - Key offerings
            • 12.14 Siemens AG
              • Exhibit 156: Siemens AG - Overview
              • Exhibit 157: Siemens AG - Business segments
              • Exhibit 158: Siemens AG - Key news
              • Exhibit 159: Siemens AG - Key offerings
              • Exhibit 160: Siemens AG - Segment focus
            • 12.15 SPT Labtech Ltd.
              • Exhibit 161: SPT Labtech Ltd. - Overview
              • Exhibit 162: SPT Labtech Ltd. - Product / Service
              • Exhibit 163: SPT Labtech Ltd. - Key offerings
            • 12.16 Tecan Trading AG
              • Exhibit 164: Tecan Trading AG - Overview
              • Exhibit 165: Tecan Trading AG - Business segments
              • Exhibit 166: Tecan Trading AG - Key offerings
              • Exhibit 167: Tecan Trading AG - Segment focus
            • 12.17 Thermo Fisher Scientific Inc.
              • Exhibit 168: Thermo Fisher Scientific Inc. - Overview
              • Exhibit 169: Thermo Fisher Scientific Inc. - Business segments
              • Exhibit 170: Thermo Fisher Scientific Inc. - Key news
              • Exhibit 171: Thermo Fisher Scientific Inc. - Key offerings
              • Exhibit 172: Thermo Fisher Scientific Inc. - Segment focus

            13 Appendix

            • 13.1 Scope of the report
              • 13.2 Inclusions and exclusions checklist
                • Exhibit 173: Inclusions checklist
                • Exhibit 174: Exclusions checklist
              • 13.3 Currency conversion rates for US$
                • Exhibit 175: Currency conversion rates for US$
              • 13.4 Research methodology
                • Exhibit 176: Research methodology
                • Exhibit 177: Validation techniques employed for market sizing
                • Exhibit 178: Information sources
              • 13.5 List of abbreviations
                • Exhibit 179: List of abbreviations

              Research Methodology

              Technavio presents a detailed picture of the market by way of study, synthesis, and summation of data from multiple sources. The analysts have presented the various facets of the market with a particular focus on identifying the key industry influencers. The data thus presented is comprehensive, reliable, and the result of extensive research, both primary and secondary.

              INFORMATION SOURCES

              Primary sources

              • Manufacturers and suppliers
              • Channel partners
              • Industry experts
              • Strategic decision makers

              Secondary sources

              • Industry journals and periodicals
              • Government data
              • Financial reports of key industry players
              • Historical data
              • Press releases

              DATA ANALYSIS

              Data Synthesis

              • Collation of data
              • Estimation of key figures
              • Analysis of derived insights

              Data Validation

              • Triangulation with data models
              • Reference against proprietary databases
              • Corroboration with industry experts

              REPORT WRITING

              Qualitative

              • Market drivers
              • Market challenges
              • Market trends
              • Five forces analysis

              Quantitative

              • Market size and forecast
              • Market segmentation
              • Geographical insights
              • Competitive landscape

              Interested in this report?

              Get your sample now to see our research methodology and insights!

              Download Now

              Frequently Asked Questions

              Laboratory Automation Systems market growth will increase by $ 2.01 bn during 2024-2028 .

              The Laboratory Automation Systems market is expected to grow at a CAGR of 8.68% during 2024-2028 .

              Laboratory Automation Systems market is segmented by End-user( Pharmaceutical and biotechnology companies, Clinical and reference laboratories, Academic institutions and research organizations, Others) Type( Equipment, Software, services, ROW)

              Abbott Laboratories, Agilent Technologies Inc., Becton Dickinson and Co., Bee Robotics Ltd., Biosero Inc., Cognex Corp., Eppendorf SE, F. Hoffmann La Roche Ltd., Gilson Inc., LabVantage Solutions Inc., LabWare Inc., Olympus Corp., PerkinElmer Inc, QIAGEN NV, SCINOMIX, Siemens AG, SPT Labtech Ltd., Tecan Trading AG, Thermo Fisher Scientific Inc. are a few of the key vendors in the Laboratory Automation Systems market.

              North America will register the highest growth rate of 42% among the other regions. Therefore, the Laboratory Automation Systems market in North America is expected to garner significant business opportunities for the vendors during the forecast period.

              US, Germany, UK, China, Japan

              • Increasing demand for laboratory automation software servicesVendors have started offering software as an additional service with their laboratory automation systems to maintain customer loyalty and ensure quality results. These software services are equipped with an intuitive and flexible user interface is the driving factor this market.
              • which enables the analysis of data sample. These software services resemble the manual plating procedure. Apart from being compliant with regulatory recommendations such as the Certificates of Analysis (COA) and the Certificates of Conformance (COC) is the driving factor this market.
              • these software services can be altered according to the needs of end-users. For instance is the driving factor this market.
              • Thermo Fisher Scientific Inc. s Versette ControlMate Software can create and run pipetting programs for complex pipetting sequences such as plate reformatting is the driving factor this market.
              • serial dilutions or immunoaffinity sample preparations with mass spectrometric immunoassay (MSIA) pipette tips. It can conduct simple operations with basic commands or complex protocols with an extended command list. It is equipped with a wide labware library and precise controlling options for liquid handling applications. It is versatile and can run on different platforms such as Windows XP is the driving factor this market.
              • Windows Vista is the driving factor this market.
              • and Windows 7. Thus is the driving factor this market.
              • such software services have been designed specifically for life sciences research and enhance the drug discovery process. Additionally is the driving factor this market.
              • these programs support real-time analysis and save and send the data in several common file formats. They have built-in calculations for data analysis and help save time and generate high-quality results is the driving factor this market.
              • thereby driving the growth of the global laboratory automation systems market during the forecast period. is the driving factor this market.

              The Laboratory Automation Systems market vendors should focus on grabbing business opportunities from the Pharmaceutical and biotechnology companies segment as it accounted for the largest market share in the base year.