
Medical Publishing Market Size 2025-2029
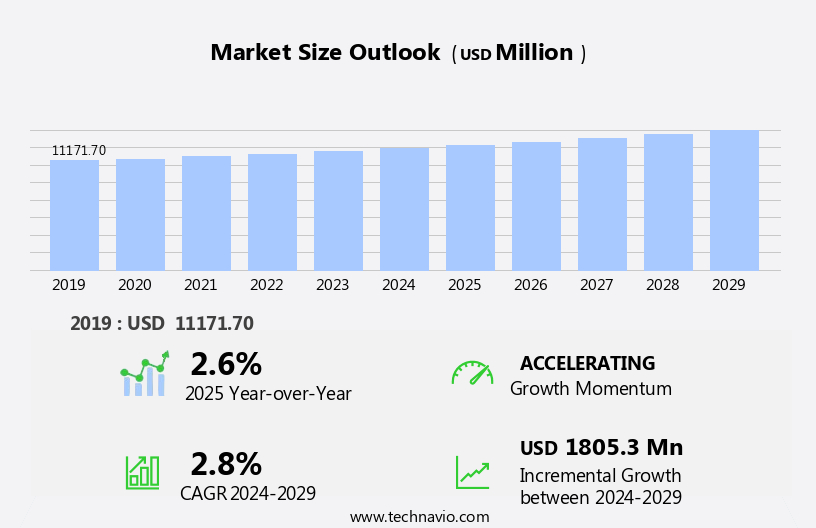
The medical publishing market size is forecast to increase by USD 1.81 billion, at a CAGR of 2.8% between 2024 and 2029.
- The market is experiencing significant shifts, with the rise of digital publishing being a key driver. Traditional print media is increasingly being replaced by electronic formats, offering advantages such as accessibility, convenience, and cost savings. This trend is further accentuated by the transition towards Open Access (OA) publication models, which allow free online access to scholarly research. However, the market faces challenges as well. The high subscription costs of electronic and print media pose a significant barrier for many stakeholders, including institutions, researchers, and individual subscribers.
- Additionally, the increasing volume of published research and the need for timely and accurate information necessitate efficient methods for information discovery and management. Companies seeking to capitalize on market opportunities and navigate these challenges effectively must focus on delivering affordable, accessible, and high-quality medical content through innovative digital solutions. These costs can limit access to critical medical information and hinder the advancement of research and patient care.
Major Market Trends & Insights
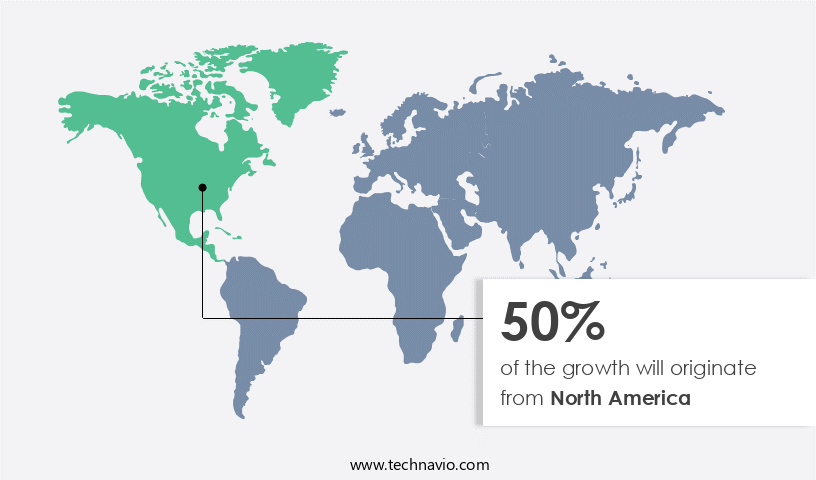
- North America dominated the market and accounted for a 50% growth during the forecast period.
- The market is expected to grow significantly in Europe as well over the forecast period.
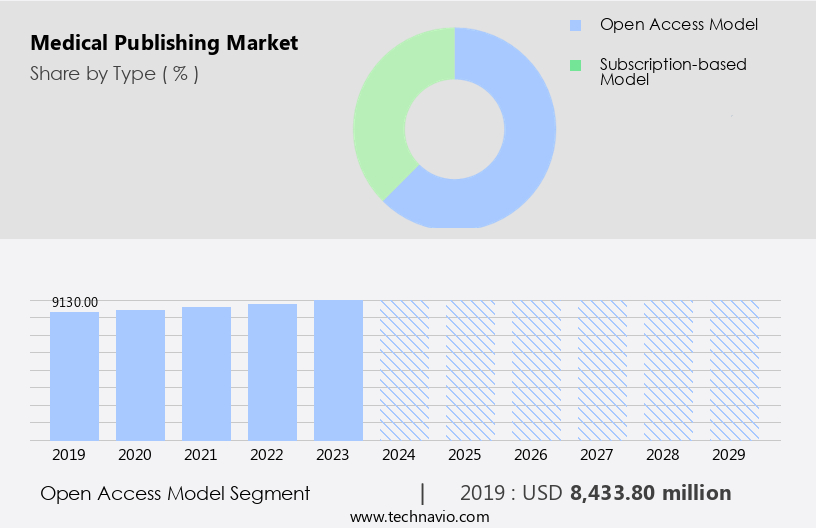
- By the Type, the Open access model sub-segment was valued at USD 8.43 billion in 2023
- By the Product, the Journals sub-segment accounted for the largest market revenue share in 2023
Market Size & Forecast
- Market Opportunities: USD 27.09 billion
- Future Opportunities: USD 1.81 billion
- CAGR : 2.8%
- North America: Largest market in 2023
What will be the Size of the Medical Publishing Market during the forecast period?
Get Key Insights on Market Forecast (PDF) Request Free Sample
- The market continues to evolve, driven by advancements in technology and the growing demand for accessible and high-quality research. Pre-print servers and post-print servers are increasingly integrated into the publishing process, enabling faster dissemination of research articles. Author self-archiving policies and manuscript tracking systems facilitate efficient manuscript submission and review. The peer review process remains a cornerstone of publishing, with impact factor calculation and citation analysis metrics shaping research priorities. Crossref integration and ORCID integration streamline reference linking and author identification. Scholarly communication is further enhanced by editorial workflow management, publication ethics guidelines, and semantic enrichment techniques. Digital content delivery through online publishing platforms and open access publishing has gained significant traction, with bibliographic databases and citation management tools supporting information retrieval and analysis.
- Journal management software, metadata schema implementation, and data visualization techniques ensure high-quality and accessible content. An example of the market's continuous dynamism is the increase in article processing charges, which have risen by 10% annually in recent years. This trend reflects the shifting business model towards open access publishing and the need for sustainable revenue streams. The medical publishing industry is expected to grow by 5% per annum, driven by these evolving trends and the ongoing demand for reliable and accessible research. Artificial intelligence (AI) and machine learning (ML) technologies play a pivotal role in enhancing digital asset security, image recognition, content moderation, and object recognition.
How is this Medical Publishing Industry segmented?
The medical publishing industry research report provides comprehensive data (region-wise segment analysis), with forecasts and estimates in "USD million" for the period 2025-2029, as well as historical data from 2019-2023 for the following segments.
- Type
- Open access model
- Subscription-based model
- Product
- Journals
- E-books
- Print books
- Platform
- Digital
- Geography
- North America
- US
- Canada
- Europe
- France
- Germany
- Italy
- Spain
- UK
- APAC
- China
- Japan
- South America
- Brazil
- Rest of World (ROW)
- North America
By Type Insights
The Open access model segment is estimated to witness significant growth during the forecast period. Open access is a publishing model that makes research information available to readers free of cost, unlike the traditional subscription model, in which readers have access to scholarly information by paying a subscription or fee. The open-access model includes research that is digital, free to access, and free from most of the copyright and licensing restrictions found in traditional journal publishing. In the open access model, there are no financial, legal, or technical barriers to accessing the content, and thus, anyone can read, download, copy, distribute, print, search for, and search within the information or use it in educational paper or in any other way within the legal agreements. The open-access model increases the visibility and reuse of academic research results.
The subscription-based business model is a type of recurring payment structure model in which the user pays a fee on a monthly or yearly basis or for a predefined interval of time for products and services received. The subscription-based model adds value for customers, enhances their experience, and ensures a strong and long-term relationship between the service provider and consumer. This subscription model is more affordable, accessible, convenient, and transparent than the traditional pay-per-service model. It provides customers with the opportunity of opting for or opting out of the service at any time. If the customer is unsatisfied with the service, he can opt out of the service provider and go to another better service provider. Healthcare service providers can use the information for improved treatment and care to patients by publishing the results of clinical trials and medical research.
Assess Regional and Segment opportunities- Request Free Sample
The Open access model segment was valued at USD 8.43 billion in 2019 and showed a gradual increase during the forecast period.
Impact factor calculation, crossref integration, and manuscript tracking systems are essential components of the peer review process, ensuring the quality and integrity of published research. Semantic enrichment techniques and data visualization methods enhance the discoverability and understanding of research data. Citation management tools and publishing analytics dashboards enable researchers to efficiently manage their references and analyze citation trends. ORCID integration streamlines author identification and attribution. Interactive supplementary materials and journal management software further enhance the research experience. Technology-driven tools such as publishing analytics dashboard, editorial decision support systems, author services platform, data analytics for publishing, interactive figures and tables, version control system, plagiarism detection software, open access repository services, and marketing automation platform optimize efficiency and impact.
The Medical Publishing Market is evolving rapidly with the adoption of advanced online publishing platform solutions that integrate online publishing platform features to enhance accessibility and reach. Key processes such as author rights and permissions, copyright transfer agreement process, and compliance and risk management ensure legal and ethical publishing standards. Services like typesetting and composition, proofreading and editing services, and XML based publishing workflows streamline publication. Operational support includes subscription management systems, print on demand services, and print on demand production workflow, alongside indexing and abstracting services, online supplementary data, pre-print server integration, and post-print server integration.
Regional Analysis
North America is estimated to contribute 50% to the growth of the global market during the forecast period. Technavio's analysts have elaborately explained the regional trends and drivers that shape the market during the forecast period.
See How medical publishing market Demand is Rising in North America Request Free Sample
In the dynamic market, various entities play integral roles in facilitating the dissemination of research and ensuring scholarly communication's integrity. Pre-print and post-print servers enable swift article dissemination, while manuscript tracking systems and peer review processes maintain quality. Author self-archiving policies and crossref integration expand accessibility. Impact factor calculation and citation analysis metrics measure research significance. Semantic enrichment techniques and data visualization enhance understanding. Scholarly communication tools, such as citation management and publishing analytics dashboards, streamline research. Open access publishing and bibliographic databases broaden access. The North American region, particularly the US, leads clinical trials and research due to the need for advanced healthcare systems and the availability of patient data.
With increasing disease prevalence worldwide, substantial investments in medical research and trials are driving a rise in publications. The US government's commitment to funding health programs, including the Centers for Disease Control and Prevention (CDC), the National Institutes of Health (NIH), and the US Department of Health and Human Services, further bolsters this trend. As a result, over 50% of global biomedical research publications originate from North America. These investments and publications underscore the market's continuous evolution, emphasizing the importance of editorial workflow management, metadata schema implementation, and journal management software. Publishers are also investing in advanced technologies, such as artificial intelligence and virtual reality, to enhance the reader experience and differentiate themselves from competitors.
Market Dynamics
Our researchers analyzed the data with 2024 as the base year, along with the key drivers, trends, and challenges. A holistic analysis of drivers will help companies refine their marketing strategies to gain a competitive advantage. The market is a dynamic and evolving industry, driven by the constant need for new research and knowledge in the healthcare sector. Editorial workflow optimization strategies are essential for publishers to streamline the publishing process and ensure high-quality output. Impact factor calculation methodologies continue to shape the assessment of journal prestige, with online publishing platforms featuring advanced analytics and reporting tools to facilitate this. Open access publishing models have disrupted traditional subscription-based models, offering greater accessibility to research and shifting author rights and responsibilities.
Copyright transfer agreement processes must adapt to these changes, while journal management software functionalities enable efficient handling of manuscripts and peer review. Citation analysis for research articles plays a crucial role in measuring the impact and influence of scholarly publications. Metadata schema for scholarly publications and semantic enrichment of journal content enhance discoverability and facilitate data mining. Digital asset management solutions ensure secure storage and access to multimedia content, while publication ethics compliance guidelines maintain the integrity of the publishing process. Peer review process improvements, such as single-blind or double-blind reviews, and manuscript tracking system integration streamline the review process and reduce turnaround times.
Print on demand production workflows and crossref and ORCID integration ensure accurate and timely publication of articles. Bibliographic database indexing and research article dissemination channels expand the reach of publications, while publication metrics reporting tools and subscription management system features provide valuable insights into readership and usage patterns. This shift is influenced by the growing number of social media users and the rising preference for personalized and interactive content.
What are the key market drivers leading to the rise in the adoption of Medical Publishing Industry?
- The rise of digital publishing serves as the primary catalyst for market growth. Digital publishing in the medical sector encompasses the distribution of journals, e-books, and articles via the Internet. This approach offers numerous advantages, including cost reduction, expanded reach, reader analysis, and targeted marketing. Medical publishing companies are embracing digital platforms to deliver online access to their content.
- For instance, the implementation of digital publishing led to a 15% increase in sales for a leading medical publisher. This trend underscores the potential for significant growth in this multi-billion dollar market. Key benefits include the integration of source links, immediate availability of articles, real-time updates, and secure access. The shift towards digital publishing is substantial, with industry growth projected at 10% annually. Content technology, such as artificial intelligence and machine learning, is revolutionizing content creation and optimization, enabling businesses to deliver personalized and relevant content to their audiences.
What are the market trends shaping the Medical Publishing Industry?
- The transition towards an open access (OA) publication model is becoming increasingly prevalent in academic and research communities. It is a significant shift in the dissemination of scholarly information. The Open Access (OA) publishing market has experienced significant growth in the healthcare sector due to the increasing demand for quick and unlimited access to information. Traditional subscription-based publishing models limit access to research publications due to expensive journal subscription fees. This transition is driven by the flexibility and scalability offered by Software-as-a-Service (SaaS) solutions, enabling organizations to efficiently manage their digital assets in a more agile and cost-effective manner.
- For instance, some healthcare organizations have reported a 15% increase in research productivity since implementing OA services. This trend is expected to continue as the benefits of OA, including cost savings and improved access to information, become increasingly apparent. In response, many healthcare service providers have adopted OA services to support medical research, leading to increased efficiency and effectiveness in the field. According to market research, the OA publishing market is projected to expand by over 10% in the coming years. Sentiment analysis and text analytics from social media platforms provide valuable insights for businesses, enabling them to understand customer preferences and tailor their content strategy accordingly.
What challenges does the Medical Publishing Industry face during its growth?
- The escalating costs of subscriptions for both electronic and print media represent a significant challenge that could hinder the industry's growth trajectory. The market is primarily driven by revenue from bundled subscriptions sold to library consortia and academic institutions. Initially, the high subscription fees led to substantial revenue generation for publishers. However, this business model has negatively impacted market growth. Library consortia and academic institutions have fixed budgets that have not kept pace with escalating journal prices.
- According to a recent report, approximately 60% of academic libraries have canceled or reduced their subscriptions to journals in the last five years. Despite this challenge, the medical publishing industry is expected to grow at a robust rate, with estimates suggesting a 12% increase in demand for electronic publications over the next five years. As a result, they have resorted to cost-cutting measures such as canceling or not renewing subscriptions. This trend adversely affects authors by limiting the dissemination of their research, and publishers who fail to capture the entire addressable market.
Exclusive Customer Landscape
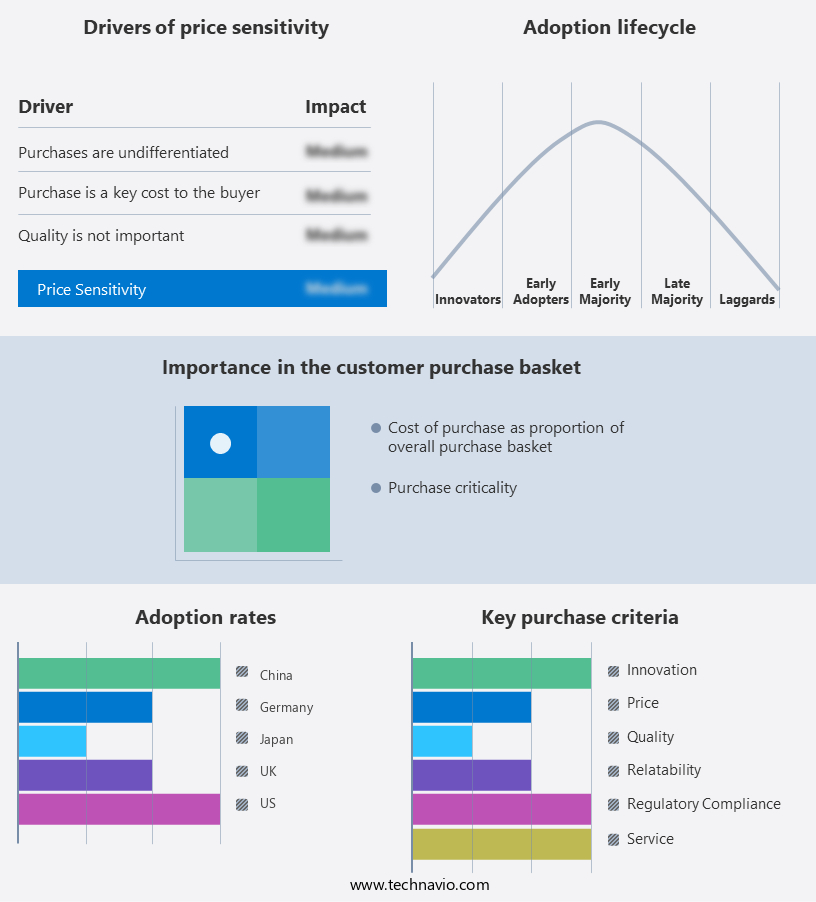
The medical publishing market forecasting report includes the adoption lifecycle of the market, covering from the innovator's stage to the laggard's stage. It focuses on adoption rates in different regions based on penetration. Furthermore, the medical publishing market report also includes key purchase criteria and drivers of price sensitivity to help companies evaluate and develop their market growth analysis strategies.
Customer Landscape
Key Companies & Market Insights
Companies are implementing various strategies, such as strategic alliances, medical publishing market forecast, partnerships, mergers and acquisitions, geographical expansion, and product/service launches, to enhance their presence in the industry.
American Medical Association - The company specializes in medical publishing, providing in-depth insights into the latest advancements in various medical fields.
The industry research and growth report includes detailed analyses of the competitive landscape of the market and information about key companies, including:
- American Medical Association
- Australian Medical Association Ltd.
- BMJ Publishing Group Ltd.
- Charlesworth Publishing Services Ltd.
- Crimson Interactive Pvt. Ltd.
- EBSCO Information Services
- Hearst Communications Inc.
- Informa PLC
- John Wiley and Sons Inc.
- Massachusetts Medical Society
- McGraw Hill LLC
- MDPI
- OMICS International Pvt. Ltd.
- RELX Plc
- Springer Publishing Co.
- Thieme Medical Publishers Inc.
- Wolters Kluwer NV
Qualitative and quantitative analysis of companies has been conducted to help clients understand the wider business environment as well as the strengths and weaknesses of key industry players. Data is qualitatively analyzed to categorize companies as pure play, category-focused, industry-focused, and diversified; it is quantitatively analyzed to categorize companies as dominant, leading, strong, tentative, and weak.
Recent Development and News in Medical Publishing Market
- In January 2024, Elsevier, a leading global information analytics company, announced the acquisition of ClinicalKey, a digital platform for medical professionals, from Thomson Reuters. This strategic move aimed to expand Elsevier's presence in the medical information market and strengthen its offerings for healthcare professionals (Elsevier Press Release, 2024).
- In March 2024, Springer Nature, a renowned scientific, technical, and medical publisher, launched Nature Portfolio's Clinical Research, a new open access journal platform. This initiative marked a significant shift towards open access publishing in the medical research domain (Springer Nature Press Release, 2024).
- In April 2025, Wolters Kluwer, a global leader in healthcare information and point-of-care solutions, announced a partnership with IBM Watson Health to integrate Watson's AI-powered clinical decision support tools into Wolters Kluwer's UpToDate platform. This collaboration aimed to enhance the accuracy and efficiency of clinical decision-making for healthcare professionals (Wolters Kluwer Press Release, 2025).
- In May 2025, PubMed Central (PMC), the free digital archive of biomedical and life sciences literature, reached a significant milestone by surpassing 6 million full-text articles. This expansion underscored the growing importance of open access and digital content in the medical publishing landscape (National Center for Biotechnology Information Press Release, 2025).
Research Analyst Overview
- The market for medical publishing continues to evolve, driven by advances in technology and the increasing demand for high-quality, accessible healthcare information. Content marketing strategies are increasingly being adopted to engage readers and drive sales, with publication metrics analysis providing valuable insights into reader engagement and content performance. The print production process is being supplemented by multimedia content integration, allowing for more dynamic and interactive publications. Article version history and citation tracking tools enable accurate and efficient research, while subscription model optimization and content repurposing strategies help publishers reach wider audiences and maximize revenue.
- Digital rights management and version control systems ensure secure and controlled access to content, while editorial workflow automation and author collaboration tools streamline the publishing process. Sales force automation and fraud detection systems enhance revenue generation and protect against financial losses. Publishing workflow efficiency is a key focus, with reader engagement metrics and production scheduling tools helping to optimize operations. Author communication strategies and digital asset management systems facilitate effective collaboration and content management. Quality control measures and content syndication platforms ensure the dissemination of accurate and reliable information. Marketing automation platforms and reviewer management tools support targeted marketing efforts and efficient review processes, respectively.
- An industry report projects a growth rate of 5% annually over the next five years, reflecting the ongoing dynamism and innovation in the market. For instance, a leading medical publisher saw a 15% increase in sales through the implementation of a comprehensive content marketing strategy and digital asset management system.
Dive into Technavio's robust research methodology, blending expert interviews, extensive data synthesis, and validated models for unparalleled Medical Publishing Market insights. See full methodology.
|
Market Scope |
|
|
Report Coverage |
Details |
|
Page number |
212 |
|
Base year |
2024 |
|
Historic period |
2019-2023 |
|
Forecast period |
2025-2029 |
|
Growth momentum & CAGR |
Accelerate at a CAGR of 2.8% |
|
Market growth 2025-2029 |
USD 1.81 billion |
|
Market structure |
Fragmented |
|
YoY growth 2024-2025(%) |
2.6 |
|
Key countries |
US, China, Canada, Germany, UK, France, Japan, Italy, Spain, and Brazil |
|
Competitive landscape |
Leading Companies, Market Positioning of Companies, Competitive Strategies, and Industry Risks |
What are the Key Data Covered in this Medical Publishing Market Research and Growth Report?
- CAGR of the Medical Publishing industry during the forecast period
- Detailed information on factors that will drive the growth and forecasting between 2025 and 2029
- Precise estimation of the size of the market and its contribution of the industry in focus to the parent market
- Accurate predictions about upcoming growth and trends and changes in consumer behaviour
- Growth of the market across North America, Europe, APAC, South America, and Middle East and Africa
- Thorough analysis of the market's competitive landscape and detailed information about companies
- Comprehensive analysis of factors that will challenge the medical publishing market growth of industry companies
We can help! Our analysts can customize this medical publishing market research report to meet your requirements.
 RIA -
RIA - 
