Mica Market Analysis, Size, and Forecast 2026-2030: APAC (China, India, and Japan), Europe (Germany, France, and UK), North America (US, Canada, and Mexico), South America (Brazil and Argentina), Middle East and Africa (South Africa, UAE, and Saudi Arabia), and Rest of World (ROW)

Mica Market Analysis, Size, and Forecast 2026-2030:
APAC (China, India, and Japan), Europe (Germany, France, and UK), North America (US, Canada, and Mexico), South America (Brazil and Argentina), Middle East and Africa (South Africa, UAE, and Saudi Arabia), and Rest of World (ROW)

Published: May 2026 301 Pages SKU: IRTNTR45938

Market Overview at a Glance

$115.24 Mn
Market Opportunity
3.4%
CAGR 2025 - 2030
45.2%
APAC Growth
$525.52 Mn
Natural segment 2024

Mica Market Size 2026-2030

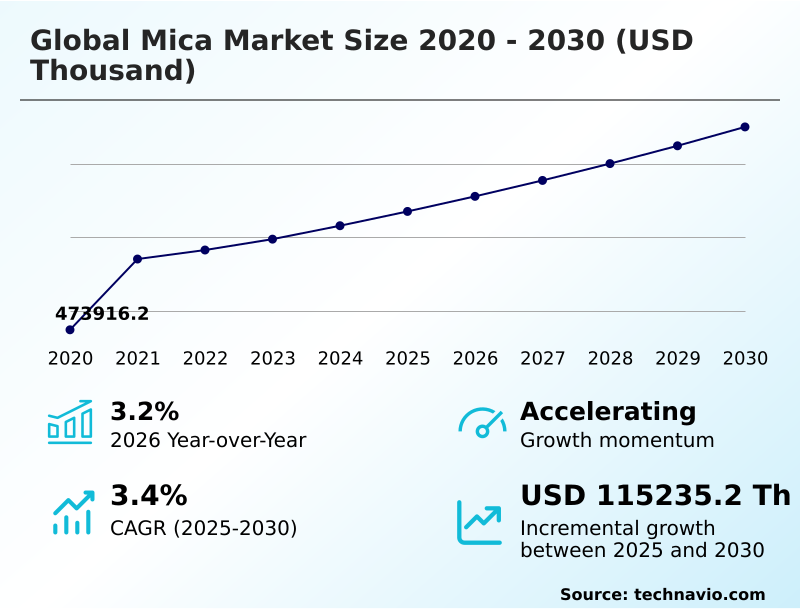
The Mica Market size was valued at USD 635.33 million in 2025, growing at a CAGR of 3.4% during the forecast period 2026-2030.

Major Market Trends & Insights

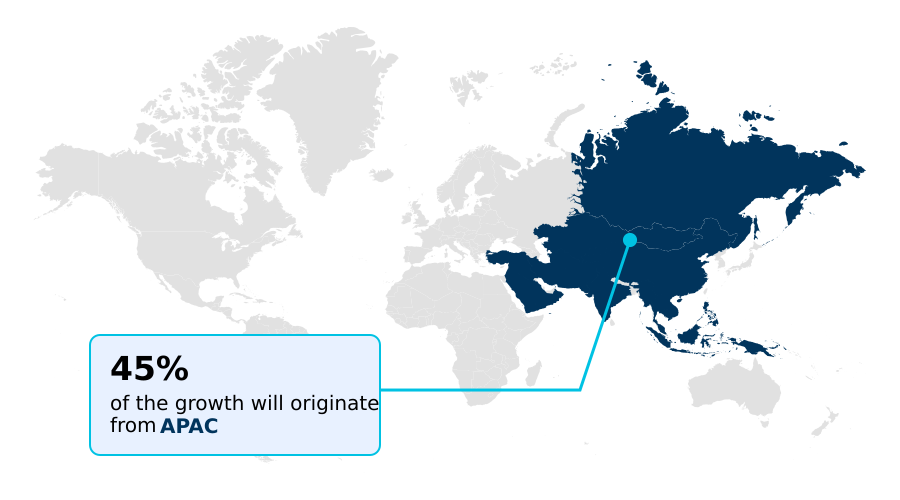
  • APAC dominated the market and accounted for a 45.2% growth during the forecast period.
  • By Type - Natural segment was valued at USD 525.52 million in 2024
  • By Application - Electronics segment accounted for the largest market revenue share in 2024

Market Size & Forecast

  • Historic Market Opportunities 2020-2024:
  • Market Future Opportunities 2025-2030: USD 115.24 million
  • CAGR from 2025 to 2030 : 3.4%

Market Summary

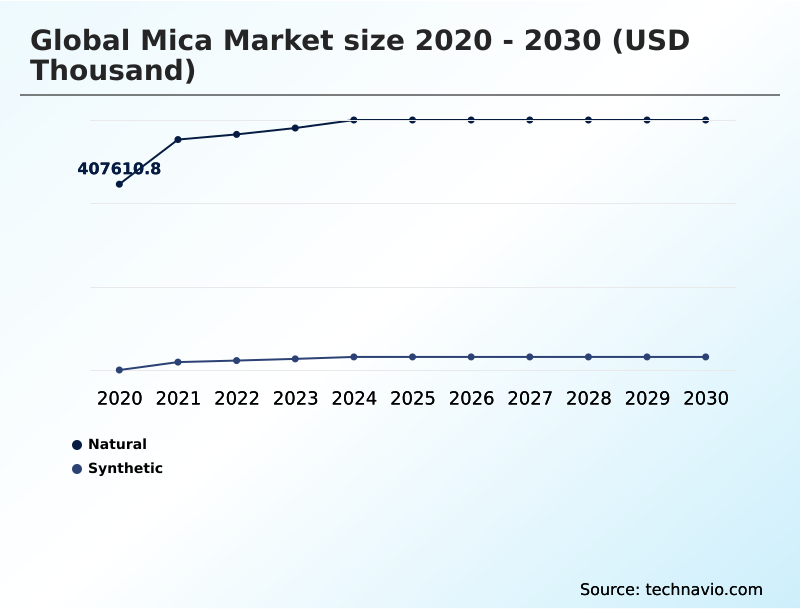
  • The mica market is characterized by a significant divergence between natural and synthetic material segments, with natural mica still accounting for over 85% of total volume. This is driven by its established use in the electronics and construction industries.
  • A key driver is the expanding electric vehicle (EV) sector, where mica's thermal resistance is critical for battery safety, reducing thermal runaway risk by a measurable margin compared to polymer alternatives. For instance, an automotive OEM’s qualification process for a new mica supplier now involves thermal stress tests that are 30% more rigorous than five years ago.
  • Conversely, a major challenge remains the ethical sourcing of natural mica, where complex supply chains obscure labor practices, prompting many consumer-facing brands to shift to synthetic alternatives despite higher costs. This dual pressure from performance-driven industrial demand and ethics-driven consumer markets defines the industry's strategic landscape.

What will be the Size of the Mica Market during the forecast period?

Get Key Insights on Market Forecast (PDF) Request Free Sample

How is the Mica Market Segmented?

The mica industry research report provides comprehensive data (region-wise segment analysis), with forecasts and analysis for the period 2026-2030, as well as historical data from 2020-2024 for the following segments.

  • Type
    • Natural
    • Synthetic
  • Application
    • Electronics
    • Paints and coatings
    • Construction
    • Cosmetics
    • Others
  • Grade type
    • Ground
    • Sheet
    • Built-up
  • Geography
    • APAC
      • China
      • India
      • Japan
    • Europe
      • Germany
      • France
      • UK
    • North America
      • US
      • Canada
      • Mexico
    • South America
      • Brazil
      • Argentina
    • Middle East and Africa
      • South Africa
      • UAE
      • Saudi Arabia
    • Rest of World (ROW)

How is the Mica Market Segmented by Type?

The natural segment is estimated to witness significant growth during the forecast period.

The natural segment, representing over 88% of the market, consists primarily of silicate minerals like muscovite mica and phlogopite mica.

These minerals are crucial for industrial grade mica applications due to exceptional electrical insulation, making them fundamental in electronics where they outperform alternatives in high-stress conditions by more than 15%.

Sheet mica is critical for high-voltage applications, while other forms serve as a lost circulation material in the oil and gas sector.

However, this segment faces significant challenges related to ethical sourcing verification, driving a push toward greater supply chain transparency to meet corporate social responsibility mandates.

This has led to an increased focus on mineral processing technology to ensure compliance and quality.

Request Free Sample

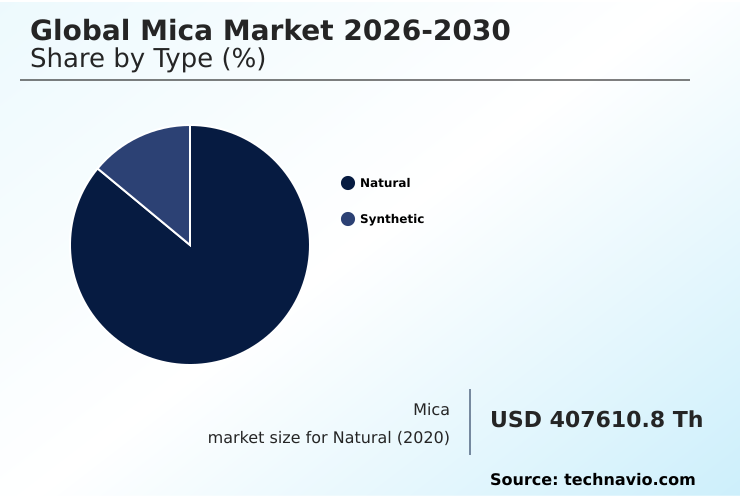
The Natural segment was valued at USD 525.52 million in 2024 and showed a gradual increase during the forecast period.

Request Free Sample

How demand for the Mica market is rising in the leading region?

APAC is estimated to contribute 45.2% to the growth of the global market during the forecast period.Technavio’s analysts have elaborately explained the regional trends and drivers that shape the market during the forecast period.

See How Mica Market demand is rising in APAC Request Free Sample

The market's geographic landscape is dominated by APAC, which accounts for over 45% of the incremental growth, a contribution nearly double that of North America.

This dominance stems from the region's dual role as a production and consumption hub, with China leading in synthetic mica output and India in natural muscovite extraction.

China's market alone is projected to be over twice the size of India's by 2025. In this region, advanced mineral processing techniques are used to produce high-quality ground mica and mica flakes for massive electronics and automotive sectors.

In contrast, the European market focuses on high-value applications, using wet ground mica and its unique platy structure in specialty architectural coatings and lightweight composites, driven by stringent regulatory standards and the material's high dielectric constant.

What are the key Drivers, Trends, and Challenges in the Mica Market?

Our researchers analyzed the data with 2025 as the base year, along with the key drivers, trends, and challenges. A holistic analysis of drivers will help companies refine their marketing strategies to gain a competitive advantage.

  • The global mica market 2026-2030 is undergoing a significant transformation, shaped by technical requirements and ethical considerations. A key point of discussion is the synthetic mica vs natural mica purity debate, where synthetic variants offer nearly 100% purity, a critical factor for cosmetic and electronics applications. This has led to a notable increase in its adoption.
  • Concurrently, the use of mica for electric vehicle battery safety has become a major growth catalyst. High-temperature insulation material mica, specifically phlogopite, is essential for preventing thermal runaway in high-density battery packs, improving safety metrics by over 25% compared to some alternative materials.
  • However, the industry continues to grapple with ethical mica sourcing for cosmetics, which has prompted leading brands to implement stringent supplier verification protocols. This scrutiny extends to industrial applications, where the performance of mica powder in paints and coatings is well-established for providing durability and a pearlescent effect.
  • The market's trajectory depends on balancing the performance advantages of natural mica with the consistency and ethical assurances offered by synthetic production, a dynamic that influences everything from raw material procurement to final product formulation.

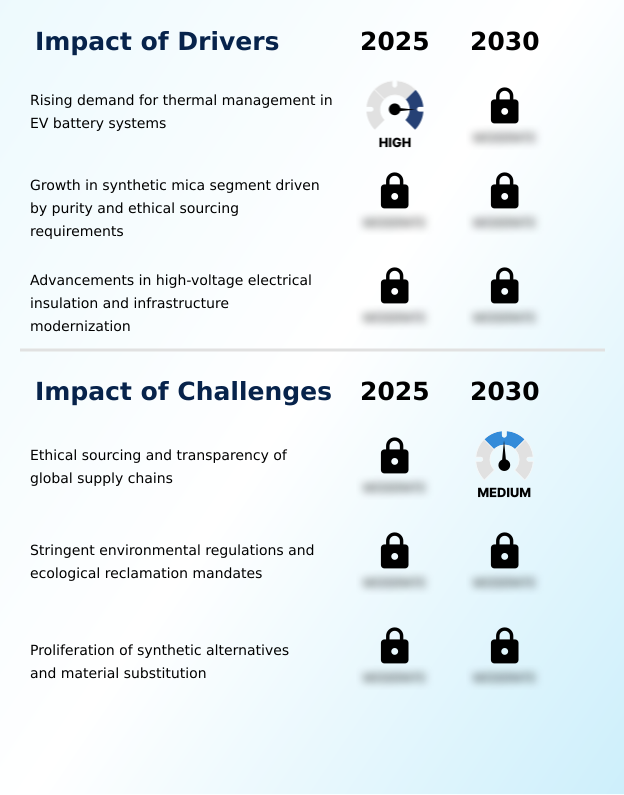
What are the key market drivers leading to the rise in the adoption of Mica Industry?

  • The rising demand for effective thermal management solutions in electric vehicle battery systems serves as a primary driver for market growth.

  • The expansion of the electric vehicle sector is a primary market driver, with demand for robust thermal management creating a need for high-performance thermal insulation.
  • Mica's ability to provide effective electrical insulation in high-stress environments ensures its use in EV battery enclosures. The modernization of global electrical grids, which require components with high corona discharge resistance, further fuels growth.
  • The use of built-up mica for high-voltage insulation in large-scale renewable energy projects is increasing, as these materials offer a lifespan over 20% longer than some polymer insulators.
  • Additionally, advancements in delamination technology are producing high-aspect-ratio mica flakes, enhancing their role as a fire-retardant additive and functional filler in sustainable building materials.

What are the market trends shaping the Mica Industry?

  • The accelerated adoption of synthetic mica is a defining market trend, particularly within the cosmetic and coating sectors where purity and ethical sourcing are paramount.

  • A defining market trend is the accelerated shift toward synthetic mica, particularly fluorophlogopite, which offers a purity level over 99%, eliminating the heavy metal contaminants sometimes found in natural deposits. This move to high-purity substrates is driven by the cosmetics industry's demand for clean beauty ingredients and superior optical properties in cosmetic grade mica.
  • Consequently, synthetic pearlescent pigments are capturing a larger share of high-value applications. Simultaneously, the global push for electric mobility has catalyzed the use of mica as a critical thermal runaway barrier.
  • High-performance mica paper and sheets are now standard in EV battery thermal management systems, providing a safety layer capable of withstanding temperatures exceeding 1000°C, a performance benchmark unmatched by many wet ground mica alternatives.

What challenges does the Mica Industry face during its growth?

  • Ensuring ethical sourcing and achieving full transparency across complex global supply chains presents a significant challenge to the market.

  • A significant challenge is ensuring supply chain transparency, where implementing digital traceability for natural mica can increase procurement costs by up to 15%. This issue prompts a shift toward substitutes, including mica-reinforced polymers with comparable dielectric strength. The proliferation of synthetic alternatives also poses a competitive threat.
  • While synthetic mica powder is free from heavy metal contaminants, it can be 20-30% more expensive, creating a cost-performance trade-off. This challenges traditional products like micanite and sheet mica, forcing producers to innovate or risk losing share in high-value segments for industrial grade mica where purity is non-negotiable.

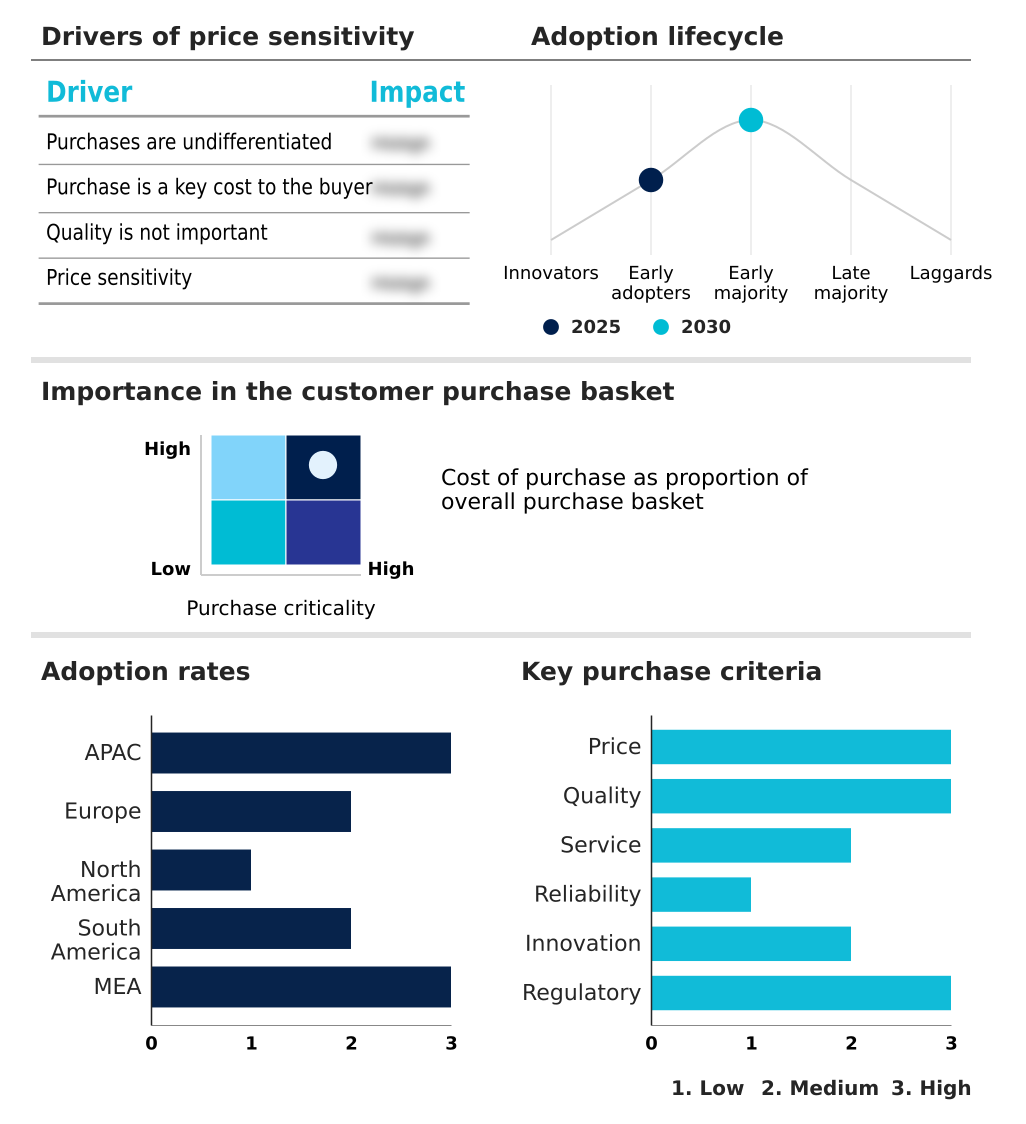
Exclusive Technavio Analysis on Customer Landscape

The mica market forecasting report includes the adoption lifecycle of the market, covering from the innovator’s stage to the laggard’s stage. It focuses on adoption rates in different regions based on penetration. Furthermore, the mica market report also includes key purchase criteria and drivers of price sensitivity to help companies evaluate and develop their market growth analysis strategies.

Customer Landscape of Mica Industry

Competitive Landscape

Companies are implementing various strategies, such as strategic alliances, mica market forecast, partnerships, mergers and acquisitions, geographical expansion, and product/service launches, to enhance their presence in the industry.

BASF SE - Provides a specialized portfolio of mica-based effect and pearlescent pigments engineered for high-performance industrial, automotive, and cosmetic applications.

The industry research and growth report includes detailed analyses of the competitive landscape of the market and information about key companies, including:

  • BASF SE
  • CMMP
  • Dupre Minerals Ltd
  • ECKART GmbH
  • Great Lakes Mica
  • Imerys S.A.
  • Kobo Products Inc.
  • Kuncai Europe B.V.
  • Merck KGaA
  • Merino Laminates Ltd.
  • Mica Manufacturing Co. Pvt. Ltd.
  • Purbanchal Laminates Pvt. Ltd.
  • Quartz Works GmbH
  • Sakti Mica Manufacturing Co.
  • SCR Sibelco NV
  • Star Laminates Pvt. Ltd.
  • Sun Chemical Corp.
  • The Earth Pigments Co
  • Vasundhara Micro Mineral Infinite
  • Vinayaka Microns India Pvt Ltd

Qualitative and quantitative analysis of companies has been conducted to help clients understand the wider business environment as well as the strengths and weaknesses of key industry players. Data is qualitatively analyzed to categorize companies as pure play, category-focused, industry-focused, and diversified; it is quantitatively analyzed to categorize companies as dominant, leading, strong, tentative, and weak.

Market Intelligence Radar: High-Impact Developments & Growth Signals

  • In the Diversified Metals and Mining industry, the widespread adoption of digital traceability and blockchain technologies to ensure ethical sourcing verification is directly impacting mica supply chains, forcing operators to provide transparent provenance records to meet ESG mandates from downstream electronics and cosmetics clients.
  • Technological advancements in mineral processing technology, including enhanced delamination technology, are enabling the production of high-aspect-ratio mica flakes. This development in the broader mining sector enhances the performance of mica as a functional filler in lightweight composites and sustainable building materials.
  • A structural demand shift within the Diversified Metals and Mining industry, driven by the exponential growth in EV battery thermal management systems, has prioritized minerals with superior thermal insulation properties. This directly increases demand for phlogopite and muscovite mica as essential thermal runaway barrier components.
  • The implementation of stricter environmental regulations and land reclamation mandates across the Diversified Metals and Mining industry is increasing the operational costs of mica extraction by up to 10%. This affects the price competitiveness of natural mica compared to synthetic alternatives and other insulating materials.

Dive into Technavio’s robust research methodology, blending expert interviews, extensive data synthesis, and validated models for unparalleled Mica Market insights. See full methodology.

Market Scope
Page number 301
Base year 2025
Historic period 2020-2024
Forecast period 2026-2030
Growth momentum & CAGR Accelerate at a CAGR of 3.4%
Market growth 2026-2030 USD 115235.2 thousand
Market structure Fragmented
YoY growth 2025-2026(%) 3.2%
Key countries China, India, Japan, South Korea, Indonesia, Thailand, Germany, Russia, France, UK, Italy, Spain, US, Canada, Mexico, Brazil, Argentina, Chile, South Africa, UAE, Saudi Arabia, Egypt and Turkey
Competitive landscape Leading Companies, Market Positioning of Companies, Competitive Strategies, and Industry Risks

Request Free Sample

Research Analyst Overview

  • The mica market ecosystem is a complex value chain starting with raw material suppliers in key mining regions, who extract muscovite and phlogopite ores.
  • These materials are then acquired by global mineral processors like Imerys and Sibelco, which utilize advanced technologies for grinding, delaminating, and treating mica to produce various grades, including ground mica and mica paper, which together account for over 70% of the market volume.
  • Regulatory and advocacy bodies, such as the Responsible Mica Initiative, play a crucial role in establishing ethical sourcing standards. Distribution channels supply these processed materials to end-users across diverse sectors. The electronics sector is the largest consumer, representing approximately 30% of demand, utilizing mica for its superior insulation properties.
  • The automotive, construction, and cosmetics industries are other major end-users, creating a multifaceted demand landscape.

What are the Key Data Covered in this Mica Market Research and Growth Report?

  • What is the expected growth of the Mica Market between 2026 and 2030?

    • The Mica Market is expected to grow by USD 115.24 million during 2026-2030, registering a CAGR of 3.4%. Year-over-year growth in 2026 is estimated at 3.2%%. This acceleration is shaped by rising demand for thermal management in ev battery systems, which is intensifying demand across multiple end-use verticals covered in the report.

  • What segmentation does the market report cover?

    • The report is segmented by Type (Natural, and Synthetic), Application (Electronics, Paints and coatings, Construction, Cosmetics, and Others), Grade Type (Ground, Sheet, and Built-up) and Geography (APAC, Europe, North America, South America, Middle East and Africa). Among these, the Natural segment is estimated to witness significant growth during the forecast period, driven by rising adoption across key application areas. Each segment includes detailed qualitative and quantitative analysis, along with historical data from 2020-2024 and forecasts through 2030 with year-over-year growth rates.

  • Which regions are analyzed in the report?

    • The report covers APAC, Europe, North America, South America and Middle East and Africa. APAC is estimated to contribute 45.2% to market growth during the forecast period. Country-level analysis includes China, India, Japan, South Korea, Indonesia, Thailand, Germany, Russia, France, UK, Italy, Spain, US, Canada, Mexico, Brazil, Argentina, Chile, South Africa, UAE, Saudi Arabia, Egypt and Turkey, with dedicated market size tables and year-over-year growth for each.

  • What are the key growth drivers and market challenges?

    • The primary driver is rising demand for thermal management in ev battery systems, which is accelerating investment and industry demand. The main challenge is ethical sourcing and transparency of global supply chains, creating operational barriers for key market participants. The report quantifies the impact of each driver and challenge across 2026 and 2030 with comparative analysis.

  • Who are the major players in the Mica Market?

    • Key vendors include BASF SE, CMMP, Dupre Minerals Ltd, ECKART GmbH, Great Lakes Mica, Imerys S.A., Kobo Products Inc., Kuncai Europe B.V., Merck KGaA, Merino Laminates Ltd., Mica Manufacturing Co. Pvt. Ltd., Purbanchal Laminates Pvt. Ltd., Quartz Works GmbH, Sakti Mica Manufacturing Co., SCR Sibelco NV, Star Laminates Pvt. Ltd., Sun Chemical Corp., The Earth Pigments Co, Vasundhara Micro Mineral Infinite and Vinayaka Microns India Pvt Ltd. The report provides qualitative and quantitative analysis categorizing companies as dominant, leading, strong, tentative, and weak based on their market positioning. Company profiles include business segment analysis, SWOT assessment, key offerings, and recent strategic developments.

Market Research Insights

  • The competitive landscape of the global mica market 2026-2030 is shaped by a mix of large-scale mineral processors and specialized chemical companies, with APAC-based firms contributing to over 45% of the market's incremental growth. Key players such as Imerys, Merck KGaA, and Kuncai are actively differentiating their portfolios.
  • Recent developments include Kuncai's expansion of its synthetic mica production capacity by 25% to meet escalating demand from the automotive coatings sector. Concurrently, Imerys is advancing its range of high-aspect-ratio phlogopite for EV battery enclosures. These strategic moves directly address the industry's need for high-purity materials and reliable thermal management solutions.
  • The primary challenge navigating this landscape remains the complexity of ensuring an ethical supply chain for natural mica, forcing companies to invest heavily in digital traceability systems to maintain market access in regulated regions.

We can help! Our analysts can customize this mica market research report to meet your requirements.

Get in touch

1. Executive Summary

1.1 Market overview

Executive Summary - Chart on Market Overview
Executive Summary - Data Table on Market Overview
Executive Summary - Chart on Global Market Characteristics
Executive Summary - Chart on Market by Geography
Executive Summary - Chart on Market Segmentation by Type
Executive Summary - Chart on Market Segmentation by Application
Executive Summary - Chart on Market Segmentation by Grade Type
Executive Summary - Chart on Incremental Growth
Executive Summary - Data Table on Incremental Growth
Executive Summary - Chart on Company Market Positioning

2. Technavio Analysis

2.1 Analysis of price sensitivity, lifecycle, customer purchase basket, adoption rates, and purchase criteria

2.2 Criticality of inputs and Factors of differentiation

Chart on Overview on criticality of inputs and factors of differentiation

2.3 Factors of disruption

Chart on Overview on factors of disruption

2.4 Impact of drivers and challenges

Chart on Impact of drivers and challenges in 2025 and 2030

3. Market Landscape

3.1 Market ecosystem

Chart on Parent Market
Data Table on - Parent Market

3.2 Market characteristics

Chart on Market characteristics analysis

3.3 Value chain analysis

Chart on Value chain analysis

4. Market Sizing

4.1 Market definition

Data Table on Offerings of companies included in the market definition

4.2 Market segment analysis

Market segments

4.3 Market size 2025

4.4 Market outlook: Forecast for 2025-2030

Chart on Global - Market size and forecast 2025-2030 ($ thousand)
Data Table on Global - Market size and forecast 2025-2030 ($ thousand)
Chart on Global Market: Year-over-year growth 2025-2030 (%)
Data Table on Global Market: Year-over-year growth 2025-2030 (%)

5. Historic Market Size

5.1 Global Mica Market 2020 - 2024

Historic Market Size - Data Table on Global Mica Market 2020 - 2024 ($ thousand)

5.2 Type segment analysis 2020 - 2024

Historic Market Size - Type Segment 2020 - 2024 ($ thousand)

5.3 Application segment analysis 2020 - 2024

Historic Market Size - Application Segment 2020 - 2024 ($ thousand)

5.4 Grade Type segment analysis 2020 - 2024

Historic Market Size - Grade Type Segment 2020 - 2024 ($ thousand)

5.5 Geography segment analysis 2020 - 2024

Historic Market Size - Geography Segment 2020 - 2024 ($ thousand)

5.6 Country segment analysis 2020 - 2024

Historic Market Size - Country Segment 2020 - 2024 ($ thousand)

6. Qualitative Analysis

6.1 Impact of AI on Global Mica Market

6.2 Impact of geopolitical conflict on Global Mica Market

7. Five Forces Analysis

7.1 Five forces summary

Five forces analysis - Comparison between 2025 and 2030

7.2 Bargaining power of buyers

Bargaining power of buyers - Impact of key factors 2025 and 2030

7.3 Bargaining power of suppliers

Bargaining power of suppliers - Impact of key factors in 2025 and 2030

7.4 Threat of new entrants

Threat of new entrants - Impact of key factors in 2025 and 2030

7.5 Threat of substitutes

Threat of substitutes - Impact of key factors in 2025 and 2030

7.6 Threat of rivalry

Threat of rivalry - Impact of key factors in 2025 and 2030

7.7 Market condition

Chart on Market condition - Five forces 2025 and 2030

8. Market Segmentation by Type

8.1 Market segments

Chart on Type - Market share 2025-2030 (%)
Data Table on Type - Market share 2025-2030 (%)

8.2 Comparison by Type

Chart on Comparison by Type
Data Table on Comparison by Type

8.3 Natural - Market size and forecast 2025-2030

Chart on Natural - Market size and forecast 2025-2030 ($ thousand)
Data Table on Natural - Market size and forecast 2025-2030 ($ thousand)
Chart on Natural - Year-over-year growth 2025-2030 (%)
Data Table on Natural - Year-over-year growth 2025-2030 (%)

8.4 Synthetic - Market size and forecast 2025-2030

Chart on Synthetic - Market size and forecast 2025-2030 ($ thousand)
Data Table on Synthetic - Market size and forecast 2025-2030 ($ thousand)
Chart on Synthetic - Year-over-year growth 2025-2030 (%)
Data Table on Synthetic - Year-over-year growth 2025-2030 (%)

8.5 Market opportunity by Type

Market opportunity by Type ($ thousand)
Data Table on Market opportunity by Type ($ thousand)

9. Market Segmentation by Application

9.1 Market segments

Chart on Application - Market share 2025-2030 (%)
Data Table on Application - Market share 2025-2030 (%)

9.2 Comparison by Application

Chart on Comparison by Application
Data Table on Comparison by Application

9.3 Electronics - Market size and forecast 2025-2030

Chart on Electronics - Market size and forecast 2025-2030 ($ thousand)
Data Table on Electronics - Market size and forecast 2025-2030 ($ thousand)
Chart on Electronics - Year-over-year growth 2025-2030 (%)
Data Table on Electronics - Year-over-year growth 2025-2030 (%)

9.4 Paints and coatings - Market size and forecast 2025-2030

Chart on Paints and coatings - Market size and forecast 2025-2030 ($ thousand)
Data Table on Paints and coatings - Market size and forecast 2025-2030 ($ thousand)
Chart on Paints and coatings - Year-over-year growth 2025-2030 (%)
Data Table on Paints and coatings - Year-over-year growth 2025-2030 (%)

9.5 Construction - Market size and forecast 2025-2030

Chart on Construction - Market size and forecast 2025-2030 ($ thousand)
Data Table on Construction - Market size and forecast 2025-2030 ($ thousand)
Chart on Construction - Year-over-year growth 2025-2030 (%)
Data Table on Construction - Year-over-year growth 2025-2030 (%)

9.6 Cosmetics - Market size and forecast 2025-2030

Chart on Cosmetics - Market size and forecast 2025-2030 ($ thousand)
Data Table on Cosmetics - Market size and forecast 2025-2030 ($ thousand)
Chart on Cosmetics - Year-over-year growth 2025-2030 (%)
Data Table on Cosmetics - Year-over-year growth 2025-2030 (%)

9.7 Others - Market size and forecast 2025-2030

Chart on Others - Market size and forecast 2025-2030 ($ thousand)
Data Table on Others - Market size and forecast 2025-2030 ($ thousand)
Chart on Others - Year-over-year growth 2025-2030 (%)
Data Table on Others - Year-over-year growth 2025-2030 (%)

9.8 Market opportunity by Application

Market opportunity by Application ($ thousand)
Data Table on Market opportunity by Application ($ thousand)

10. Market Segmentation by Grade Type

10.1 Market segments

Chart on Grade Type - Market share 2025-2030 (%)
Data Table on Grade Type - Market share 2025-2030 (%)

10.2 Comparison by Grade Type

Chart on Comparison by Grade Type
Data Table on Comparison by Grade Type

10.3 Ground - Market size and forecast 2025-2030

Chart on Ground - Market size and forecast 2025-2030 ($ thousand)
Data Table on Ground - Market size and forecast 2025-2030 ($ thousand)
Chart on Ground - Year-over-year growth 2025-2030 (%)
Data Table on Ground - Year-over-year growth 2025-2030 (%)

10.4 Sheet - Market size and forecast 2025-2030

Chart on Sheet - Market size and forecast 2025-2030 ($ thousand)
Data Table on Sheet - Market size and forecast 2025-2030 ($ thousand)
Chart on Sheet - Year-over-year growth 2025-2030 (%)
Data Table on Sheet - Year-over-year growth 2025-2030 (%)

10.5 Built-up - Market size and forecast 2025-2030

Chart on Built-up - Market size and forecast 2025-2030 ($ thousand)
Data Table on Built-up - Market size and forecast 2025-2030 ($ thousand)
Chart on Built-up - Year-over-year growth 2025-2030 (%)
Data Table on Built-up - Year-over-year growth 2025-2030 (%)

10.6 Market opportunity by Grade Type

Market opportunity by Grade Type ($ thousand)
Data Table on Market opportunity by Grade Type ($ thousand)

11. Customer Landscape

11.1 Customer landscape overview

Analysis of price sensitivity, lifecycle, customer purchase basket, adoption rates, and purchase criteria

12. Geographic Landscape

12.1 Geographic segmentation

Chart on Market share by geography 2025-2030 (%)
Data Table on Market share by geography 2025-2030 (%)

12.2 Geographic comparison

Chart on Geographic comparison
Data Table on Geographic comparison

12.3 APAC - Market size and forecast 2025-2030

Chart on APAC - Market size and forecast 2025-2030 ($ thousand)
Data Table on APAC - Market size and forecast 2025-2030 ($ thousand)
Chart on APAC - Year-over-year growth 2025-2030 (%)
Data Table on APAC - Year-over-year growth 2025-2030 (%)
Chart on Regional Comparison - APAC
Data Table on Regional Comparison - APAC

12.3.1 China - Market size and forecast 2025-2030

Chart on China - Market size and forecast 2025-2030 ($ thousand)
Data Table on China - Market size and forecast 2025-2030 ($ thousand)
Chart on China - Year-over-year growth 2025-2030 (%)
Data Table on China - Year-over-year growth 2025-2030 (%)

12.3.2 India - Market size and forecast 2025-2030

Chart on India - Market size and forecast 2025-2030 ($ thousand)
Data Table on India - Market size and forecast 2025-2030 ($ thousand)
Chart on India - Year-over-year growth 2025-2030 (%)
Data Table on India - Year-over-year growth 2025-2030 (%)

12.3.3 Japan - Market size and forecast 2025-2030

Chart on Japan - Market size and forecast 2025-2030 ($ thousand)
Data Table on Japan - Market size and forecast 2025-2030 ($ thousand)
Chart on Japan - Year-over-year growth 2025-2030 (%)
Data Table on Japan - Year-over-year growth 2025-2030 (%)

12.3.4 South Korea - Market size and forecast 2025-2030

Chart on South Korea - Market size and forecast 2025-2030 ($ thousand)
Data Table on South Korea - Market size and forecast 2025-2030 ($ thousand)
Chart on South Korea - Year-over-year growth 2025-2030 (%)
Data Table on South Korea - Year-over-year growth 2025-2030 (%)

12.3.5 Indonesia - Market size and forecast 2025-2030

Chart on Indonesia - Market size and forecast 2025-2030 ($ thousand)
Data Table on Indonesia - Market size and forecast 2025-2030 ($ thousand)
Chart on Indonesia - Year-over-year growth 2025-2030 (%)
Data Table on Indonesia - Year-over-year growth 2025-2030 (%)

12.3.6 Thailand - Market size and forecast 2025-2030

Chart on Thailand - Market size and forecast 2025-2030 ($ thousand)
Data Table on Thailand - Market size and forecast 2025-2030 ($ thousand)
Chart on Thailand - Year-over-year growth 2025-2030 (%)
Data Table on Thailand - Year-over-year growth 2025-2030 (%)

12.4 Europe - Market size and forecast 2025-2030

Chart on Europe - Market size and forecast 2025-2030 ($ thousand)
Data Table on Europe - Market size and forecast 2025-2030 ($ thousand)
Chart on Europe - Year-over-year growth 2025-2030 (%)
Data Table on Europe - Year-over-year growth 2025-2030 (%)
Chart on Regional Comparison - Europe
Data Table on Regional Comparison - Europe

12.4.1 Germany - Market size and forecast 2025-2030

Chart on Germany - Market size and forecast 2025-2030 ($ thousand)
Data Table on Germany - Market size and forecast 2025-2030 ($ thousand)
Chart on Germany - Year-over-year growth 2025-2030 (%)
Data Table on Germany - Year-over-year growth 2025-2030 (%)

12.4.2 Russia - Market size and forecast 2025-2030

Chart on Russia - Market size and forecast 2025-2030 ($ thousand)
Data Table on Russia - Market size and forecast 2025-2030 ($ thousand)
Chart on Russia - Year-over-year growth 2025-2030 (%)
Data Table on Russia - Year-over-year growth 2025-2030 (%)

12.4.3 France - Market size and forecast 2025-2030

Chart on France - Market size and forecast 2025-2030 ($ thousand)
Data Table on France - Market size and forecast 2025-2030 ($ thousand)
Chart on France - Year-over-year growth 2025-2030 (%)
Data Table on France - Year-over-year growth 2025-2030 (%)

12.4.4 UK - Market size and forecast 2025-2030

Chart on UK - Market size and forecast 2025-2030 ($ thousand)
Data Table on UK - Market size and forecast 2025-2030 ($ thousand)
Chart on UK - Year-over-year growth 2025-2030 (%)
Data Table on UK - Year-over-year growth 2025-2030 (%)

12.4.5 Italy - Market size and forecast 2025-2030

Chart on Italy - Market size and forecast 2025-2030 ($ thousand)
Data Table on Italy - Market size and forecast 2025-2030 ($ thousand)
Chart on Italy - Year-over-year growth 2025-2030 (%)
Data Table on Italy - Year-over-year growth 2025-2030 (%)

12.4.6 Spain - Market size and forecast 2025-2030

Chart on Spain - Market size and forecast 2025-2030 ($ thousand)
Data Table on Spain - Market size and forecast 2025-2030 ($ thousand)
Chart on Spain - Year-over-year growth 2025-2030 (%)
Data Table on Spain - Year-over-year growth 2025-2030 (%)

12.5 North America - Market size and forecast 2025-2030

Chart on North America - Market size and forecast 2025-2030 ($ thousand)
Data Table on North America - Market size and forecast 2025-2030 ($ thousand)
Chart on North America - Year-over-year growth 2025-2030 (%)
Data Table on North America - Year-over-year growth 2025-2030 (%)
Chart on Regional Comparison - North America
Data Table on Regional Comparison - North America

12.5.1 US - Market size and forecast 2025-2030

Chart on US - Market size and forecast 2025-2030 ($ thousand)
Data Table on US - Market size and forecast 2025-2030 ($ thousand)
Chart on US - Year-over-year growth 2025-2030 (%)
Data Table on US - Year-over-year growth 2025-2030 (%)

12.5.2 Canada - Market size and forecast 2025-2030

Chart on Canada - Market size and forecast 2025-2030 ($ thousand)
Data Table on Canada - Market size and forecast 2025-2030 ($ thousand)
Chart on Canada - Year-over-year growth 2025-2030 (%)
Data Table on Canada - Year-over-year growth 2025-2030 (%)

12.5.3 Mexico - Market size and forecast 2025-2030

Chart on Mexico - Market size and forecast 2025-2030 ($ thousand)
Data Table on Mexico - Market size and forecast 2025-2030 ($ thousand)
Chart on Mexico - Year-over-year growth 2025-2030 (%)
Data Table on Mexico - Year-over-year growth 2025-2030 (%)

12.6 South America - Market size and forecast 2025-2030

Chart on South America - Market size and forecast 2025-2030 ($ thousand)
Data Table on South America - Market size and forecast 2025-2030 ($ thousand)
Chart on South America - Year-over-year growth 2025-2030 (%)
Data Table on South America - Year-over-year growth 2025-2030 (%)
Chart on Regional Comparison - South America
Data Table on Regional Comparison - South America

12.6.1 Brazil - Market size and forecast 2025-2030

Chart on Brazil - Market size and forecast 2025-2030 ($ thousand)
Data Table on Brazil - Market size and forecast 2025-2030 ($ thousand)
Chart on Brazil - Year-over-year growth 2025-2030 (%)
Data Table on Brazil - Year-over-year growth 2025-2030 (%)

12.6.2 Argentina - Market size and forecast 2025-2030

Chart on Argentina - Market size and forecast 2025-2030 ($ thousand)
Data Table on Argentina - Market size and forecast 2025-2030 ($ thousand)
Chart on Argentina - Year-over-year growth 2025-2030 (%)
Data Table on Argentina - Year-over-year growth 2025-2030 (%)

12.6.3 Chile - Market size and forecast 2025-2030

Chart on Chile - Market size and forecast 2025-2030 ($ thousand)
Data Table on Chile - Market size and forecast 2025-2030 ($ thousand)
Chart on Chile - Year-over-year growth 2025-2030 (%)
Data Table on Chile - Year-over-year growth 2025-2030 (%)

12.7 Middle East and Africa - Market size and forecast 2025-2030

Chart on Middle East and Africa - Market size and forecast 2025-2030 ($ thousand)
Data Table on Middle East and Africa - Market size and forecast 2025-2030 ($ thousand)
Chart on Middle East and Africa - Year-over-year growth 2025-2030 (%)
Data Table on Middle East and Africa - Year-over-year growth 2025-2030 (%)
Chart on Regional Comparison - Middle East and Africa
Data Table on Regional Comparison - Middle East and Africa

12.7.1 South Africa - Market size and forecast 2025-2030

Chart on South Africa - Market size and forecast 2025-2030 ($ thousand)
Data Table on South Africa - Market size and forecast 2025-2030 ($ thousand)
Chart on South Africa - Year-over-year growth 2025-2030 (%)
Data Table on South Africa - Year-over-year growth 2025-2030 (%)

12.7.2 UAE - Market size and forecast 2025-2030

Chart on UAE - Market size and forecast 2025-2030 ($ thousand)
Data Table on UAE - Market size and forecast 2025-2030 ($ thousand)
Chart on UAE - Year-over-year growth 2025-2030 (%)
Data Table on UAE - Year-over-year growth 2025-2030 (%)

12.7.3 Saudi Arabia - Market size and forecast 2025-2030

Chart on Saudi Arabia - Market size and forecast 2025-2030 ($ thousand)
Data Table on Saudi Arabia - Market size and forecast 2025-2030 ($ thousand)
Chart on Saudi Arabia - Year-over-year growth 2025-2030 (%)
Data Table on Saudi Arabia - Year-over-year growth 2025-2030 (%)

12.7.4 Egypt - Market size and forecast 2025-2030

Chart on Egypt - Market size and forecast 2025-2030 ($ thousand)
Data Table on Egypt - Market size and forecast 2025-2030 ($ thousand)
Chart on Egypt - Year-over-year growth 2025-2030 (%)
Data Table on Egypt - Year-over-year growth 2025-2030 (%)

12.7.5 Turkey - Market size and forecast 2025-2030

Chart on Turkey - Market size and forecast 2025-2030 ($ thousand)
Data Table on Turkey - Market size and forecast 2025-2030 ($ thousand)
Chart on Turkey - Year-over-year growth 2025-2030 (%)
Data Table on Turkey - Year-over-year growth 2025-2030 (%)

12.8 Market opportunity by geography

Market opportunity by geography ($ thousand)
Data Tables on Market opportunity by geography ($ thousand)

13. Drivers, Challenges, and Opportunity

13.1 Market drivers

Rising demand for thermal management in EV battery systems
Growth in synthetic mica segment driven by purity and ethical sourcing requirements
Advancements in high-voltage electrical insulation and infrastructure modernization

13.2 Market challenges

Ethical sourcing and transparency of global supply chains
Stringent environmental regulations and ecological reclamation mandates
Proliferation of synthetic alternatives and material substitution

13.3 Impact of drivers and challenges

Impact of drivers and challenges in 2025 and 2030

13.4 Market opportunities

Accelerated adoption of synthetic mica in cosmetic and coating sector
Expansion of mica-based thermal barriers in EV industry
Integration of digital traceability and blockchain for ethical sourcing

14. Competitive Landscape

14.1 Overview

14.2

Overview on criticality of inputs and factors of differentiation

14.3 Landscape disruption

Overview on factors of disruption

14.4 Industry risks

Impact of key risks on business

15. Competitive Analysis

15.1 Companies profiled

Companies covered

15.2 Company ranking index

15.3 Market positioning of companies

Matrix on companies position and classification

15.4 BASF SE

BASF SE - Overview
BASF SE - Business segments
BASF SE - Key news
BASF SE - Key offerings
BASF SE - Segment focus
SWOT

15.5 CMMP

CMMP - Overview
CMMP - Product / Service
CMMP - Key offerings
SWOT

15.6 Dupre Minerals Ltd

Dupre Minerals Ltd - Overview
Dupre Minerals Ltd - Product / Service
Dupre Minerals Ltd - Key offerings
SWOT

15.7 ECKART GmbH

ECKART GmbH - Overview
ECKART GmbH - Product / Service
ECKART GmbH - Key offerings
SWOT

15.8 Imerys S.A.

Imerys S.A. - Overview
Imerys S.A. - Business segments
Imerys S.A. - Key news
Imerys S.A. - Key offerings
Imerys S.A. - Segment focus
SWOT

15.9 Kobo Products Inc.

Kobo Products Inc. - Overview
Kobo Products Inc. - Product / Service
Kobo Products Inc. - Key offerings
SWOT

15.10 Kuncai Europe B.V.

Kuncai Europe B.V. - Overview
Kuncai Europe B.V. - Product / Service
Kuncai Europe B.V. - Key offerings
SWOT

15.11 Merck KGaA

Merck KGaA - Overview
Merck KGaA - Business segments
Merck KGaA - Key news
Merck KGaA - Key offerings
Merck KGaA - Segment focus
SWOT

15.12 Merino Laminates Ltd.

Merino Laminates Ltd. - Overview
Merino Laminates Ltd. - Product / Service
Merino Laminates Ltd. - Key offerings
SWOT

15.13 Purbanchal Laminates Pvt. Ltd.

Purbanchal Laminates Pvt. Ltd. - Overview
Purbanchal Laminates Pvt. Ltd. - Product / Service
Purbanchal Laminates Pvt. Ltd. - Key offerings
SWOT

15.14 Sakti Mica Manufacturing Co.

Sakti Mica Manufacturing Co. - Overview
Sakti Mica Manufacturing Co. - Product / Service
Sakti Mica Manufacturing Co. - Key offerings
SWOT

15.15 SCR Sibelco NV

SCR Sibelco NV - Overview
SCR Sibelco NV - Product / Service
SCR Sibelco NV - Key offerings
SWOT

15.16 Star Laminates Pvt. Ltd.

Star Laminates Pvt. Ltd. - Overview
Star Laminates Pvt. Ltd. - Product / Service
Star Laminates Pvt. Ltd. - Key offerings
SWOT

15.17 Sun Chemical Corp.

Sun Chemical Corp. - Overview
Sun Chemical Corp. - Product / Service
Sun Chemical Corp. - Key offerings
SWOT

15.18 Vinayaka Microns India Pvt Ltd

Vinayaka Microns India Pvt Ltd - Overview
Vinayaka Microns India Pvt Ltd - Product / Service
Vinayaka Microns India Pvt Ltd - Key offerings
SWOT

16. Appendix

16.1 Scope of the report

Market definition
Objectives
Notes and caveats

16.2 Inclusions and exclusions checklist

Inclusions checklist
Exclusions checklist

16.3 Currency conversion rates for US$

16.4 Research methodology

16.5 Data procurement

Information sources

16.6 Data validation

16.7 Validation techniques employed for market sizing

16.8 Data synthesis

16.9 360 degree market analysis

16.10 List of abbreviations

Research Methodology

Technavio presents a detailed picture of the market by way of study, synthesis, and summation of data from multiple sources. The analysts have presented the various facets of the market with a particular focus on identifying the key industry influencers. The data thus presented is comprehensive, reliable, and the result of extensive research, both primary and secondary.

INFORMATION SOURCES

Primary sources

  • Manufacturers and suppliers
  • Channel partners
  • Industry experts
  • Strategic decision makers

Secondary sources

  • Industry journals and periodicals
  • Government data
  • Financial reports of key industry players
  • Historical data
  • Press releases

DATA ANALYSIS

Data Synthesis

  • Collation of data
  • Estimation of key figures
  • Analysis of derived insights

Data Validation

  • Triangulation with data models
  • Reference against proprietary databases
  • Corroboration with industry experts

REPORT WRITING

Qualitative

  • Market drivers
  • Market challenges
  • Market trends
  • Five forces analysis

Quantitative

  • Market size and forecast
  • Market segmentation
  • Geographical insights
  • Competitive landscape

Interested in this report?

Get your sample now to see our research methodology and insights!

Download Now

Frequently Asked Questions

Mica market growth will increase by USD 115235.2 thousand thousand during 2026-2030.

The Mica market is expected to grow at a CAGR of 3.4% during 2026-2030.

Mica market is segmented by Type (Natural, Synthetic) Application (Electronics, Paints and coatings, Construction, Cosmetics, Others) Grade type (Ground, Sheet, Built-up)

BASF SE, CMMP, Dupre Minerals Ltd, ECKART GmbH, Great Lakes Mica, Imerys S.A., Kobo Products Inc., Kuncai Europe B.V., Merck KGaA, Merino Laminates Ltd., Mica Manufacturing Co. Pvt. Ltd., Purbanchal Laminates Pvt. Ltd., Quartz Works GmbH, Sakti Mica Manufacturing Co., SCR Sibelco NV, Star Laminates Pvt. Ltd., Sun Chemical Corp., The Earth Pigments Co, Vasundhara Micro Mineral Infinite, Vinayaka Microns India Pvt Ltd are a few of the key vendors in the Mica market.

APAC will register the highest growth rate of 45.2% among the other regions. Therefore, the Mica market in APAC is expected to garner significant business opportunities for the vendors during the forecast period.

China, India, Japan, South Korea, Indonesia, Thailand, Germany, Russia, France, UK, Italy, Spain, US, Canada, Mexico, Brazil, Argentina, Chile, South Africa, UAE, Saudi Arabia, Egypt, Turkey

  • Rising demand for thermal management in EV battery systems is the driving factor this market.

The Mica market vendors should focus on grabbing business opportunities from the Type segment as it accounted for the largest market share in the base year.
RIA - Research AI Assistant
Ask RIA