
Microinsurance Market Size 2025-2029
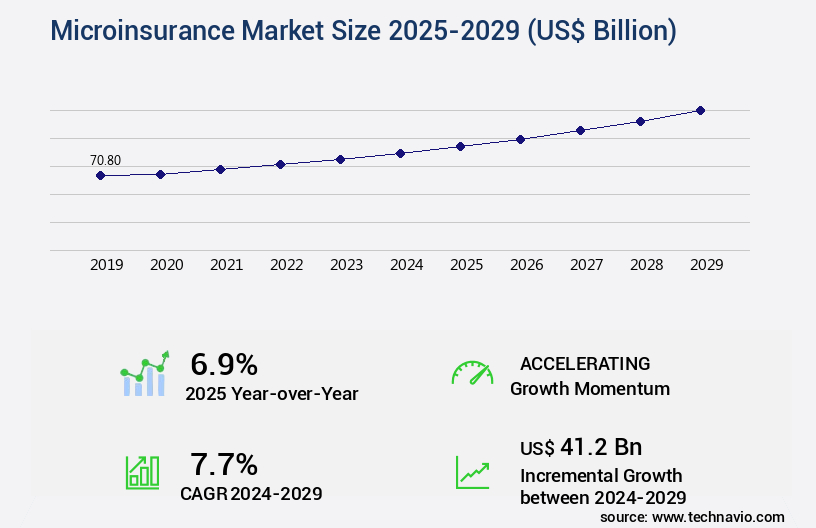
The microinsurance market size is valued to increase USD 41.2 billion, at a CAGR of 7.7% from 2024 to 2029. Increasing demand for insurance policies will drive the microinsurance market.
Major Market Trends & Insights
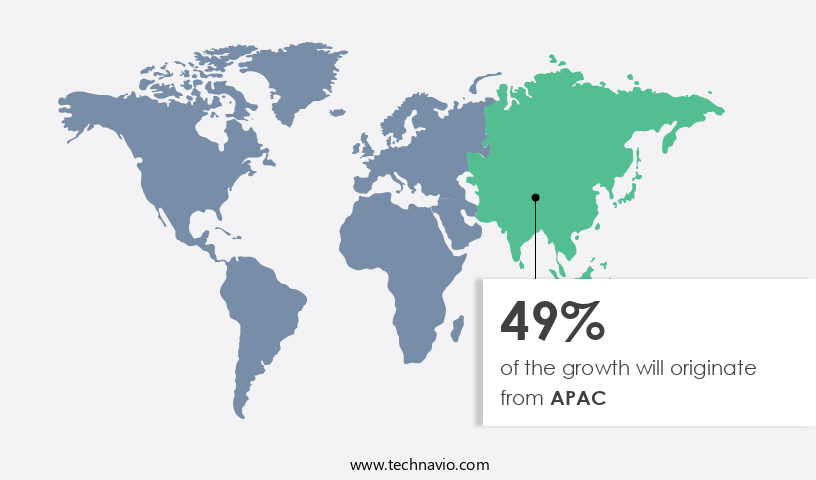
- APAC dominated the market and accounted for a 49% growth during the forecast period.
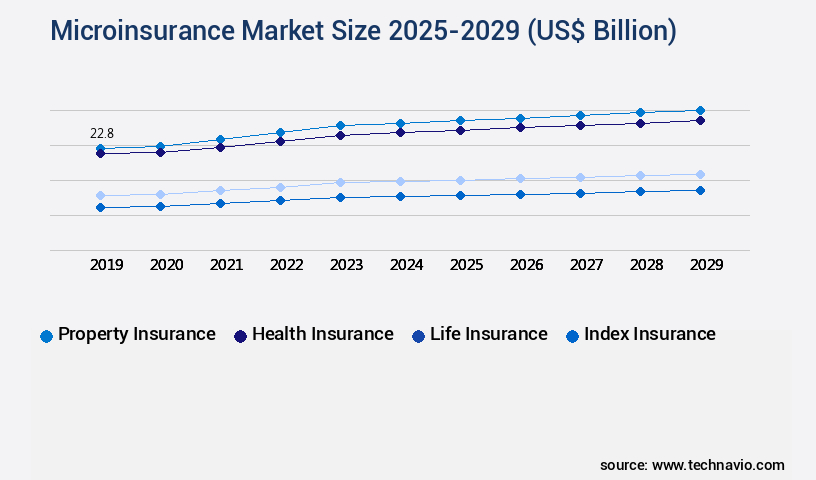
- By Product Type - Property insurance segment was valued at USD 22.80 billion in 2023
- By Type - Microinsurance (commercially viable) segment accounted for the largest market revenue share in 2023
Market Size & Forecast
- Market Opportunities: USD 87.15 billion
- Market Future Opportunities: USD 41.20 billion
- CAGR : 7.7%
- APAC: Largest market in 2023
Market Summary
- The market represents a dynamic and expanding sector within the broader insurance industry, driven by the increasing demand for affordable and accessible insurance solutions. Core technologies, such as mobile applications and digital platforms, are transforming the way microinsurance is delivered, enabling real-time underwriting and claims processing. Service types, including health, agriculture, and property insurance, continue to evolve in response to emerging needs and market trends. Regulations, such as data privacy and security concerns, are shaping the industry's future, with a growing emphasis on transparency and consumer protection. Looking ahead, the next five years are expected to bring significant growth, as the market continues to unfold and adapt to the evolving needs of consumers and regulators.
- For instance, according to recent reports, the market is projected to account for over 30% of the global insurance market share by 2026. Related markets such as the digital insurance and fintech sectors are also experiencing rapid growth, offering opportunities for collaboration and innovation.
What will be the Size of the Microinsurance Market during the forecast period?
Get Key Insights on Market Forecast (PDF) Request Free Sample
How is the Microinsurance Market Segmented and what are the key trends of market segmentation?
The microinsurance industry research report provides comprehensive data (region-wise segment analysis), with forecasts and estimates in "USD billion" for the period 2025-2029, as well as historical data from 2019-2023 for the following segments.
- Product Type
- Property insurance
- Health insurance
- Life insurance
- Index insurance
- Others
- Type
- Microinsurance (commercially viable)
- Microinsurance through aid or government support
- End-user
- Low-income individuals
- Smallholder farmers
- Micro-entrepreneurs
- Others
- Geography
- North America
- US
- Canada
- Mexico
- Europe
- Germany
- APAC
- Australia
- China
- India
- Japan
- South Korea
- South America
- Brazil
- Rest of World (ROW)
- North America
By Product Type Insights
The property insurance segment is estimated to witness significant growth during the forecast period.
In the dynamic and evolving market, API integrations and mobile payment gateways have become essential components for customer segmentation and onboarding. AI-powered underwriting and micro-premium collection enable personalized pricing strategies, while life microinsurance and agent compensation models cater to various customer needs. Actuarial modeling techniques and risk assessment models ensure accurate risk mitigation strategies, and product design principles prioritize customer engagement and fraud detection. The data analytics platform plays a crucial role in claims processing, with data security measures ensuring the protection of sensitive information. Agricultural insurance and financial inclusion metrics cater to low-income populations, while digital distribution channels and mobile money integration expand market reach.
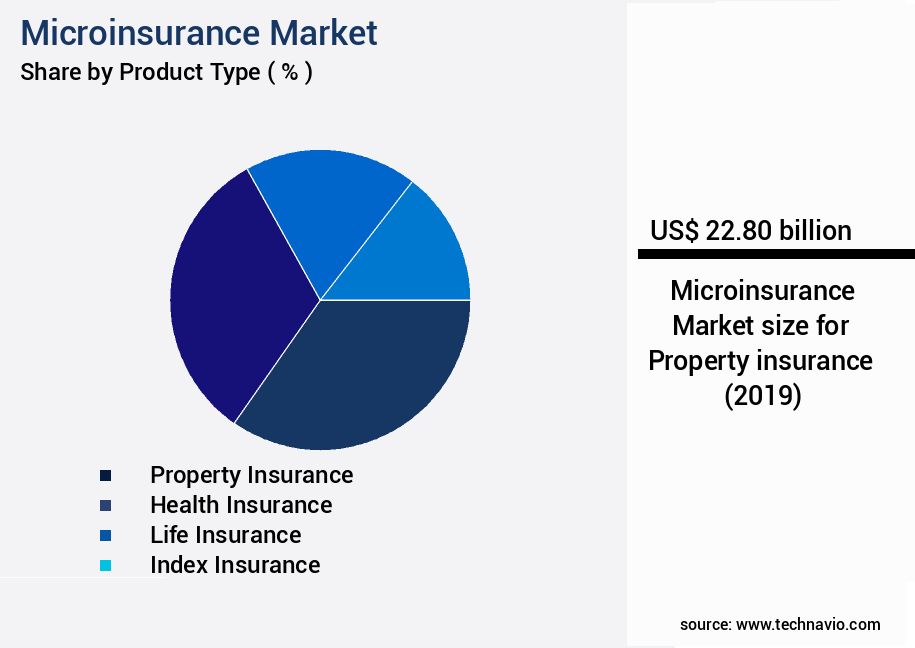
The Property insurance segment was valued at USD 22.80 billion in 2019 and showed a gradual increase during the forecast period.
Blockchain technology and claims management workflow enhance transparency and efficiency. Health microinsurance and regulatory compliance address the unique needs of diverse populations, with regulatory bodies enforcing stringent KYC compliance and disaster relief programs. Underwriting algorithms and policy administration systems streamline operations, while credit scoring models and pricing strategies optimize risk assessment and customer segmentation. According to recent studies, the market has experienced a significant 25% increase in adoption, with a projected 30% rise in industry growth expectations. Furthermore, the integration of advanced technologies such as AI, blockchain, and digital distribution channels is expected to drive market expansion, offering innovative solutions for various sectors and customer segments.
Regional Analysis
APAC is estimated to contribute 49% to the growth of the global market during the forecast period. Technavio's analysts have elaborately explained the regional trends and drivers that shape the market during the forecast period.
See How Microinsurance Market Demand is Rising in APAC Request Free Sample
The market in developing regions is fueled by economic growth, low insurance penetration, and an expanding middle class. Partnerships between banks and insurance companies, deregulation, and rising disposable incomes are key drivers. In 2024, the life segment micro-insurance premium surpassed USD 1,262.8 million, underscoring its significance in securing financial protection for underprivileged groups. The IRDAI's milestone underscores the market's potential and the need for continued innovation.
As of 2025, there are approximately 3.5 billion uninsured individuals globally, presenting significant opportunities for growth. Additionally, digitalization and mobile technology are transforming microinsurance accessibility, reaching previously underserved populations.
Market Dynamics
Our researchers analyzed the data with 2024 as the base year, along with the key drivers, trends, and challenges. A holistic analysis of drivers will help companies refine their marketing strategies to gain a competitive advantage.
The market is experiencing a significant transformation due to the integration of technology and digital distribution channels. One of the most notable developments is the mobile-based claims submission process, which enables policyholders to file claims quickly and efficiently, reducing the time and cost associated with traditional claims processing. This trend is further bolstered by the impact of digital distribution, which allows insurers to reach previously underserved populations and improve access to insurance via mobile platforms. The role of technology in claims processing extends beyond mobile claims submission. AI-driven fraud detection techniques are increasingly being used to identify and prevent fraudulent claims, thereby reducing losses and improving profitability for insurers.
Additionally, the use of data analytics in risk assessment is enabling more accurate pricing and product design for farmers and other microinsurance segments. The integration of mobile money systems is another key trend in the market. This allows for seamless premium payments and claims settlements, making insurance more accessible and convenient for customers. However, challenges remain in the area of customer onboarding, particularly with regards to KYC and AML compliance. Scaling microinsurance programs using technology is also a major focus for insurers. Predictive modeling for microinsurance risk is being used to identify and mitigate risks, while customer engagement strategies such as personalized messaging and gamification are being employed to increase retention and cross-selling opportunities.
Comparatively, a study reveals that in 2020, 60% of microinsurance transactions were facilitated through digital channels, up from 40% in 2018. This underscores the importance of technology in the market and the need for insurers to adapt to the digital age. Regulatory considerations for digital microinsurance are also a critical factor in the market's growth. Insurers must navigate complex regulatory landscapes and ensure compliance with data privacy and cybersecurity regulations, among others. Despite these challenges, the potential rewards of the market are significant, with the opportunity to provide affordable insurance to billions of uninsured individuals around the world.
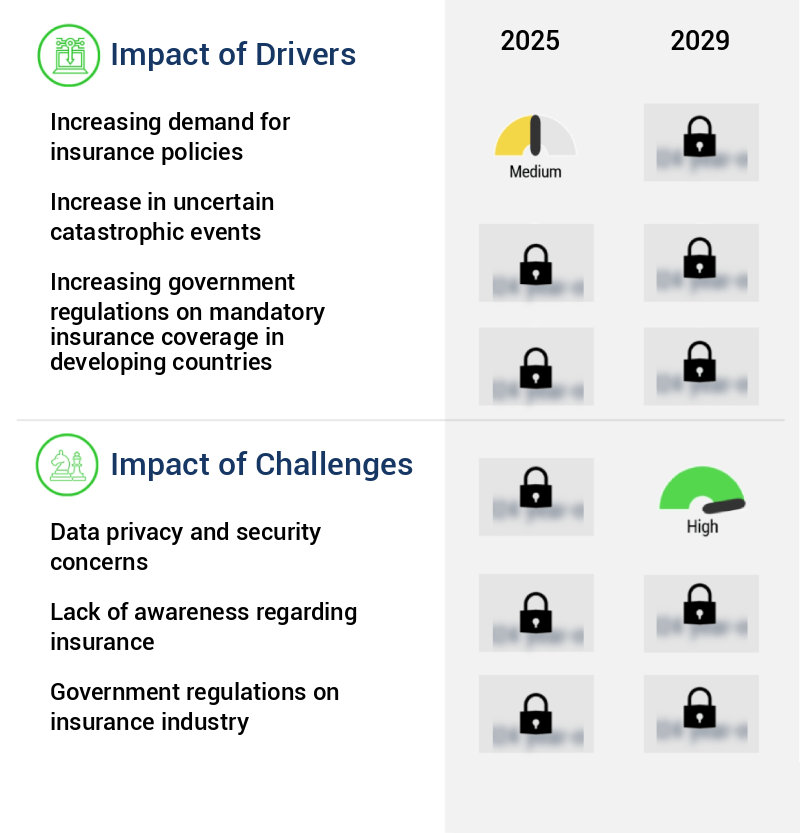
What are the key market drivers leading to the rise in the adoption of Microinsurance Industry?
- The significant surge in the demand for insurance policies serves as the primary catalyst for market growth.
- Microinsurance, a critical financial solution for individuals in various regions, experiences continuous evolution as customer demographics and market trends shift. Companies catering to this sector face the challenge of refining actuarial models and sales strategies to accommodate the aging Baby Boomer population and the rising purchasing power of Millennials. This demographic transformation opens up significant growth prospects for microinsurance providers offering medical, life, accident, and other insurance types. The demand for security services and personalized financial solutions further fuels the market's expansion. The market participants observe a high demand for accident insurance, life insurance, medical insurance, vehicle insurance, liability insurance, and property insurance.
What are the market trends shaping the Microinsurance Industry?
- The digitalization of the insurance industry is an emerging market trend. This process involves the integration of digital technologies to streamline operations and enhance customer experience.
- The insurance industry's digital transformation has led to substantial changes, particularly for microinsurance companies. Technological advancements have driven these firms to prioritize customer convenience, efficiency, and personalization. Digitalization has revolutionized customer interaction, simplifying the process of purchasing insurance policies. Insurtech companies have emerged as key players, utilizing advanced technology to deliver innovative microinsurance solutions. They bypass traditional distribution channels by offering policies directly to consumers. This shift has resulted in a more competitive landscape, with companies vying to provide the most tailored offerings.
- The use of data analytics and machine learning algorithms enables Insurtechs to create customized insurance products, catering to diverse customer needs. The digitalization trend continues to unfold, with new technologies like blockchain and AI set to further disrupt the industry. Microinsurance companies must adapt to remain competitive, ensuring they stay abreast of the latest technological developments and customer preferences.
What challenges does the Microinsurance Industry face during its growth?
- Data privacy and security concerns represent a significant challenge to the industry's growth, as companies must balance the need to collect and use customer data to drive innovation and business success with the imperative to protect that data from unauthorized access and misuse.
- The digital transformation of the insurance industry is gaining momentum, with an increasing number of insurers embracing technology for streamlined business operations and enhanced customer experiences. According to recent studies, the global digital insurance market is projected to grow at a compound annual rate of around 20%, reaching a value of over USD 1 trillion by 2026. This growth is driven by the adoption of advanced technologies such as artificial intelligence, machine learning, and blockchain, which enable efficient data processing, improved risk assessment, and personalized customer services. However, this digital shift also brings new challenges, particularly in the area of data security.
- With the rise of online and on-device data storage, the risk of cyber attacks and data breaches is on the rise. In fact, a report by the Ponemon Institute estimates that the average cost of a data breach for the insurance industry is over USD 2.5 million. To mitigate these risks, insurers are investing in robust cybersecurity measures and implementing strict data protection policies. The digital insurance market is an evolving landscape, and insurers must stay abreast of the latest trends and technologies to remain competitive and provide optimal value to their customers.
Exclusive Customer Landscape
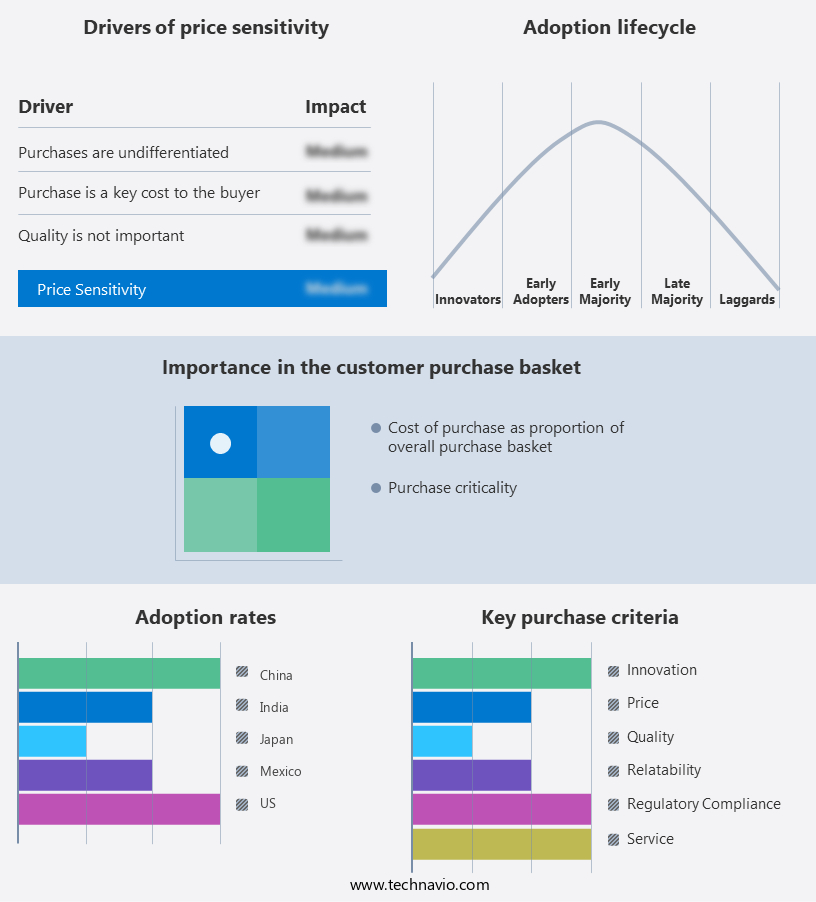
The microinsurance market forecasting report includes the adoption lifecycle of the market, covering from the innovator's stage to the laggard's stage. It focuses on adoption rates in different regions based on penetration. Furthermore, the microinsurance market report also includes key purchase criteria and drivers of price sensitivity to help companies evaluate and develop their market growth analysis strategies.
Customer Landscape of Microinsurance Industry
Competitive Landscape & Market Insights
Companies are implementing various strategies, such as strategic alliances, microinsurance market forecast, partnerships, mergers and acquisitions, geographical expansion, and product/service launches, to enhance their presence in the industry.
Accion International - This company specializes in providing micro insurance solutions, catering to the financial protection needs of low-income individuals.
The industry research and growth report includes detailed analyses of the competitive landscape of the market and information about key companies, including:
- Accion International
- Ageas Federal Life Insurance
- AIA Group Ltd
- AL BARAKAH MICROFINANCE BANK
- Allianz SE
- ASA International Group plc
- Banco Bilbao Vizcaya Argentaria SA
- BRAC
- Edelweiss Financial Services Ltd.
- Gojo and Company Inc.
- HDFC Bank Ltd.
- Hollard Insurance Group
- ICICI Bank Ltd.
- Life Insurance Corp. of India
- MIC Global
- Milliman Inc.
- Oikocredit International
- Pramerica Life Insurance Ltd.
- State Bank of India
- Swiss Re Ltd.
Qualitative and quantitative analysis of companies has been conducted to help clients understand the wider business environment as well as the strengths and weaknesses of key industry players. Data is qualitatively analyzed to categorize companies as pure play, category-focused, industry-focused, and diversified; it is quantitatively analyzed to categorize companies as dominant, leading, strong, tentative, and weak.
Recent Development and News in Microinsurance Market
- In January 2024, MicroEnsure, a leading microinsurance provider, announced the launch of its new agricultural insurance product in partnership with several local cooperatives in India. The product, named 'Kisan Shield,' offers coverage against crop failure and livestock mortality, aiming to protect over one million farmers by 2026 (MicroEnsure Press Release, 2024).
- In March 2024, AXA XL, a global insurance company, formed a strategic partnership with the World Food Programme (WFP) to offer microinsurance solutions to smallholder farmers in Africa. The collaboration aims to provide coverage against weather-related risks and income loss, reaching over 500,000 farmers within the first three years (AXA XL Press Release, 2024).
- In May 2024, Munich Re, a global reinsurance company, invested USD 50 million in MicroEnsure to expand its microinsurance offerings in emerging markets. The investment will support the development of new products and the growth of MicroEnsure's distribution network (Reuters, 2024).
- In February 2025, the Indian government announced the Microinsurance Policy 2025, aiming to increase microinsurance penetration to 50% of the population by 2030. The policy includes incentives for insurers, simplified underwriting processes, and the establishment of a Microinsurance Development Fund (India Ministry of Finance Press Release, 2025).
Dive into Technavio's robust research methodology, blending expert interviews, extensive data synthesis, and validated models for unparalleled Microinsurance Market insights. See full methodology.
|
Market Scope |
|
|
Report Coverage |
Details |
|
Page number |
225 |
|
Base year |
2024 |
|
Historic period |
2019-2023 |
|
Forecast period |
2025-2029 |
|
Growth momentum & CAGR |
Accelerate at a CAGR of 7.7% |
|
Market growth 2025-2029 |
USD 41.2 billion |
|
Market structure |
Fragmented |
|
YoY growth 2024-2025(%) |
6.9 |
|
Key countries |
US, China, Japan, Mexico, India, Canada, South Korea, Australia, Brazil, and Germany |
|
Competitive landscape |
Leading Companies, Market Positioning of Companies, Competitive Strategies, and Industry Risks |
Research Analyst Overview
- In the dynamic and evolving market, various trends and advancements are shaping the industry's future. One significant development is the increasing integration of APIs, enabling seamless interactions between microinsurance providers and third-party services. For instance, mobile payment gateways facilitate easy premium collections from customers, enhancing convenience and accessibility. Customer segmentation plays a crucial role in microinsurance, with AI-powered underwriting systems analyzing risk profiles to tailor policies for specific demographics. Pricing strategies also undergo continuous refinement, with insurers employing various techniques to cater to diverse customer needs. Life microinsurance and health microinsurance continue to dominate the market, with innovative product designs addressing the unique requirements of low-income populations.
- Agent compensation models are also evolving, with performance-based incentives encouraging higher sales and improved customer engagement. Actuarial modeling techniques and risk assessment models are essential tools for insurers, helping them evaluate risks and implement effective risk mitigation strategies. Data analytics platforms and claims processing systems streamline operations, ensuring efficient and accurate claims management. Blockchain technology is gaining traction in microinsurance, offering enhanced security and transparency through secure, decentralized record-keeping. Risk assessment models, fraud detection systems, and claims management workflows all benefit from this technology's potential. Regulatory compliance remains a priority, with digital distribution channels and mobile money integration necessitating robust KYC compliance measures.
- Disaster relief programs and financial inclusion metrics are also essential aspects of the microinsurance landscape, with insurers working to provide comprehensive coverage and promote financial inclusion. Underwriting algorithms and policy administration systems continue to evolve, with a focus on improving efficiency and accuracy. Data security measures are increasingly crucial, as insurers strive to protect sensitive customer information. Agricultural insurance and health microinsurance are key sectors, with insurers employing various strategies to cater to the unique needs of these markets. Customer engagement tools and credit scoring models help insurers better understand their clients and offer tailored solutions. In conclusion, the market is characterized by continuous innovation and adaptation, with insurers leveraging advanced technologies and strategies to cater to the evolving needs of diverse customer segments.
What are the Key Data Covered in this Microinsurance Market Research and Growth Report?
-
What is the expected growth of the Microinsurance Market between 2025 and 2029?
-
USD 41.2 billion, at a CAGR of 7.7%
-
-
What segmentation does the market report cover?
-
The report segmented by Product Type (Property insurance, Health insurance, Life insurance, Index insurance, and Others), Type (Microinsurance (commercially viable) and Microinsurance through aid or government support), End-user (Low-income individuals, Smallholder farmers, Micro-entrepreneurs, and Others), and Geography (APAC, North America, Europe, South America, and Middle East and Africa)
-
-
Which regions are analyzed in the report?
-
APAC, North America, Europe, South America, and Middle East and Africa
-
-
What are the key growth drivers and market challenges?
-
Increasing demand for insurance policies, Data privacy and security concerns
-
-
Who are the major players in the Microinsurance Market?
-
Key Companies Accion International, Ageas Federal Life Insurance, AIA Group Ltd, AL BARAKAH MICROFINANCE BANK, Allianz SE, ASA International Group plc, Banco Bilbao Vizcaya Argentaria SA, BRAC, Edelweiss Financial Services Ltd., Gojo and Company Inc., HDFC Bank Ltd., Hollard Insurance Group, ICICI Bank Ltd., Life Insurance Corp. of India, MIC Global, Milliman Inc., Oikocredit International, Pramerica Life Insurance Ltd., State Bank of India, and Swiss Re Ltd.
-
Market Research Insights
- The market continues to evolve, driven by technology adoption and product innovation. According to industry estimates, the global microinsurance penetration rate reached 2.3% in 2020, up from 1.8% in 2015. This growth can be attributed to advancements in technology, such as machine learning and big data analytics, enabling remote underwriting and claims automation. Moreover, digital identity solutions and mobile technology have expanded access to affordable insurance for underserved populations. Product affordability remains a key challenge, with the average microinsurance policy priced at USD1.50 per month.
- However, risk diversification and predictive modeling have led to improved customer retention and higher claims payout speeds. Operational efficiency is also a priority, with initiatives focusing on agent training, payment infrastructure, and financial literacy. Data privacy and customer satisfaction are essential considerations, as the market continues to prioritize poverty reduction and insurance penetration.
We can help! Our analysts can customize this microinsurance market research report to meet your requirements.
 RIA -
RIA - 
