Neon Gas Market Analysis Europe, APAC, North America, Middle East and Africa, South America - Ukraine, Russia, China, US, France - Size and Forecast 2024-2028

Neon Gas Market Analysis Europe, APAC, North America, Middle East and Africa, South America - Ukraine, Russia, China, US, France - Size and Forecast 2024-2028

Published: Jul 2024 166 Pages SKU: IRTNTR76126

Market Overview at a Glance

$116.6 Mn
Market Opportunity
7.55%
CAGR
6.66
YoY growth 2023-2024(%)

Neon Gas Market Size 2024-2028

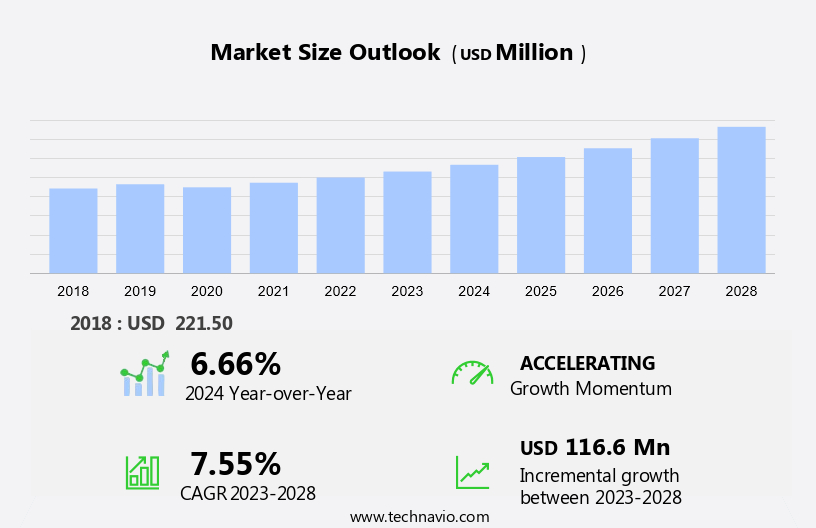
The neon gas market size is forecast to increase by USD 116.6 million at a CAGR of 7.55% between 2023 and 2028.

  • Neon gas, a rare inert gas, holds significant importance in various industries, including lighting, semiconductors, and industrial gases. In the lighting sector, neon gas is extensively used In the production of neon lamps, which find applications in outdoor advertising and signage. In the semiconductor industry, neon gas is used In the production of ICs and LCD panels due to its unique properties, such as high electrical conductivity and ability to emit a red-orange light. Moreover, the aviation industry utilizes neon gas in aircrafts for holography and vacuum tubes. Neon gas is also employed in cryogenic applications, such as In the production of ABS and steel, and as a cooling agent in oscilloscopes and spectroscopy equipment.
  • The increasing demand for enhanced power density and advanced technology in consumer electronics, such as smartphones and sensors, is driving the growth of the market. However, the negative impacts of geopolitical issues, such as the Russia-Ukraine war, on the supply of helium, a by-product of neon gas extraction, may hinder market growth. In summary, the market is witnessing significant growth due to the increasing demand for ICs, LCD panels, and advanced technology in consumer electronics. Neon gas also finds extensive applications In the aviation, industrial gases, and holography industries. However, the geopolitical instability affecting the supply of helium may pose a challenge to market growth.

What will be the Size of the Neon Gas Market During the Forecast Period?

Neon Gas Market Size

 Request Free Sample

  • The market encompasses the production, consumption, and trade of neon, a noble gas primarily utilized in various industries due to its unique properties under an electric field. Neon gas finds extensive applications in diverse sectors such as lasers, electronics, military and defense, sensors, aviation, and advertising. In the electronics industry, neon is employed in semiconductors, LCD and plasma displays, imaging technologies, and lithography stages for manufacturing semiconductor devices. Neon's role in lasers is significant for applications in various industries, including medical, scientific research, and material processing. The market is experiencing growth, driven by the increasing demand for advanced technologies in consumer electronics, aviation, military, and defense sectors.
  • Neon's use in neon lights, fog lights, and advertising further bolsters market growth. The market's size and direction are influenced by factors such as the periodic table position of neon, its unique electrical conductivity, and the ongoing advancements in technology. Neon's primary competitors In the gas market are other noble gases, including helium and argon.

How is this Neon Gas Industry segmented and which is the largest segment?

The neon gas industry research report provides comprehensive data (region-wise segment analysis), with forecasts and estimates in "USD million" for the period 2024-2028, as well as historical data from 2018-2022 for the following segments.
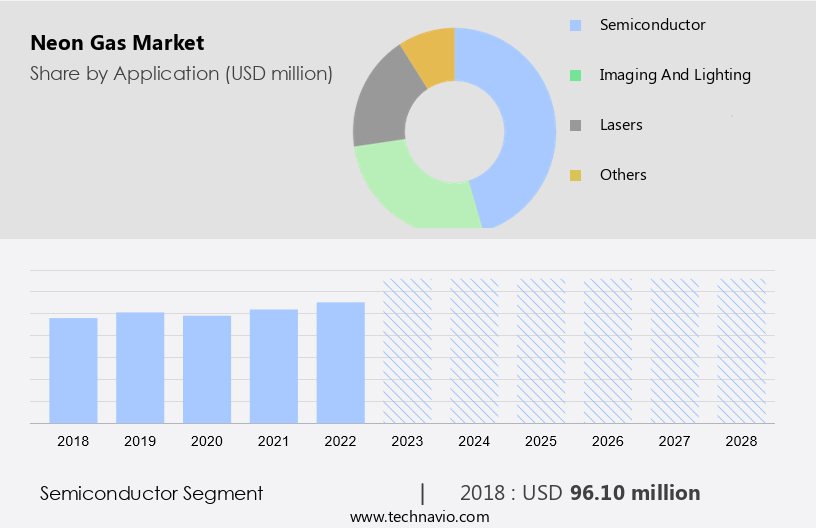
  • Application
    • Semiconductor
    • Imaging and lighting
    • Lasers
    • Others
  • Distribution Channel
    • Cylinders
    • Bulk and micro bulk
    • On-site
  • Geography
    • Europe
      • France
    • APAC
      • China
    • North America
      • US
    • Middle East and Africa
    • South America

By Application Insights

  • The semiconductor segment is estimated to witness significant growth during the forecast period.

Neon gas plays a significant role In the semiconductor industry due to its application In the production process. The increasing demand for semiconductors, driven by the electronic content in military defense equipment and the global electronics sector, will fuel market growth. Semiconductors are integral to military forces and civilian applications, including aviation, radar systems, and high-performance computing. The emergence of multi-core digital signal processing (DSPs) in defense technology reduces power consumption and enhances performance, making it essential for advanced radar and avionics systems. The defense sector's reliance on efficient DSP algorithms necessitates the use of neon gas in semiconductor manufacturing.

Neon Gas Market Size

Get a glance at the market report of share of various segments Request Free Sample

The semiconductor segment was valued at USD 96.10 million in 2018 and showed a gradual increase during the forecast period.

Regional Analysis

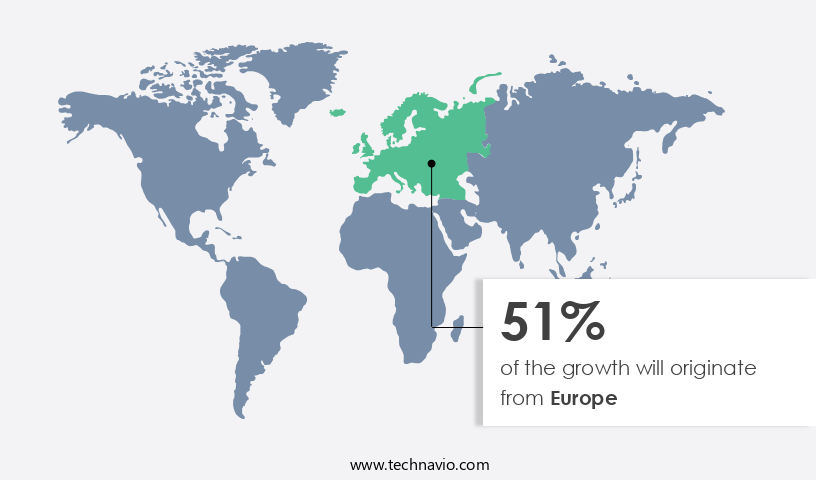
  • Europe is estimated to contribute 51% to the growth of the global market during the forecast period.

Technavio's analysts have elaborately explained the regional trends and drivers that shape the market during the forecast period.

Neon Gas Market Share by Geography

For more insights on the market size of various regions, Request Free Sample

Neon gas is a noble gas extensively utilized in various industries, including lasers, electronics, military and defense, sensors, aviation, air separation units, semiconductors, neon lights, and advertising. Its application spans from illuminating buildings and creating vibrant advertising signs to powering high-tech equipment such as Helium Neon lasers, holography scanners, and particle colliders. The increasing demand for advanced technologies in sectors like consumer electronics, semiconductors, aerospace, and automotive is driving the growth of the market. European markets, in particular, are experiencing significant growth due to rising investments in wireless communication systems and the presence of major companies like INGAS and Cryoin. Neon gas's versatile properties, including its unique emission spectrum, make it an essential component in various lighting technologies and defense equipment.

Market Dynamics

Our researchers analyzed the data with 2023 as the base year, along with the key drivers, trends, and challenges. A holistic analysis of drivers will help companies refine their marketing strategies to gain a competitive advantage.

What are the key market drivers leading to the rise In the adoption of Neon Gas Industry?

An increasing demand for ICs is the key driver of the market.

  • Neon gas plays a crucial role In the semiconductor industry, specifically In the manufacturing process of integrated circuits (ICs) used in automobiles, consumer electronics, and other electronic equipment. The lithography step in semiconductor chip production utilizes it in lasers to carve patterns into silicon. The global automotive industry's increasing focus on advanced safety systems, such as passenger airbags, antilock braking systems (ABS), electronic stability control (ESC), traction control systems (TCS), and tire-pressure monitoring systems (TPMS), drives the demand. For instance, In the US, the National Highway Traffic Safety Administration (NHTSA) mandates the installation of TPMS in all vehicles under 10,000 lbs.
  • Neon gas also finds applications in various industries, including military and defense, aviation, sensors, cryogenic applications, and lighting technologies. Its unique emission spectrum, which includes red, green, orange, and yellow light, makes it suitable for neon lights, advertising signage, and illuminating buildings. Additionally, neon gas is used in rare gas mixtures with krypton, argon, and helium for various applications, such as wave meter tubes, rocket propulsion systems, particle colliders, and holography. In the electronics sector, it is used in electron tubes, glow lamps, plasma studies, and fluorescent starter tubes. Neon gas's boiling point and gaseous condition make it an essential component in gas lasers, cryogenic refrigeration, and DUV lithography methods. Furthermore, it is used in oxygen production facilities and the electronic goods sector for various applications, including barcode scanners, laser sensors, and lithography stages for semiconductor devices.

What are the market trends shaping the Neon Gas Industry?

The increasing demand for enhanced power density is the upcoming market trend.

  • Neon gas, a noble rare gas, is widely used in various industries due to its unique properties. In the electronics sector, it is employed in lasers for applications such as holography, scanners, and blood analysis. The military and defense sector utilizes it in defense equipment, including sensors and lighting technologies for aviation and cryogenic applications in rocket propulsion systems and particle colliders. It is also used In the aviation industry for lighting signages and advertising, particularly in neon tubes that emit red, green, orange, and yellow light. The semiconductor industry relies on it for manufacturing semiconductor devices, LCDs, and imaging components. Neon gas is used in gas lasers, cryogenic refrigeration, and DUV lithography methods for producing electronic goods. 
  • In the consumer electronics sector, it is used in various lighting technologies, such as fog lights, lithography stages, and plasma studies. Neon gas is also used in fluorescent starter tubes, wave meter tubes, and spectroscopy. The increasing demand for high-power solutions and compact applications is driving the need for superior semiconductor materials. Neon gas, as a noble rare gas, is well-suited for high-power applications due to its inherent material properties. This eliminates the need for cooling systems, resulting in compact sizes and cost savings.Neon gas is also used in various industries, including oil and gas, mining, and cylinders and tanks for storage. Overall, neon gas plays a crucial role in various industries, from electronics to defense and lighting technologies.

What challenges does the Neon Gas Industry face during its growth?

The negative impacts of Russia Ukraine war is a key challenge affecting the industry growth.

  • Neon gas is a noble gas commonly used in various industries, including lasers, electronics, military and defense, sensors, aviation, and lighting. Neon's emission spectrum produces red, green, orange, yellow, and other colors, making it essential for lighting technologies such as neon tubes in advertising and illuminating buildings. Neon is also used in cryogenic applications, rocket propulsion systems, particle colliders, wave meter tubes, and other high-tech equipment. Ukraine is a significant supplier of neon, with key companies like Cryoin and INGAS based there. However, the Russian invasion of Ukraine in 2022 led to the closure of Cryoin's manufacturing plants, causing a sharp financial crunch for the company. This event negatively impacted the semiconductor industry due to the rising costs of raw materials, including neon, used in semiconductor production. As a result, semiconductor manufacturers worldwide have faced challenges in procuring parts from Russia and Ukraine.
  • Neon's applications span various sectors, including the electronics industry, where it is used in semiconductors, LCDs, imaging, smartphones, and televisions. The gas is also used in lighting technologies, such as neon signs, billboards, and signages. In the military and defense sector, neon is used in defense equipment, lamps, and bulbs. In the aviation industry, neon is used in air separation units and fog lights. In the industrial sector, neon is used in cryogenic refrigeration, DUV lithography methods, and oxygen production facilities. Neon is often used in conjunction with other rare gases, such as krypton and argon, and is available in cylinders and tanks. Its unique properties make it an essential component in various industries, from consumer electronics to aerospace.

Exclusive Customer Landscape

The market forecasting report includes the adoption lifecycle of the market, market growth and forecasting, covering from the innovator's stage to the laggard's stage. It focuses on adoption rates in different regions based on penetration. Furthermore, the thre market report also includes key purchase criteria and drivers of price sensitivity to help companies evaluate and develop their market growth analysis strategies.

Neon Gas Market Share by Geography

 Customer Landscape

Key Companies & Market Insights

Companies are implementing various strategies, such as strategic alliances, neon gas market forecast, partnerships, mergers and acquisitions, geographical expansion, and product/service launches, to enhance their presence In the industry.

The industry research and growth report includes detailed analyses of the competitive landscape of the market and information about key companies, including:

  • Air Liquide SA
  • Air Products and Chemicals Inc.
  • Axcel Gases
  • Bhuruka Gases Ltd.
  • Chemix Gases
  • Chengdu Taiyu Industrial Gases Co. Ltd.
  • Cryoin Engineering Ltd.
  • Deluxe Industrial Gases
  • INGAS LLC
  • Jinhong Gas Co. Ltd.
  • Linde Plc
  • Merck KGaA
  • Messer SE and Co. KGaA
  • Mitsubishi Chemical Group Corp.
  • Proton Gases India Pvt. Ltd.
  • TEMC Co. LTD.
  • Wesfarmers Ltd.

Qualitative and quantitative analysis of companies has been conducted to help clients understand the wider business environment as well as the strengths and weaknesses of key industry players. Data is qualitatively analyzed to categorize companies as pure play, category-focused, industry-focused, and diversified; it is quantitatively analyzed to categorize companies as dominant, leading, strong, tentative, and weak.

Research Analyst Overview

Neon gas is a noble gas with a distinctive red-orange glow when in its gaseous state. It is one of several rare gases that are essential in various industries due to its unique properties. It finds extensive applications in various sectors, including lasers, electronics, military and defense, sensors, aviation, and lighting. In the realm of lasers, it is widely used in helium-neon lasers, which are renowned for their stability and high-quality beam. These lasers are extensively employed in holography, scanners, and spectroscopy. Neon gas is also utilized in wave meter tubes and plasma studies. The electronics sector relies on it for various applications, such as in vacuum tubes, glow lamps, and electron tubes. These components are integral to the functioning of electronic devices, including televisions, smartphones, and computers. It plays a crucial role in military and defense applications, particularly In the production of defense equipment. Its unique properties make it an essential component in various defense technologies, including sensors, illuminating devices, and rocket propulsion systems. The aviation industry utilizes it in various applications, including in lighting technologies for aircraft interiors and exterior signage. Neon lights are also commonly used in advertising, illuminating buildings and billboards. It is also used In the production of semiconductors, which are integral to various industries, including consumer electronics and the semiconductor sectors.

Neon gas is used In the fractional distillation process to separate and purify other gases, such as helium and argon. In the field of sensors, it is used in various applications, including blood analysis, particle counting, and food categorization. Its unique properties make it an effective medium for detecting and measuring various substances. It is used in cryogenic applications, including In the production of liquid air and in cryogenic refrigeration systems. It is also used in particle colliders and in the production of oxygen in oxygen production facilities. It is also used in various lighting technologies, including lamps, bulbs, and lighting products. Its distinctive red-orange glow makes it a popular choice for advertising signs and billboards. The noble gases, including neon, are located in Group 18 of the periodic table. It has a boiling point of -246.08°C and a gaseous condition at standard temperature and pressure. It emits light In the red part of the emission spectrum, with wavelengths ranging from approximately 611.1 to 632.3 nanometers. It is used in various lighting applications, including neon tubes and glass tubes.

Thus, these lighting technologies are commonly used in advertising signs, billboards, and lighting products. Neon tubes are also used in fog lights and lithography stages. It is used in various industrial applications, including In the oil and gas industry and in mining. It is transported and stored in cylinders and tanks for easy transportation and use. In summary, it is a versatile noble gas with a wide range of applications in various industries, including lasers, electronics, military and defense, sensors, aviation, and lighting. Its unique properties make it an essential component in various technologies and applications.

Market Scope

Report Coverage

Details

Page number

166

Base year

2023

Historic period

2018-2022

Forecast period

2024-2028

Growth momentum & CAGR

Accelerate at a CAGR of 7.55%

Market growth 2024-2028

USD 116.6 million

Market structure

Fragmented

YoY growth 2023-2024(%)

6.66

Key countries

Ukraine, Russia, China, US, and France

Competitive landscape

Leading Companies, Market Positioning of Companies, Competitive Strategies, and Industry Risks

Request Free Sample

What are the Key Data Covered in this Neon Gas Market Research and Growth Report?

  • CAGR of the Neon Gas industry during the forecast period
  • Detailed information on factors that will drive the growth and forecasting between 2024 and 2028
  • Precise estimation of the size of the market and its contribution of the industry in focus to the parent market
  • Accurate predictions about upcoming growth and trends and changes in consumer behaviour
  • Growth of the market across Europe, APAC, North America, Middle East and Africa, and South America
  • Thorough analysis of the market's competitive landscape and detailed information about companies
  • Comprehensive analysis of factors that will challenge the neon gas market growth of industry companies

We can help! Our analysts can customize this neon gas market research report to meet your requirements.

Get in touch

1 Executive Summary

  • 1.1 Market overview
    • Executive Summary - Chart on Market Overview
    • Executive Summary - Data Table on Market Overview
    • Executive Summary - Chart on Global Market Characteristics
    • Executive Summary - Chart on Market by Geography
    • Executive Summary - Chart on Market Segmentation by Application
    • Executive Summary - Chart on Market Segmentation by Distribution Channel
    • Executive Summary - Chart on Incremental Growth
    • Executive Summary - Data Table on Incremental Growth
    • Executive Summary - Chart on Company Market Positioning

2 Market Landscape

  • 2.1 Market ecosystem
    • Parent Market
    • Data Table on - Parent Market
  • 2.2 Market characteristics
    • Market characteristics analysis
  • 2.3 Value chain analysis
    • Value Chain Analysis

3 Market Sizing

  • 3.1 Market definition
    • Offerings of companies included in the market definition
  • 3.2 Market segment analysis
    • Market segments
  • 3.3 Market size 2023
    • 3.4 Market outlook: Forecast for 2023-2028
      • Chart on Global - Market size and forecast 2023-2028 ($ million)
      • Data Table on Global - Market size and forecast 2023-2028 ($ million)
      • Chart on Global Market: Year-over-year growth 2023-2028 (%)
      • Data Table on Global Market: Year-over-year growth 2023-2028 (%)

    4 Historic Market Size

    • 4.1 Global Neon Gas Market 2018 - 2022
      • Historic Market Size - Data Table on Global Neon Gas Market 2018 - 2022 ($ million)
    • 4.2 Application segment analysis 2018 - 2022
      • Historic Market Size - Application Segment 2018 - 2022 ($ million)
    • 4.3 Distribution Channel segment analysis 2018 - 2022
      • Historic Market Size - Distribution Channel Segment 2018 - 2022 ($ million)
    • 4.4 Geography segment analysis 2018 - 2022
      • Historic Market Size - Geography Segment 2018 - 2022 ($ million)
    • 4.5 Country segment analysis 2018 - 2022
      • Historic Market Size - Country Segment 2018 - 2022 ($ million)

    5 Five Forces Analysis

    • 5.1 Five forces summary
      • Five forces analysis - Comparison between 2023 and 2028
    • 5.2 Bargaining power of buyers
      • Bargaining power of buyers - Impact of key factors 2023 and 2028
    • 5.3 Bargaining power of suppliers
      • Bargaining power of suppliers - Impact of key factors in 2023 and 2028
    • 5.4 Threat of new entrants
      • Threat of new entrants - Impact of key factors in 2023 and 2028
    • 5.5 Threat of substitutes
      • Threat of substitutes - Impact of key factors in 2023 and 2028
    • 5.6 Threat of rivalry
      • Threat of rivalry - Impact of key factors in 2023 and 2028
    • 5.7 Market condition
      • Chart on Market condition - Five forces 2023 and 2028

    6 Market Segmentation by Application

    • 6.1 Market segments
      • Chart on Application - Market share 2023-2028 (%)
      • Data Table on Application - Market share 2023-2028 (%)
    • 6.2 Comparison by Application
      • Chart on Comparison by Application
      • Data Table on Comparison by Application
    • 6.3 Semiconductor - Market size and forecast 2023-2028
      • Chart on Semiconductor - Market size and forecast 2023-2028 ($ million)
      • Data Table on Semiconductor - Market size and forecast 2023-2028 ($ million)
      • Chart on Semiconductor - Year-over-year growth 2023-2028 (%)
      • Data Table on Semiconductor - Year-over-year growth 2023-2028 (%)
    • 6.4 Imaging and lighting - Market size and forecast 2023-2028
      • Chart on Imaging and lighting - Market size and forecast 2023-2028 ($ million)
      • Data Table on Imaging and lighting - Market size and forecast 2023-2028 ($ million)
      • Chart on Imaging and lighting - Year-over-year growth 2023-2028 (%)
      • Data Table on Imaging and lighting - Year-over-year growth 2023-2028 (%)
    • 6.5 Lasers - Market size and forecast 2023-2028
      • Chart on Lasers - Market size and forecast 2023-2028 ($ million)
      • Data Table on Lasers - Market size and forecast 2023-2028 ($ million)
      • Chart on Lasers - Year-over-year growth 2023-2028 (%)
      • Data Table on Lasers - Year-over-year growth 2023-2028 (%)
    • 6.6 Others - Market size and forecast 2023-2028
      • Chart on Others - Market size and forecast 2023-2028 ($ million)
      • Data Table on Others - Market size and forecast 2023-2028 ($ million)
      • Chart on Others - Year-over-year growth 2023-2028 (%)
      • Data Table on Others - Year-over-year growth 2023-2028 (%)
    • 6.7 Market opportunity by Application
      • Market opportunity by Application ($ million)
      • Data Table on Market opportunity by Application ($ million)

    7 Market Segmentation by Distribution Channel

    • 7.1 Market segments
      • Chart on Distribution Channel - Market share 2023-2028 (%)
      • Data Table on Distribution Channel - Market share 2023-2028 (%)
    • 7.2 Comparison by Distribution Channel
      • Chart on Comparison by Distribution Channel
      • Data Table on Comparison by Distribution Channel
    • 7.3 Cylinders - Market size and forecast 2023-2028
      • Chart on Cylinders - Market size and forecast 2023-2028 ($ million)
      • Data Table on Cylinders - Market size and forecast 2023-2028 ($ million)
      • Chart on Cylinders - Year-over-year growth 2023-2028 (%)
      • Data Table on Cylinders - Year-over-year growth 2023-2028 (%)
    • 7.4 Bulk and micro bulk - Market size and forecast 2023-2028
      • Chart on Bulk and micro bulk - Market size and forecast 2023-2028 ($ million)
      • Data Table on Bulk and micro bulk - Market size and forecast 2023-2028 ($ million)
      • Chart on Bulk and micro bulk - Year-over-year growth 2023-2028 (%)
      • Data Table on Bulk and micro bulk - Year-over-year growth 2023-2028 (%)
    • 7.5 On-site - Market size and forecast 2023-2028
      • Chart on On-site - Market size and forecast 2023-2028 ($ million)
      • Data Table on On-site - Market size and forecast 2023-2028 ($ million)
      • Chart on On-site - Year-over-year growth 2023-2028 (%)
      • Data Table on On-site - Year-over-year growth 2023-2028 (%)
    • 7.6 Market opportunity by Distribution Channel
      • Market opportunity by Distribution Channel ($ million)
      • Data Table on Market opportunity by Distribution Channel ($ million)

    8 Customer Landscape

    • 8.1 Customer landscape overview
      • Analysis of price sensitivity, lifecycle, customer purchase basket, adoption rates, and purchase criteria

    9 Geographic Landscape

    • 9.1 Geographic segmentation
      • Chart on Market share by geography 2023-2028 (%)
      • Data Table on Market share by geography 2023-2028 (%)
    • 9.2 Geographic comparison
      • Chart on Geographic comparison
      • Data Table on Geographic comparison
    • 9.3 Europe - Market size and forecast 2023-2028
      • Chart on Europe - Market size and forecast 2023-2028 ($ million)
      • Data Table on Europe - Market size and forecast 2023-2028 ($ million)
      • Chart on Europe - Year-over-year growth 2023-2028 (%)
      • Data Table on Europe - Year-over-year growth 2023-2028 (%)
    • 9.4 APAC - Market size and forecast 2023-2028
      • Chart on APAC - Market size and forecast 2023-2028 ($ million)
      • Data Table on APAC - Market size and forecast 2023-2028 ($ million)
      • Chart on APAC - Year-over-year growth 2023-2028 (%)
      • Data Table on APAC - Year-over-year growth 2023-2028 (%)
    • 9.5 North America - Market size and forecast 2023-2028
      • Chart on North America - Market size and forecast 2023-2028 ($ million)
      • Data Table on North America - Market size and forecast 2023-2028 ($ million)
      • Chart on North America - Year-over-year growth 2023-2028 (%)
      • Data Table on North America - Year-over-year growth 2023-2028 (%)
    • 9.6 Middle East and Africa - Market size and forecast 2023-2028
      • Chart on Middle East and Africa - Market size and forecast 2023-2028 ($ million)
      • Data Table on Middle East and Africa - Market size and forecast 2023-2028 ($ million)
      • Chart on Middle East and Africa - Year-over-year growth 2023-2028 (%)
      • Data Table on Middle East and Africa - Year-over-year growth 2023-2028 (%)
    • 9.7 South America - Market size and forecast 2023-2028
      • Chart on South America - Market size and forecast 2023-2028 ($ million)
      • Data Table on South America - Market size and forecast 2023-2028 ($ million)
      • Chart on South America - Year-over-year growth 2023-2028 (%)
      • Data Table on South America - Year-over-year growth 2023-2028 (%)
    • 9.8 Ukraine - Market size and forecast 2023-2028
      • Chart on Ukraine - Market size and forecast 2023-2028 ($ million)
      • Data Table on Ukraine - Market size and forecast 2023-2028 ($ million)
      • Chart on Ukraine - Year-over-year growth 2023-2028 (%)
      • Data Table on Ukraine - Year-over-year growth 2023-2028 (%)
    • 9.9 Russia - Market size and forecast 2023-2028
      • Chart on Russia - Market size and forecast 2023-2028 ($ million)
      • Data Table on Russia - Market size and forecast 2023-2028 ($ million)
      • Chart on Russia - Year-over-year growth 2023-2028 (%)
      • Data Table on Russia - Year-over-year growth 2023-2028 (%)
    • 9.10 China - Market size and forecast 2023-2028
      • Chart on China - Market size and forecast 2023-2028 ($ million)
      • Data Table on China - Market size and forecast 2023-2028 ($ million)
      • Chart on China - Year-over-year growth 2023-2028 (%)
      • Data Table on China - Year-over-year growth 2023-2028 (%)
    • 9.11 US - Market size and forecast 2023-2028
      • Chart on US - Market size and forecast 2023-2028 ($ million)
      • Data Table on US - Market size and forecast 2023-2028 ($ million)
      • Chart on US - Year-over-year growth 2023-2028 (%)
      • Data Table on US - Year-over-year growth 2023-2028 (%)
    • 9.12 France - Market size and forecast 2023-2028
      • Chart on France - Market size and forecast 2023-2028 ($ million)
      • Data Table on France - Market size and forecast 2023-2028 ($ million)
      • Chart on France - Year-over-year growth 2023-2028 (%)
      • Data Table on France - Year-over-year growth 2023-2028 (%)
    • 9.13 Market opportunity by geography
      • Market opportunity by geography ($ million)
      • Data Tables on Market opportunity by geography ($ million)

    10 Drivers, Challenges, and Opportunity/Restraints

    • 10.1 Market drivers
      • 10.2 Market challenges
        • 10.3 Impact of drivers and challenges
          • Impact of drivers and challenges in 2023 and 2028
        • 10.4 Market opportunities/restraints

          11 Competitive Landscape

          • 11.1 Overview
            • 11.2 Competitive Landscape
              • Overview on criticality of inputs and factors of differentiation
            • 11.3 Landscape disruption
              • Overview on factors of disruption
            • 11.4 Industry risks
              • Impact of key risks on business

            12 Competitive Analysis

            • 12.1 Companies profiled
              • Companies covered
            • 12.2 Market positioning of companies
              • Matrix on companies position and classification
            • 12.3 Air Liquide SA
              • Air Liquide SA - Overview
              • Air Liquide SA - Business segments
              • Air Liquide SA - Key news
              • Air Liquide SA - Key offerings
              • Air Liquide SA - Segment focus
            • 12.4 Air Products and Chemicals Inc.
              • Air Products and Chemicals Inc. - Overview
              • Air Products and Chemicals Inc. - Business segments
              • Air Products and Chemicals Inc. - Key news
              • Air Products and Chemicals Inc. - Key offerings
              • Air Products and Chemicals Inc. - Segment focus
            • 12.5 Axcel Gases
              • Axcel Gases - Overview
              • Axcel Gases - Product / Service
              • Axcel Gases - Key offerings
            • 12.6 Chemix Gases
              • Chemix Gases - Overview
              • Chemix Gases - Product / Service
              • Chemix Gases - Key offerings
            • 12.7 Chengdu Taiyu Industrial Gases Co. Ltd.
              • Chengdu Taiyu Industrial Gases Co. Ltd. - Overview
              • Chengdu Taiyu Industrial Gases Co. Ltd. - Product / Service
              • Chengdu Taiyu Industrial Gases Co. Ltd. - Key offerings
            • 12.8 Cryoin Engineering Ltd.
              • Cryoin Engineering Ltd. - Overview
              • Cryoin Engineering Ltd. - Product / Service
              • Cryoin Engineering Ltd. - Key offerings
            • 12.9 Deluxe Industrial Gases
              • Deluxe Industrial Gases - Overview
              • Deluxe Industrial Gases - Product / Service
              • Deluxe Industrial Gases - Key offerings
            • 12.10 INGAS LLC
              • INGAS LLC - Overview
              • INGAS LLC - Product / Service
              • INGAS LLC - Key offerings
            • 12.11 Jinhong Gas Co. Ltd.
              • Jinhong Gas Co. Ltd. - Overview
              • Jinhong Gas Co. Ltd. - Product / Service
              • Jinhong Gas Co. Ltd. - Key offerings
            • 12.12 Linde Plc
              • Linde Plc - Overview
              • Linde Plc - Business segments
              • Linde Plc - Key news
              • Linde Plc - Key offerings
              • Linde Plc - Segment focus
            • 12.13 Merck KGaA
              • Merck KGaA - Overview
              • Merck KGaA - Business segments
              • Merck KGaA - Key news
              • Merck KGaA - Key offerings
              • Merck KGaA - Segment focus
            • 12.14 Messer SE and Co. KGaA
              • Messer SE and Co. KGaA - Overview
              • Messer SE and Co. KGaA - Product / Service
              • Messer SE and Co. KGaA - Key offerings
            • 12.15 Mitsubishi Chemical Group Corp.
              • Mitsubishi Chemical Group Corp. - Overview
              • Mitsubishi Chemical Group Corp. - Business segments
              • Mitsubishi Chemical Group Corp. - Key news
              • Mitsubishi Chemical Group Corp. - Key offerings
              • Mitsubishi Chemical Group Corp. - Segment focus
            • 12.16 Proton Gases India Pvt. Ltd.
              • Proton Gases India Pvt. Ltd. - Overview
              • Proton Gases India Pvt. Ltd. - Product / Service
              • Proton Gases India Pvt. Ltd. - Key offerings
            • 12.17 Wesfarmers Ltd.
              • Wesfarmers Ltd. - Overview
              • Wesfarmers Ltd. - Product / Service
              • Wesfarmers Ltd. - Key offerings

            13 Appendix

            • 13.1 Scope of the report
              • 13.2 Inclusions and exclusions checklist
                • Inclusions checklist
                • Exclusions checklist
              • 13.3 Currency conversion rates for US$
                • Currency conversion rates for US$
              • 13.4 Research methodology
                • Research methodology
              • 13.5 Data procurement
                • Information sources
              • 13.6 Data validation
                • Data validation
              • 13.7 Validation techniques employed for market sizing
                • Validation techniques employed for market sizing
              • 13.8 Data synthesis
                • Data synthesis
              • 13.9 360 degree market analysis
                • 360 degree market analysis
              • 13.10 List of abbreviations
                • List of abbreviations

              Research Methodology

              Technavio presents a detailed picture of the market by way of study, synthesis, and summation of data from multiple sources. The analysts have presented the various facets of the market with a particular focus on identifying the key industry influencers. The data thus presented is comprehensive, reliable, and the result of extensive research, both primary and secondary.

              INFORMATION SOURCES

              Primary sources

              • Manufacturers and suppliers
              • Channel partners
              • Industry experts
              • Strategic decision makers

              Secondary sources

              • Industry journals and periodicals
              • Government data
              • Financial reports of key industry players
              • Historical data
              • Press releases

              DATA ANALYSIS

              Data Synthesis

              • Collation of data
              • Estimation of key figures
              • Analysis of derived insights

              Data Validation

              • Triangulation with data models
              • Reference against proprietary databases
              • Corroboration with industry experts

              REPORT WRITING

              Qualitative

              • Market drivers
              • Market challenges
              • Market trends
              • Five forces analysis

              Quantitative

              • Market size and forecast
              • Market segmentation
              • Geographical insights
              • Competitive landscape

              Interested in this report?

              Get your sample now to see our research methodology and insights!

              Download Now

              Frequently Asked Questions

              Neon Gas market growth will increase by $ 116.6 mn during 2024-2028 .

              The Neon Gas market is expected to grow at a CAGR of 7.55% during 2024-2028 .

              Neon Gas market is segmented by Application( Semiconductor, Imaging and lighting, Lasers, Others) Distribution Channel( Cylinders, Bulk and micro bulk, On-site)

              Air Liquide SA, Air Products and Chemicals Inc., Axcel Gases, Bhuruka Gases Ltd., Chemix Gases, Chengdu Taiyu Industrial Gases Co. Ltd., Cryoin Engineering Ltd., Deluxe Industrial Gases, INGAS LLC, Jinhong Gas Co. Ltd., Linde Plc, Merck KGaA, Messer SE and Co. KGaA, Mitsubishi Chemical Group Corp., Proton Gases India Pvt. Ltd., TEMC Co. LTD., Wesfarmers Ltd. are a few of the key vendors in the Neon Gas market.

              Europe will register the highest growth rate of 51% among the other regions. Therefore, the Neon Gas market in Europe is expected to garner significant business opportunities for the vendors during the forecast period.

              Ukraine, Russia, China, US, France

              • Increasing demand for ICsThe growing integration of integrated circuits (ICs) in automobiles is the driving factor this market.
              • consumer electronics is the driving factor this market.
              • and other electronic equipment has increased the demand for semiconductor chips in the market. The manufacturing of these chips requires neon gas in the lithography step is the driving factor this market.
              • which requires lasers carving into silicon to develop semiconductors. The imposition of stringent vehicle safety regulations across the world is compelling automotive OEMs to integrate advanced electronics in their vehicles to ensure driver safety. Vehicle safety systems that integrate automotive sensors include passenger airbags is the driving factor this market.
              • antilock braking systems (ABS) is the driving factor this market.
              • electronic stability control (ESC) is the driving factor this market.
              • traction control systems (TCS) is the driving factor this market.
              • and tire-pressure monitoring systems (TPMS). For example is the driving factor this market.
              • in the US is the driving factor this market.
              • the National Highway Traffic Safety Administration (NHTSA) has mandated the installation of TPMS in all vehicles that weigh less than 10 is the driving factor this market.
              • 000 lbs. This is compelling automotive OEMs to incorporate advanced safety systems is the driving factor this market.
              • for example is the driving factor this market.
              • forward collision warning is the driving factor this market.
              • lane departure warning is the driving factor this market.
              • front view camera systems is the driving factor this market.
              • backup aid (smart cameras) is the driving factor this market.
              • and autonomous braking systems is the driving factor this market.
              • in cars. The integration of a large number of semiconductor Ics in automobiles is accelerating the demand for Ics such as microcontroller units (MCUs) is the driving factor this market.
              • microprocessor units (MPUs) is the driving factor this market.
              • memory devices is the driving factor this market.
              • and power management Ics. Thus is the driving factor this market.
              • the increasing adoption of semiconductor Ics will drive the demand for neon gas for semiconductor chip production and is the driving factor this market.
              • in turn is the driving factor this market.
              • will drive the market in focus during the forecast period. is the driving factor this market.

              The Neon Gas market vendors should focus on grabbing business opportunities from the Semiconductor segment as it accounted for the largest market share in the base year.