
Nutraceutical Excipients Market Size 2025-2029
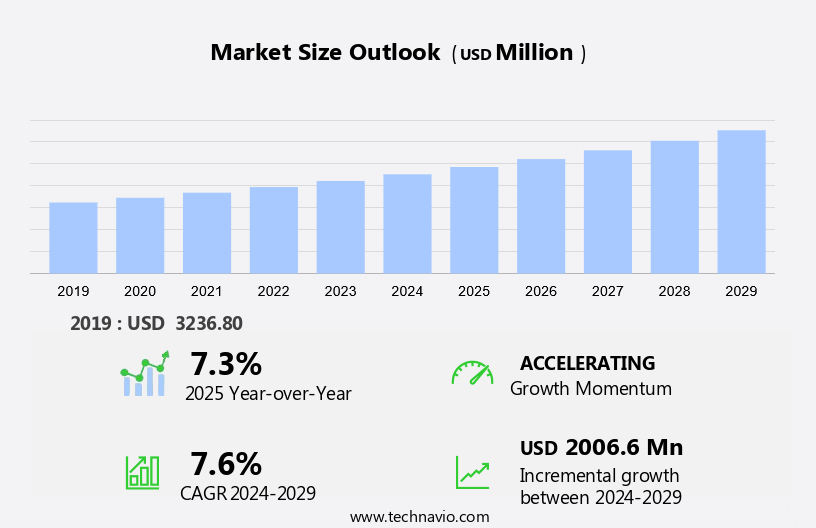
The nutraceutical excipients market size is forecast to increase by USD 2.01 billion, at a CAGR of 7.6% between 2024 and 2029.
- The market is experiencing significant growth due to several key drivers. The prevalence of chronic diseases, particularly in North America, is a major factor fueling market expansion. According to the Centers for Disease Control and Prevention (CDC), chronic diseases account for approximately 7 out of 10 deaths in the US each year. This has led to a rise in demand for nutraceuticals, which are often used as preventative measures or supplements to traditional treatments. Another growth driver is the increasing number of product launches in the market. Manufacturers are constantly innovating and introducing new formulations to cater to evolving consumer preferences. However, high research and development costs significantly challenge market growth. To stay competitive, companies must invest heavily in R&D to develop new and effective excipients that meet the stringent regulatory requirements.
What will be the Size of the Market During the Forecast Period?
- Nutraceutical excipients play a crucial role in the production of various nutritional supplements, functional foods, and beverages. These inactive ingredients enhance the functionality, stability, and efficacy of active nutraceutical ingredients. Absorption is a significant factor in the success of nutraceuticals, and excipients aid in optimizing this process. Manufacturing costs are a critical consideration in the nutraceutical industry. Excipients contribute to these costs, with factors such as waste generation and energy consumption being key concerns. Regulatory norms, including those related to safety and quality, also impact the production of nutraceutical excipients. Targeted delivery systems, such as taste masking and controlled release, are increasingly popular in the nutraceutical industry.
- Excipients like taste masking agents, analogous excipients, and disintegrants facilitate these systems, enhancing the palatability and consumer acceptance of nutraceuticals. Dissolution rates and particle size distribution are essential factors in the efficacy of nutraceuticals. Excipients like binders, fillers, and coating agents influence these properties, ensuring the optimal delivery of nutrients. The competitive environment in the market is intense, with companies striving for operational efficiency and product differentiation. Factors like consumer awareness, clean label trends, and lifestyle-related diseases drive innovation in the use of excipients. Elevated humidity, heat, light, oxygen, and other environmental factors can impact the stability and efficacy of nutraceuticals.
How is this market segmented and which is the largest segment?
The market research report provides comprehensive data (region-wise segment analysis), with forecasts and estimates in "USD billion" for the period 2025-2029, as well as historical data from 2019-2023 for the following segments.
- Type
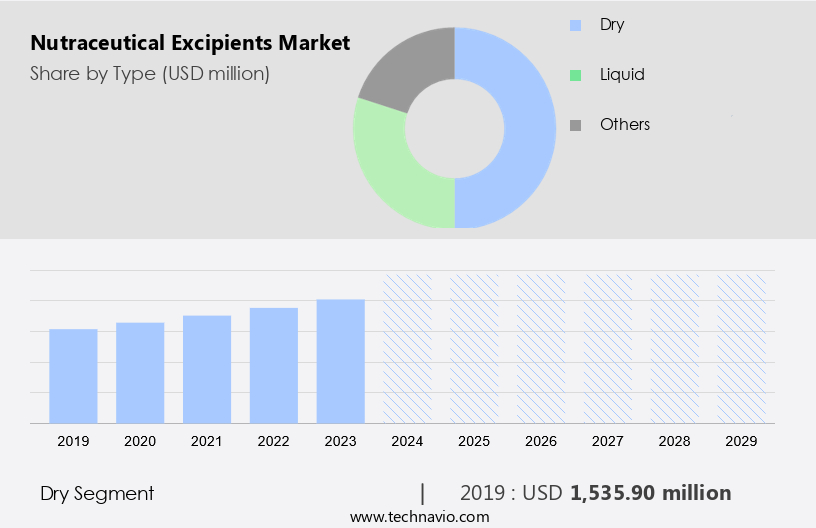
- Dry
- Liquid
- Others
- Source
- Organic chemicals
- Inorganic chemicals
- Others
- Geography
- North America
- US
- Europe
- Germany
- UK
- France
- Spain
- Asia
- China
- India
- Japan
- Rest of World (ROW)
- North America
By Type Insights
- The dry segment is estimated to witness significant growth during the forecast period.
The market is witnessing notable expansion due to the rising demand for label-friendly ingredients and innovative product launches. The nutritional products industry's continued growth, fueled by increasing health consciousness and improved ingredient transparency, is driving the market's demand for effective yet natural dry excipients.
Get a glance at the market report of share of various segments Request Free Sample
The dry segment was valued at USD 1.54 billion in 2019 and showed a gradual increase during the forecast period.
Regional Analysis
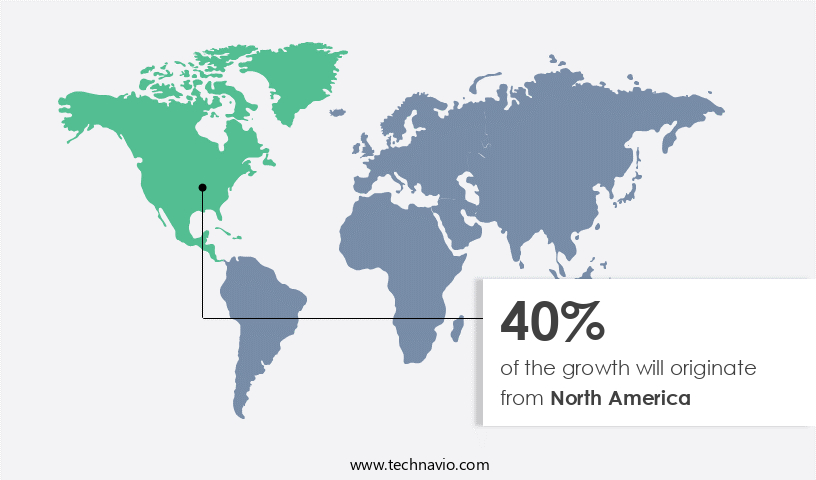
- North America is estimated to contribute 40% to the growth of the global market during the forecast period.
Technavio's analysts have elaborately explained the regional trends and drivers that shape the market during the forecast period.
For more insights on the market share of various regions Request Free Sample
The market is experiencing notable growth due to demographic shifts and rising healthcare expenditures. With an aging population, the number of individuals aged 65 and older in the United States and Canada is projected to increase by 47% by 2050, reaching 82 million. This demographic trend is accompanied by a significant rise in healthcare spending in both countries. In response, the nutraceutical industry is focusing on cost optimization through the use of excipients. Additionally, there is a growing demand for generic products and improved tablet disintegration. Regulatory compliance and bioavailability enhancement are also key considerations, as well as sustainability in nutraceutical production.
Market Dynamics
Our researchers analyzed the data with 2024 as the base year, along with the key drivers, trends, and challenges. A holistic analysis of drivers will help companies refine their marketing strategies to gain a competitive advantage.
What are the key market drivers leading to the rise in the adoption of the market?
The prevalence of chronic diseases is the key driver of the market.
- The market is experiencing significant growth due to the increasing prevalence of chronic diseases, such as cancer and heart disease. According to the American Cancer Society, approximately 1.9 million new cancer cases were diagnosed in the US in 2023, equating to around 5,370 new cases daily. With cancer being the second leading cause of death in the US, accounting for about 609,820 deaths or 1,670 deaths per day, there is a pressing need for effective nutraceutical products that can aid in cancer prevention and management. Nutraceuticals play a crucial role in preventive healthcare, and the demand for high-quality excipients that enhance their bioavailability, stability, and safety is on the rise.
- Excipients are essential components of nutraceutical formulations, and their selection, compatibility, and sustainability are critical to ensuring product efficacy, regulatory compliance, and consumer safety. Moreover, the trend towards personalized nutrition, functional foods, and sustainable agriculture is driving the demand for natural excipients that align with consumer preferences for clean labeling and eco-friendly production methods. Probiotics research, controlled release formulations, and weight management supplements are some of the key areas where nutraceutical excipients are making a significant impact. Sustainability is also a critical consideration in the nutraceutical industry, with a focus on reducing healthcare costs and minimizing the environmental impact of production processes.
- Innovations in food processing technology, ingredient sourcing, and drug delivery systems are helping to improve nutraceutical stability, safety, and efficacy while reducing waste and minimizing the use of synthetic additives. Regulatory compliance and quality control are also key challenges in the market. Stringent regulations governing nutraceutical labeling, clinical trial design, and safety testing require excipient manufacturers to prioritize transparency, traceability, and sustainability in their operations. Functional excipients, such as those with antioxidant properties, are gaining popularity as they offer multiple benefits and can enhance the overall nutritional value of nutraceutical products. In conclusion, the market in the US is driven by the rising prevalence of chronic diseases, the need for effective and sustainable nutraceutical products, and the trend towards personalized nutrition and functional foods.
What are the market trends shaping the market?
Product launches are the upcoming trend in the market.
- The market is experiencing a notable trend towards innovation, with a focus on cost optimization, regulatory compliance, and enhancing bioavailability and stability. Manufacturers are continually introducing new excipients to cater to specific formulation challenges and improve product performance. Additionally, there is a growing emphasis on sustainability in nutraceuticals, leading to the use of natural ingredients and sustainable agriculture practices. Probiotics research, controlled release formulations, and personalized nutrition are also driving market growth.
- Excipient selection plays a crucial role in nutraceutical labeling, safety, and clinical trial design. Stability testing, drug delivery systems, and ingredient sourcing are other critical factors influencing market dynamics. The market's focus on functional foods, immune system support, weight management, and chronic disease prevention is further fueling demand for nutraceutical excipients with antioxidant properties, improved food processing technology, and functional excipients. Quality control, natural excipients, and excipient sustainability are also key trends shaping the market.
What challenges does market face during the growth?
High research and development costs is a key challenge affecting the market growth.
- The market faces significant research and development costs, which can range from USD 20,000 to USD 500,000 per project, depending on the excipient type, production scale, and location. Custom and specialty excipients, requiring complex formulations and testing, typically have higher costs. Formulation development, analytical method development, and stability testing are crucial stages in the excipient development process. Cost optimization is a critical factor in the nutraceutical industry, particularly for generic products. Tablet disintegration, regulatory compliance, bioavailability enhancement, sustainability, and nutraceutical labeling are essential considerations for excipient selection. Natural ingredients, such as natural excipients, are increasingly popular due to their potential health benefits and consumer preference.
- Functional foods, nutritional supplements, and personalized nutrition are driving innovation in the nutraceutical market. Probiotics research, controlled release formulations, and sustainable agriculture are emerging trends. Nutraceutical safety, clinical trial design, and ingredient sourcing are essential for ensuring product efficacy, stability, and food safety. Functional excipients, such as those with antioxidant properties, can enhance nutraceutical efficacy. Drug delivery systems, weight management, mental health, sleep quality, digestive health, chronic disease prevention, and immune system support are key areas of application. Quality control, stability testing, and excipient compatibility are essential for ensuring product consistency and safety. Sustainability is a crucial factor in the nutraceutical industry, with a focus on reducing healthcare costs and promoting healthy aging.
Exclusive Customer Landscape
The market forecasting report includes the adoption lifecycle of the market, covering from the innovator's stage to the laggard's stage. It focuses on adoption rates in different regions based on penetration. Furthermore, the market report also includes key purchase criteria and drivers of price sensitivity to help companies evaluate and develop their market growth analysis strategies.

Customer Landscape
Key Companies & Market Insights
Companies are implementing various strategies, such as strategic alliances, market forecast , partnerships, mergers and acquisitions, geographical expansion, and product/service launches, to enhance their presence in the market.
Ajinomoto Co. Inc. - The company offers a full spectrum of multi-compendial-grade amino acids suitable for use in mammalian cell culture mediums, as excipients, and as active medicinal components.
The market research and growth report includes detailed analyses of the competitive landscape of the market and information about key companies, including:
- Amway Corp.
- Archer Daniels Midland Co.
- BASF SE
- Cargill Inc.
- DSM-Firmenich AG
- Glanbia plc
- GNC Holdings LLC
- Herbalife International of America Inc.
- International Flavors and Fragrances Inc.
- Lonza Group Ltd.
- Natures Bounty
- Nestle SA
- NOW Health Group Inc.
- Nutramax Laboratories Inc.
- Pharmavite LLC
- Reckitt Benckiser Group Plc
- Solgar Inc.
- Thorne HealthTech Inc.
Qualitative and quantitative analysis of companies has been conducted to help clients understand the wider business environment as well as the strengths and weaknesses of key market players. Data is qualitatively analyzed to categorize companies as pure play, category-focused, industry-focused, and diversified; it is quantitatively analyzed to categorize companies as dominant, leading, strong, tentative, and weak.
Research Analyst Overview
Cost Optimization Manufacturers are constantly seeking ways to reduce production costs while maintaining product quality. Excipients, which account for a significant portion of the nutraceutical formulation cost, are under close scrutiny. Generic excipients, which offer cost savings without compromising quality, are gaining popularity. However, the challenge lies in ensuring compatibility and consistency with active ingredients. Tablet Disintegration and Regulatory Compliance Tablet disintegration is a critical factor in nutraceutical efficacy. Proper disintegration ensures that the active ingredients are released in the intended part of the gastrointestinal tract. Regulatory bodies, such as the FDA and EMA, have set strict guidelines for tablet disintegration to ensure product safety and efficacy. Compliance with these regulations is essential for market entry and maintaining consumer trust. Bioavailability Enhancement Bioavailability is a significant concern in nutraceuticals, as the efficacy of a product depends on the amount of active ingredient that reaches the systemic circulation. Excipients play a vital role in enhancing bioavailability by improving solubility, stability, and absorption. For instance, lipid-based excipients are used to enhance the bioavailability of lipid-soluble nutraceuticals.
Moreover, nutraceutical Labeling Clear and accurate labeling is essential for consumer trust and regulatory compliance. Labeling must provide detailed information on ingredients, dosage, and potential allergens. Digital technologies, such as QR codes, are being explored to provide additional product information, enhancing transparency and consumer engagement. Nutraceutical Efficacy and Stability Testing Efficacy and stability testing are crucial aspects of nutraceutical development. Stability testing ensures that the product maintains its quality during storage and transportation. Efficacy testing, on the other hand, evaluates the product's ability to deliver the claimed health benefits. Both tests are essential for product approval and consumer trust. Drug Delivery Systems Advanced drug delivery systems, such as controlled release formulations and probiotics, offer several advantages, including improved efficacy, reduced side effects, and enhanced patient compliance.
Further, excipients must be safe for human consumption and must not interact adversely with active ingredients or other excipients. Stringent safety testing and regulatory compliance are essential to ensure product safety and consumer trust. Clinical Trial Design Clinical trials are an essential part of nutraceutical development, providing evidence of safety and efficacy. Proper excipient selection is crucial for trial success, as excipients can significantly impact trial outcomes. Compatibility, stability, and bioavailability are key considerations in excipient selection. Excipient Selection Excipient selection is a critical aspect of nutraceutical development, as excipients can significantly impact product quality, safety, and efficacy. Factors such as compatibility with active ingredients, stability, and cost are essential considerations in excipient selection. Probiotics Research Probiotics, live microorganisms that offer health benefits, are a significant segment of the nutraceutical industry.
|
Market Scope |
|
|
Report Coverage |
Details |
|
Page number |
203 |
|
Base year |
2024 |
|
Historic period |
2019-2023 |
|
Forecast period |
2025-2029 |
|
Growth momentum & CAGR |
Accelerate at a CAGR of 7.6% |
|
Market Growth 2025-2029 |
USD 2.01 billion |
|
Market structure |
Fragmented |
|
YoY growth 2024-2025(%) |
7.3 |
|
Key countries |
US, China, Germany, UK, France, Spain, Japan, Australia, India, and Brazil |
|
Competitive landscape |
Leading Companies, Market Positioning of Companies, Competitive Strategies, and Industry Risks |
What are the Key Data Covered in this Market Research and Growth Report?
- CAGR of the market during the forecast period
- Detailed information on factors that will drive the market growth and forecasting between 2025 and 2029
- Precise estimation of the size of the market and its contribution of the market in focus to the parent market
- Accurate predictions about upcoming market growth and trends and changes in consumer behaviour
- Growth of the market across North America, Europe, Asia, and Rest of World (ROW)
- Thorough analysis of the market's competitive landscape and detailed information about companies
- Comprehensive analysis of factors that will challenge the growth of market companies
We can help! Our analysts can customize this market research report to meet your requirements.
 RIA -
RIA - 
