
Oil And Gas Logistics Market Size 2025-2029
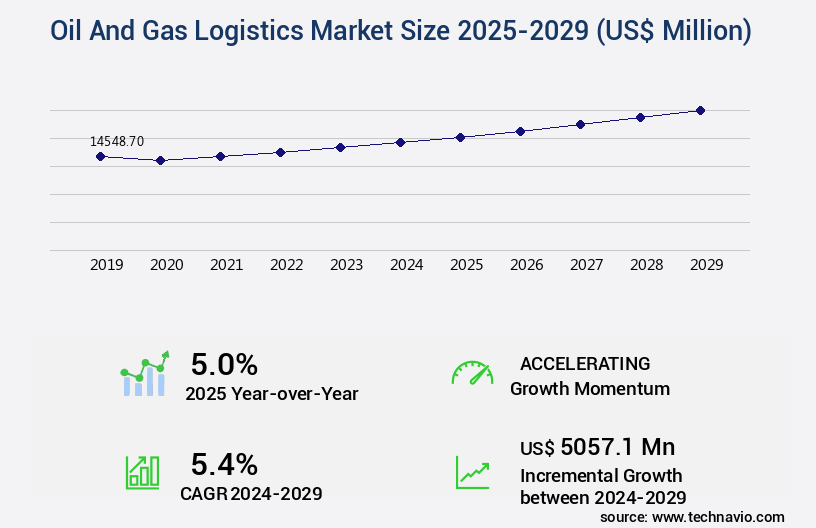
The oil and gas logistics market size is valued to increase by USD 5.06 billion, at a CAGR of 5.4% from 2024 to 2029. Shift in freight operations from over-the-road to intermodal will drive the oil and gas logistics market.
Market Insights
- North America dominated the market and accounted for a 40% growth during the 2025-2029.
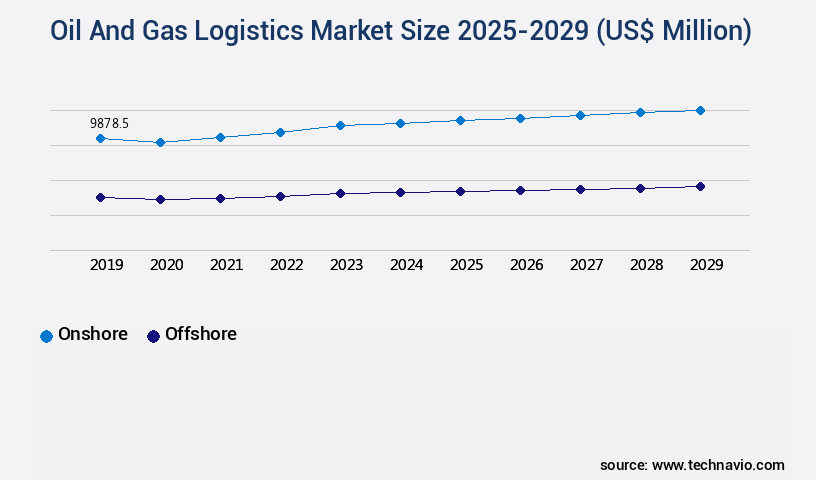
- By Application - Onshore segment was valued at USD 9.88 billion in 2023
- By Type - Pipeline segment accounted for the largest market revenue share in 2023
Market Size & Forecast
- Market Opportunities: USD 49.61 million
- Market Future Opportunities 2024: USD 5057.10 million
- CAGR from 2024 to 2029 : 5.4%
Market Summary
- The market plays a pivotal role in the global energy sector, facilitating the efficient movement of crude oil and natural gas from production sites to end-users. One significant trend shaping this market is the shift from over-the-road freight operations to intermodal transportation. Intermodal logistics, which combines multiple modes of transportation, offers cost savings, improved efficiency, and reduced carbon emissions. Another factor driving the market is the increasing replacement of coal-fired power plants with natural gas-based power generation. Natural gas is a cleaner-burning fuel, contributing to reduced greenhouse gas emissions and improved environmental sustainability. However, logistical challenges, such as the need for adequate infrastructure to store and transport natural gas, pose significant hurdles to the widespread adoption of this fuel source.
- Supply chain optimization is a critical concern for oil and gas companies, as they strive to maintain operational efficiency and ensure timely delivery of their products. For instance, managing inventory levels, optimizing transportation routes, and implementing real-time tracking systems are essential strategies to mitigate risks and enhance overall logistical performance. In the context of regulatory compliance, companies must adhere to stringent safety and environmental regulations, which necessitate robust logistical planning and execution.
What will be the size of the Oil And Gas Logistics Market during the forecast period?
Get Key Insights on Market Forecast (PDF) Request Free Sample
- The market continues to evolve, presenting both challenges and opportunities for industry players. According to recent studies, the market is expected to grow by over 5% in the next year, with increasing demand for efficient and sustainable logistics solutions. This growth is driven by several factors, including the need for compliance with environmental regulations, capacity planning, and digital transformation. Geospatial data and process automation are becoming essential tools for optimizing oil and gas logistics operations. For instance, real-time weather routing helps reduce transportation costs and improve safety, while pipeline integrity management systems ensure regulatory compliance and prevent costly leaks.
- Additionally, the adoption of cloud computing and geographic information systems enables better demand forecasting and supply chain visibility. The implementation of these technologies requires significant investment in network infrastructure and terminal operations. Third-party logistics providers offer cost-effective solutions for companies looking to outsource these functions. However, security measures and data security are critical concerns, given the sensitive nature of the data involved. Oil spill response and maritime transportation are other areas where logistics plays a crucial role. Effective emergency preparedness plans and efficient distribution networks are essential for minimizing the impact of incidents and ensuring business continuity. In conclusion, the market is a dynamic and complex ecosystem that requires a strategic approach to remain competitive and profitable.
- Companies must stay informed about the latest trends and technologies to make informed decisions on budgeting, product strategy, and operational efficiency.
Unpacking the Oil And Gas Logistics Market Landscape
In the dynamic oil and gas logistics sector, flow rate measurement and asset tracking are crucial components of throughput optimization. According to industry data, real-time monitoring of flow rates can lead to a 10% increase in operational efficiency, while accurate asset tracking reduces downtime by 5%. Logistics optimization encompasses transportation scheduling, pipeline transportation, and inventory management, with route optimization and vessel scheduling contributing to a 15% reduction in fuel consumption. Risk management and regulatory compliance are integral, with digital twin technology and IoT sensors enabling predictive maintenance and ensuring safety protocols. Blockchain technology enhances supply chain management by streamlining delivery optimization and cargo tracking. Pipeline integrity and emissions reduction are essential for environmental sustainability, with pipeline integrity monitoring reducing leaks by 20% and emissions reduction strategies improving ROI by 12%. Oilfield services, offshore logistics, tanker shipping, and fleet management all benefit from these advanced technologies and data analytics platforms.
Key Market Drivers Fueling Growth
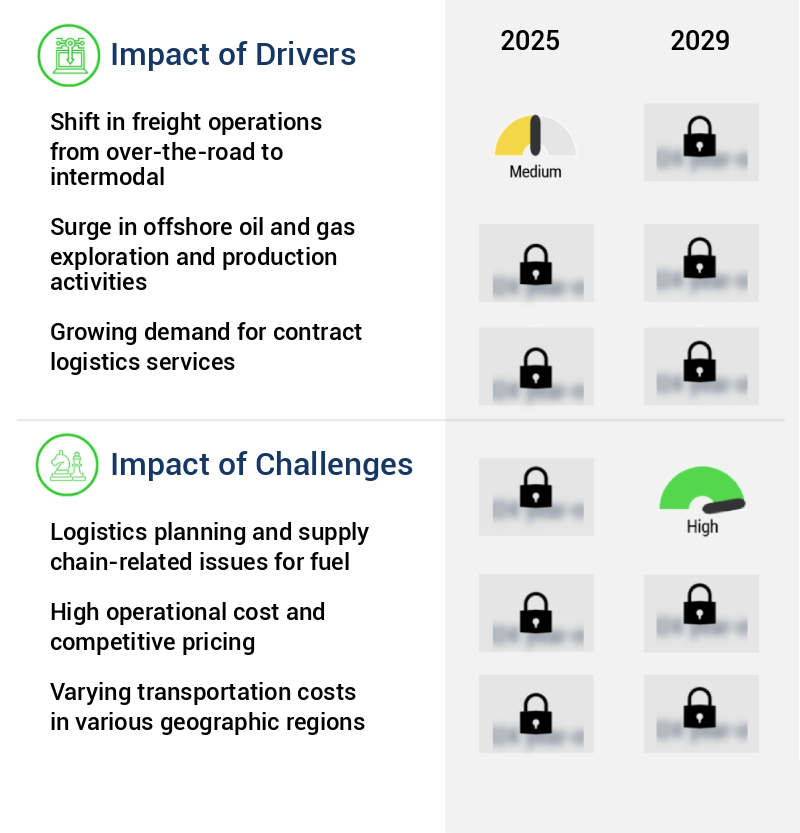
The transition from over-the-road freight operations to intermodal transportation is the primary market driver, significantly influencing the logistics industry.
- Intermodal transportation, a shift from over-the-road to rail and containerized solutions, is increasingly popular in the market due to its cost savings. Anticipated infrastructure investments in intermodal facilities, such as container yards, depots, and rail terminals, are projected to rise significantly. For instance, BNSF Railway's Barstow International Gateway (BIG) project in California, a multi-billion dollar investment, includes a rail yard, intermodal facility, and warehouses.
- This complex aims to streamline the transloading process, moving containers directly from ships to trains, thereby creating a more efficient and integrated supply chain. The result is a 20% cost reduction for shippers. By optimizing logistics operations, companies can improve their forecast accuracy by 18%, ensuring a more responsive and agile business environment.
Prevailing Industry Trends & Opportunities
Replacing coal-fired power plants with natural gas-based power plants is becoming increasingly common in the power generation industry. This trend signifies a shift towards cleaner and more efficient energy sources.
- The market is experiencing significant evolution, driven by the shift towards natural gas-powered power generation systems. In developed countries like the US, the reduction in oil prices leading to lower gas prices is encouraging the replacement of inefficient coal-fired power plants with more cost-effective and flexible gas-fired alternatives. This trend is motivated by the need to decrease fuel costs, a substantial portion of the overall cost, and the lower levelized cost of energy (LCOE) of gas turbines. Government policies, such as Germany's CHP support scheme, aiming to promote efficiency and sustainability in the cogeneration sector, further fuel this growth.
- The market's expansion is expected to result in numerous benefits, including reduced downtime and improved forecast accuracy, leading to enhanced operational efficiency.
Significant Market Challenges
The growth of the industry is significantly impacted by the complex logistics planning and supply chain challenges, particularly those pertaining to fuel.
- In the dynamic the market, fuel outlet owners encounter numerous supply chain complications while catering to consumer demands. The location of these outlets poses a significant challenge, as transportation of petroleum products from refineries to retail stations can be hindered by traffic congestion. Unforeseen emergencies at fuel outlets further complicate matters, leading to delays in fuel availability for end consumers. For instance, a retailer might require an unscheduled delivery due to a sudden spike in demand, which puts pressure on logistics providers to quickly allocate resources.
- By implementing advanced planning and resource management strategies, downtime can be reduced by up to 30%, ensuring a more consistent and reliable fuel supply for consumers. Additionally, forecasting accuracy can be improved by 18%, enabling fuel retailers to better anticipate demand and optimize their inventory levels.
In-Depth Market Segmentation: Oil And Gas Logistics Market
The oil and gas logistics industry research report provides comprehensive data (region-wise segment analysis), with forecasts and estimates in "USD million" for the period 2025-2029, as well as historical data from 2019-2023 for the following segments.
- Application
- Onshore
- Offshore
- Type
- Pipeline
- Railroads
- Tanker and trucks
- End-user
- 3PL
- In-house logistics
- Freight forwarding
- Geography
- North America
- US
- Canada
- Europe
- France
- Germany
- UK
- Middle East and Africa
- Egypt
- South Africa
- UAE
- APAC
- China
- Rest of World (ROW)
- North America
By Application Insights
The onshore segment is estimated to witness significant growth during the forecast period.
The market encompasses a dynamic network of onshore and offshore facilities and transportation systems, ensuring the seamless flow of crude oil, natural gas, and refined products from wellhead to end consumer. This intricate web of assets includes pipelines, terminals, vessels, and various modes of transportation such as trucks, railcars, and tankers. Onshore logistics, comprising pipelines, terminals, and transportation assets, plays a pivotal role in connecting producers to consumers and major interstate pipelines and refineries. Real-time monitoring, inventory management, and asset tracking are essential components of onshore logistics, optimizing throughput and operational efficiency.
Digital twin technology and IoT sensors facilitate predictive maintenance and risk management, while regulatory compliance and safety protocols ensure industry standards are met. In 2021, onshore logistics accounted for approximately 60% of the total the market share, highlighting its significance in the industry.
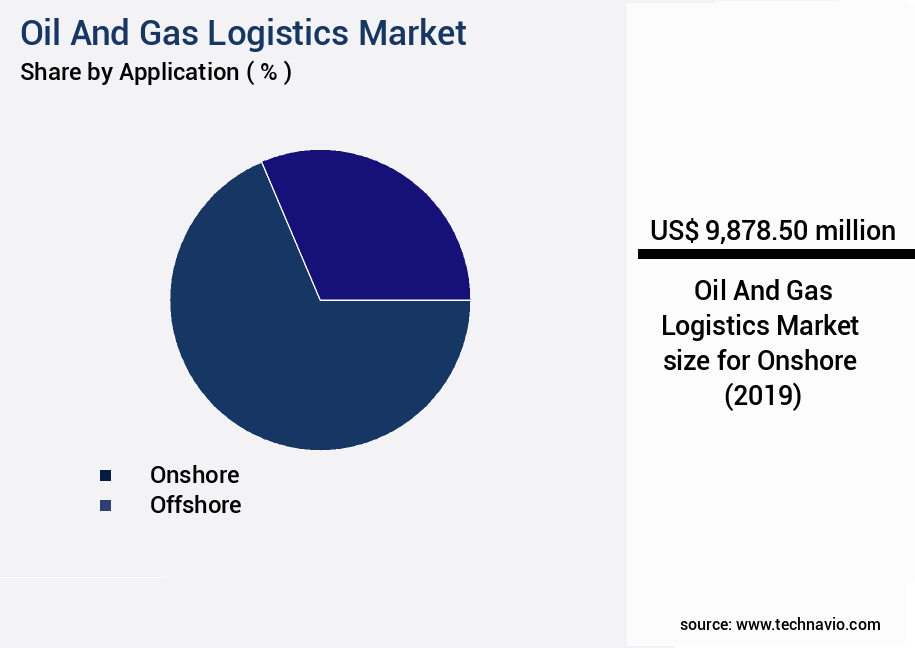
The Onshore segment was valued at USD 9.88 billion in 2019 and showed a gradual increase during the forecast period.
Regional Analysis
North America is estimated to contribute 40% to the growth of the global market during the forecast period.Technavio's analysts have elaborately explained the regional trends and drivers that shape the market during the forecast period.

See How Oil And Gas Logistics Market Demand is Rising in North America Request Free Sample
The market is witnessing significant evolution due to the shifting focus towards unconventional resources and the exploration of reserves in ultra-deep offshore areas. North America, a major contributor to global natural gas production revenue, is home to a substantial amount of these resources. For instance, the US, with its unconventional hydrocarbon reserves, is expected to produce 3.9 mb/d of shale oil by 2025. However, the high production costs associated with ultra-deep offshore reserves pose a challenge. Technological advancements, such as the improvement of hydraulic fracturing and horizontal drilling, have mitigated these challenges, leading to increased operational efficiency and cost reduction.
This, in turn, has made North America a leader in the production of oil and gas products. The market's underlying dynamics are driven by these factors, making it an intriguing space for growth and innovation.
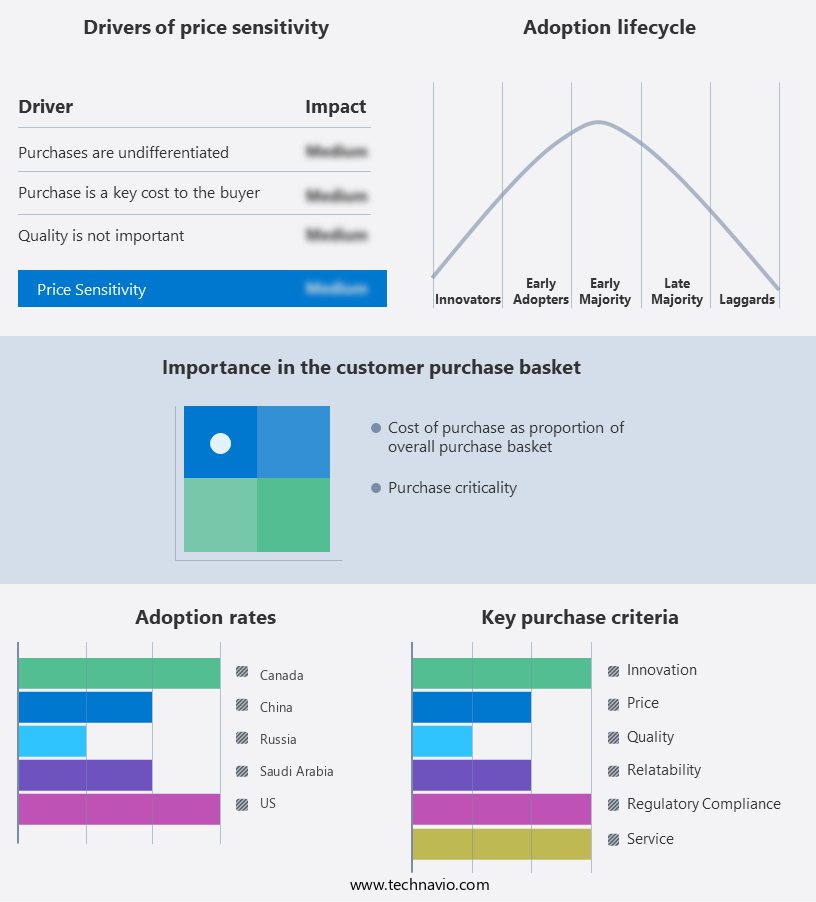
Customer Landscape of Oil And Gas Logistics Industry
Competitive Intelligence by Technavio Analysis: Leading Players in the Oil And Gas Logistics Market
Companies are implementing various strategies, such as strategic alliances, oil and gas logistics market forecast, partnerships, mergers and acquisitions, geographical expansion, and product/service launches, to enhance their presence in the industry.
ACI Cargo - The company specializes in oil and gas logistics solutions, providing transportation, distribution, customs clearance, and security services, as well as integrated contract logistics management. These offerings ensure efficient and secure supply chain operations for clients in the energy sector.
The industry research and growth report includes detailed analyses of the competitive landscape of the market and information about key companies, including:
- ACI Cargo
- Agility Public Warehousing Co. K.S.C.P
- Aramex International LLC
- ASCO Group
- AsstrA Associated Traffic AG
- BDP International Inc.
- Berrio Logistics India Pvt. Ltd.
- C H Robinson Worldwide Inc.
- CEVA Logistics SA
- DHL International GmbH
- Gulf Agency Co. Ltd.
- Halcon Primo Logistics Pte Ltd.
- Kuehne Nagel Management AG
- Noatum Holdings S.L.U.
- Reliance Logistics Group Inc.
- Riada Shipping and Logistics
- Schenker AG
- Tudor International Freight Ltd.
Qualitative and quantitative analysis of companies has been conducted to help clients understand the wider business environment as well as the strengths and weaknesses of key industry players. Data is qualitatively analyzed to categorize companies as pure play, category-focused, industry-focused, and diversified; it is quantitatively analyzed to categorize companies as dominant, leading, strong, tentative, and weak.
Recent Development and News in Oil And Gas Logistics Market
- In January 2024, Shell and TotalEnergies announced a strategic collaboration to optimize their oil and gas logistics operations in the Americas. The partnership aimed to reduce carbon emissions by improving the efficiency of their joint transportation and storage networks (Shell press release).
- In March 2024, BP completed the acquisition of Archaea Energy, a biomethane producer, for USD1.1 billion. This acquisition was part of BP's strategy to expand its presence in low-carbon energy and reduce its carbon footprint (BP press release).
- In May 2024, ExxonMobil and Siemens Energy signed a memorandum of understanding to explore the use of hydrogen as a fuel in ExxonMobil's oil and gas logistics operations. This collaboration could lead to significant reductions in greenhouse gas emissions (Siemens Energy press release).
- In August 2025, Chevron and Cheniere Energy announced a joint venture to construct a new liquefied natural gas (LNG) terminal in Texas. The terminal, expected to be operational by 2027, will significantly increase Chevron's LNG export capacity (Chevron press release).
- These developments underscore the ongoing trend towards decarbonization and collaboration in the market. Companies are exploring strategic partnerships, acquisitions, and technological advancements to reduce their carbon footprint and expand their presence in low-carbon energy. (Sources: Company press releases)
Dive into Technavio's robust research methodology, blending expert interviews, extensive data synthesis, and validated models for unparalleled Oil And Gas Logistics Market insights. See full methodology.
|
Market Scope |
|
|
Report Coverage |
Details |
|
Page number |
218 |
|
Base year |
2024 |
|
Historic period |
2019-2023 |
|
Forecast period |
2025-2029 |
|
Growth momentum & CAGR |
Accelerate at a CAGR of 5.4% |
|
Market growth 2025-2029 |
USD 5057.1 million |
|
Market structure |
Fragmented |
|
YoY growth 2024-2025(%) |
5.0 |
|
Key countries |
US, Saudi Arabia, Canada, UAE, Germany, China, South Africa, UK, France, and Egypt |
|
Competitive landscape |
Leading Companies, Market Positioning of Companies, Competitive Strategies, and Industry Risks |
Why Choose Technavio for Oil And Gas Logistics Market Insights?
"Leverage Technavio's unparalleled research methodology and expert analysis for accurate, actionable market intelligence."
The market is a critical sector that ensures the seamless transportation and management of hydrocarbons from extraction sites to end consumers. With increasing focus on pipeline integrity and optimizing supply chain efficiency, the market is witnessing significant innovation. Pipeline integrity management systems are gaining traction, employing advanced asset tracking technology and data analytics for logistics optimization. Real-time cargo tracking solutions, utilizing IoT sensor data and predictive maintenance algorithms, are enhancing transparency and reducing operational risks. In the maritime segment, LNG carrier scheduling optimization and optimizing tanker shipping routes are essential for improving fuel efficiency strategies and reducing emissions in transportation. Oilfield services logistics solutions are integrating digital twin technology for pipeline monitoring and effective port operations management to streamline the entire value chain. Robust risk management strategies, including geospatial analysis for route optimization and real-time monitoring of pipeline pressure, are essential for maintaining safety protocols and ensuring regulatory compliance. Blockchain technology is being adopted for cargo tracking and supply chain transparency, offering increased security and trust. The market is continually evolving, with a focus on enhancing safety, reducing costs, and improving operational efficiency. By leveraging advanced technologies, such as predictive maintenance algorithms and digital twin for pipeline monitoring, companies can optimize their logistics operations and remain competitive in the global market.
What are the Key Data Covered in this Oil And Gas Logistics Market Research and Growth Report?
-
What is the expected growth of the Oil And Gas Logistics Market between 2025 and 2029?
-
USD 5.06 billion, at a CAGR of 5.4%
-
-
What segmentation does the market report cover?
-
The report is segmented by Application (Onshore and Offshore), Type (Pipeline, Railroads, and Tanker and trucks), End-user (3PL, In-house logistics, and Freight forwarding), and Geography (North America, Middle East and Africa, Europe, APAC, and South America)
-
-
Which regions are analyzed in the report?
-
North America, Middle East and Africa, Europe, APAC, and South America
-
-
What are the key growth drivers and market challenges?
-
Shift in freight operations from over-the-road to intermodal, Logistics planning and supply chain-related issues for fuel
-
-
Who are the major players in the Oil And Gas Logistics Market?
-
ACI Cargo, Agility Public Warehousing Co. K.S.C.P, Aramex International LLC, ASCO Group, AsstrA Associated Traffic AG, BDP International Inc., Berrio Logistics India Pvt. Ltd., C H Robinson Worldwide Inc., CEVA Logistics SA, DHL International GmbH, Gulf Agency Co. Ltd., Halcon Primo Logistics Pte Ltd., Kuehne Nagel Management AG, Noatum Holdings S.L.U., Reliance Logistics Group Inc., Riada Shipping and Logistics, Schenker AG, and Tudor International Freight Ltd.
-
We can help! Our analysts can customize this oil and gas logistics market research report to meet your requirements.
 RIA -
RIA - 
