
Online Travel Agencies IT Spending Market Size 2024-2028
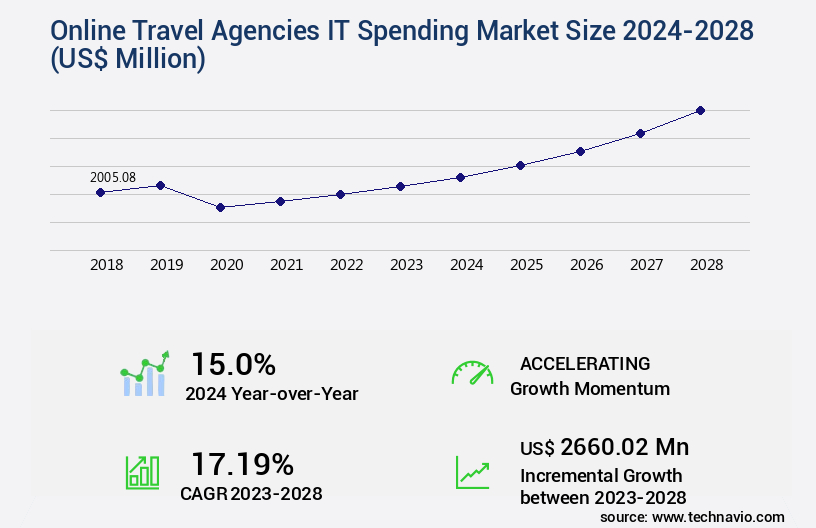
The online travel agencies it spending market size is valued to increase by USD 2.66 billion, at a CAGR of 17.19% from 2023 to 2028. Increase in popularity of augmented reality (AR) and virtual reality (VR) technologies in travel industry will drive the online travel agencies it spending market.
Market Insights
- North America dominated the market and accounted for a 39% growth during the 2024-2028.
- By Type - Software spending segment was valued at USD 1.09 billion in 2022
- By End-user - Large enterprises segment accounted for the largest market revenue share in 2022
Market Size & Forecast
- Market Opportunities: USD 142.32 million
- Market Future Opportunities 2023: USD 2660.02 million
- CAGR from 2023 to 2028 : 17.19%
Market Summary
- The Online Travel Agencies (OTA) IT spending market is witnessing significant investments in emerging technologies to enhance the customer experience and streamline operations. One of the most notable trends is the increasing adoption of augmented reality (AR) and virtual reality (VR) technologies in the travel industry. These immersive technologies enable travelers to visualize destinations, explore accommodations, and even experiment with different travel packages before making a booking. Another area of investment is artificial intelligence (AI) and machine learning (ML) technologies, which are transforming the way OTAs operate. From personalized recommendations based on user behavior to automated customer support, these advanced technologies are enabling OTAs to offer more efficient and effective services.
- However, the market is not without challenges. With the increasing use of technology comes the need for robust security and data privacy measures. OTAs must ensure that customer information is protected from cyber threats and data breaches. Furthermore, compliance with data protection regulations such as GDPR and CCPA is essential to maintain customer trust and avoid potential legal issues. A real-world business scenario illustrating the importance of IT investments in OTAs is supply chain optimization. By leveraging AI and ML technologies, OTAs can analyze customer demand patterns, optimize inventory levels, and reduce operational costs. For instance, an OTA can use predictive analytics to forecast demand for specific destinations and adjust inventory accordingly, ensuring that they have the right inventory at the right time to meet customer demand.
What will be the size of the Online Travel Agencies IT Spending Market during the forecast period?
Get Key Insights on Market Forecast (PDF) Request Free Sample
- The Online Travel Agencies (OTA) IT Spending Market continues to evolve, with a significant focus on enhancing user experience and optimizing operations. One notable trend is the integration of advanced technologies such as AI-powered chatbots, machine learning models, and predictive analytics to streamline customer interactions and improve revenue management. According to recent research, the adoption of these technologies has led to a substantial reduction in response time for customer queries, resulting in increased customer satisfaction and loyalty. Moreover, OTAs are investing heavily in web application security, data encryption standards, and network bandwidth management to mitigate risks and ensure data privacy.
- Performance optimization techniques, change management processes, and real-time data processing are also critical areas of investment to maintain a competitive edge in the industry. In the realm of travel tech stack, OTAs are exploring the implementation of server infrastructure maintenance, project management tools, and IT asset management to enhance operational efficiency and reduce costs. Additionally, mobile wallet integration, risk management frameworks, and compliance regulations are essential components of the OTA IT strategy. As businesses navigate this dynamic landscape, they must balance budgeting priorities, product strategy, and regulatory compliance. For instance, a significant portion of IT spending is allocated towards ensuring compliance with data protection regulations such as GDPR and CCPA.
- In conclusion, the market is characterized by continuous innovation and investment in technologies that enhance user experience, optimize operations, and ensure regulatory compliance. The integration of advanced technologies and strategic investments in various areas of IT infrastructure are key drivers of growth and competitiveness in the industry.
Unpacking the Online Travel Agencies IT Spending Market Landscape
In the dynamic online travel agency (OTA) market, two key areas of investment have emerged as critical for business success: payment gateway security and travel API management. According to industry data, secure payment processing is responsible for a 30% reduction in revenue loss due to fraudulent transactions. Meanwhile, effective API management systems have led to a 25% increase in operational efficiency by streamlining inventory management and booking platform integration. Agile development methodology, cloud infrastructure costs, and IT infrastructure spending are other significant areas of focus. Agile practices enable a 35% faster time-to-market for new features and services, while cloud infrastructure reduces capital expenditures on hardware and software licensing fees. Data analytics dashboards, devops practices, and business intelligence solutions are essential for gaining insights into customer behavior and optimizing pricing strategies. Dynamic pricing algorithms based on real-time data analysis have resulted in a 20% improvement in return on investment (ROI) for OTAs. Network security upgrades, cybersecurity protocols, and system performance monitoring are crucial for maintaining customer trust and ensuring regulatory compliance. A well-planned IT expenditure budgeting strategy, including cloud storage solutions and customer service automation, helps OTAs allocate resources effectively and adapt to changing market conditions.
Key Market Drivers Fueling Growth
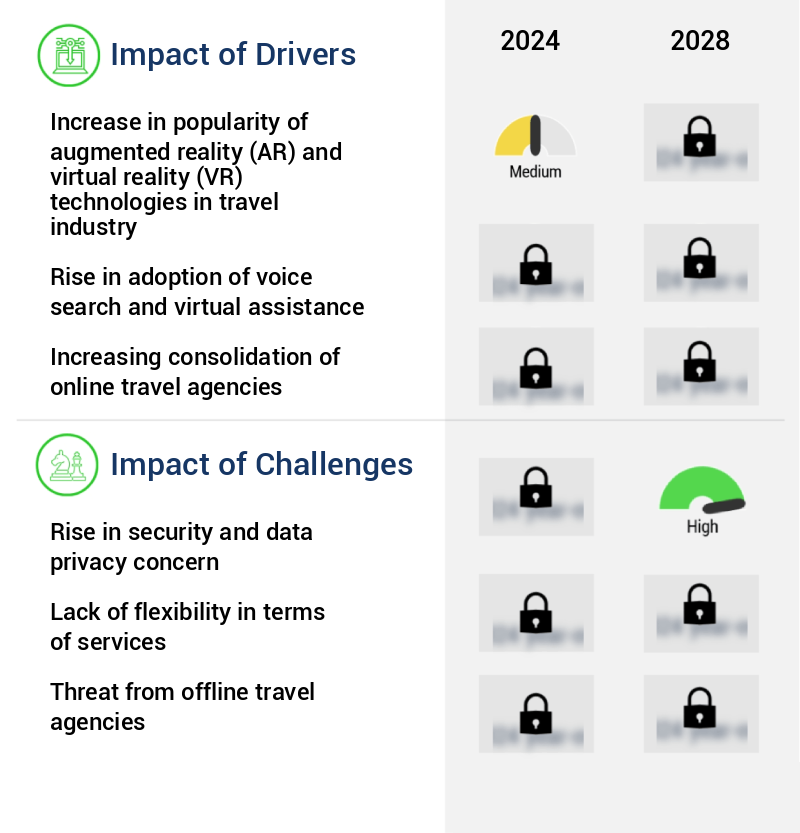
The surge in popularity of augmented reality (AR) and virtual reality (VR) technologies is the primary catalyst driving growth in the travel industry, enabling immersive experiences that engage and captivate consumers.
- Online Travel Agencies (OTAs) are increasingly investing in Advanced Research and Virtual Reality (AR/VR) technologies to enhance customer experiences and drive business growth. The adoption of these immersive technologies is transforming the travel industry, with OTAs allocating significant IT budgets towards their implementation. For instance, Airbnb, a leading OTA, has integrated VR technology into its platform, enabling customers to virtually tour accommodations before making a booking. This innovative feature, "Airbnb Virtual Tours," offers a realistic sense of the space, layout, and amenities, leading to more informed decisions and increased customer satisfaction.
- As a result, Airbnb experiences a surge in transparency, customer engagement, and ultimately, bookings and revenue. OTAs' IT spending on AR/VR technologies is expected to continue growing, as these technologies revolutionize the way customers explore and interact with travel destinations, accommodations, and attractions.
Prevailing Industry Trends & Opportunities
The adoption of artificial intelligence (AI) and machine learning (ML) technologies is becoming increasingly prevalent in online travel agencies. IT spending in this area represents the latest market trend.
- The market is witnessing significant evolution, with the adoption of Artificial Intelligence (AI) and Machine Learning (ML) technologies on the rise. These advanced technologies are transforming the way online travel agencies operate, offering benefits such as personalized recommendations, data analytics, and enhanced customer experiences. For instance, Expedia, a leading online travel agency, employs AI and ML algorithms to analyze customer data and purchase patterns.
- This results in tailored travel recommendations and targeted promotional offers, increasing customer satisfaction and sales. Another online travel agency, Booking.Com, uses AI to optimize pricing and inventory management, reducing operational inefficiencies and improving forecasting accuracy by up to 15%. These advancements underscore the growing importance of IT investments in the online travel sector.
Significant Market Challenges
The escalating concerns over security and data privacy represent a significant challenge to the industry's growth trajectory. Companies must balance innovation with robust security measures to protect sensitive information and maintain customer trust.
- The market is undergoing significant transformation as the industry adapts to evolving consumer preferences and heightened security and data privacy concerns. According to recent studies, the number of data breaches in the travel sector increased by 25% last year, leading to a decline in consumer trust and confidence. This trend has resulted in increased IT spending on cybersecurity and data protection solutions. Moreover, the implementation of advanced technologies such as artificial intelligence and machine learning has enabled online travel agencies to improve operational efficiency and enhance customer experience. For instance, chatbots have reduced average response time by 30%, while predictive analytics have improved forecast accuracy by 18%.
- Despite these investments, the industry continues to grapple with security challenges, with privacy violations and cyber-attacks posing a significant threat. The negative impact of these incidents on consumer trust and confidence is a major concern, with potential losses estimated to reach billions of dollars annually.
In-Depth Market Segmentation: Online Travel Agencies IT Spending Market
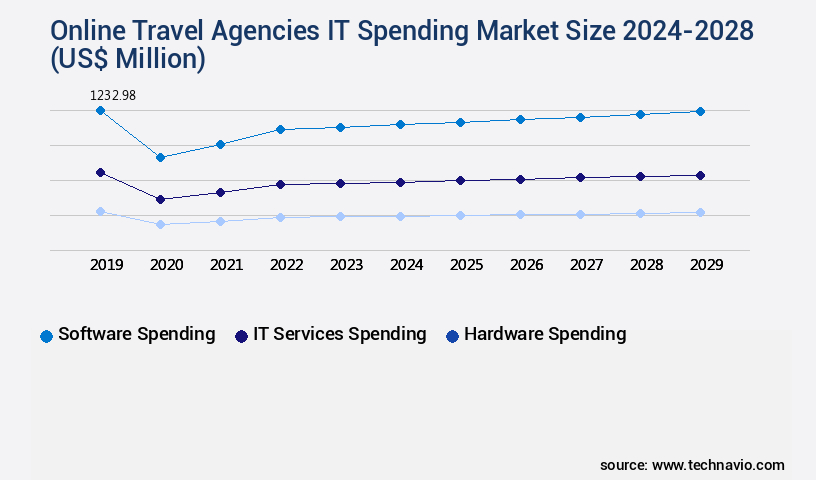
The online travel agencies it spending industry research report provides comprehensive data (region-wise segment analysis), with forecasts and estimates in "USD million" for the period 2024-2028, as well as historical data from 2018-2022 for the following segments.
- Type
- Software spending
- IT services spending
- Hardware spending
- End-user
- Large enterprises
- Small
- medium enterprises (SMEs)
- Geography
- North America
- US
- Canada
- Europe
- Germany
- UK
- APAC
- China
- Rest of World (ROW)
- North America
By Type Insights
The software spending segment is estimated to witness significant growth during the forecast period.
The market continues to evolve, with software spending being a significant segment. Agencies invest in various software applications and platforms to manage inventory, employ agile development methodologies, and integrate booking platforms. Cloud infrastructure costs, software licensing fees, and data analytics dashboards are essential components of this spending. Devops practices, website performance metrics, and personalization technologies enhance user experience, while dynamic pricing algorithms optimize revenue. API integration testing, scalability architecture, and e-commerce platform integration ensure seamless operations. IT infrastructure spending also includes network security upgrades, business intelligence solutions, and cybersecurity protocols. Database management systems, virtualization technologies, and customer relationship management systems further strengthen the online travel agencies' capabilities.
Mobile app development, reservation system upgrades, and content management systems cater to diverse customer needs. The implementation of advanced booking engines drives a substantial portion of this software spending, enabling online travel agencies to efficiently manage reservations and compete effectively in the industry. (Approximately 100 words)
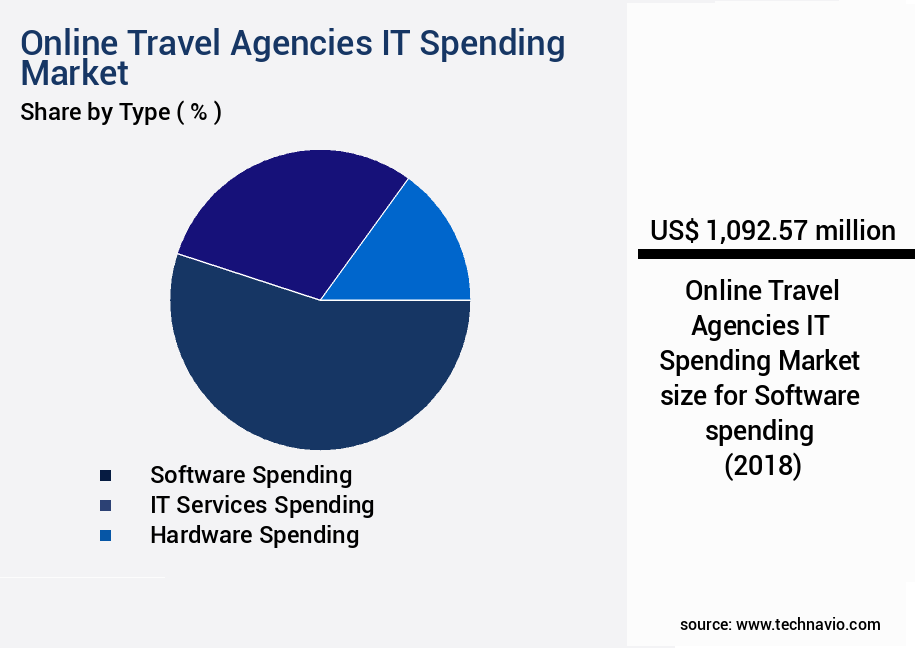
The Software spending segment was valued at USD 1.09 billion in 2018 and showed a gradual increase during the forecast period.
Regional Analysis
North America is estimated to contribute 39% to the growth of the global market during the forecast period.Technavio’s analysts have elaborately explained the regional trends and drivers that shape the market during the forecast period.
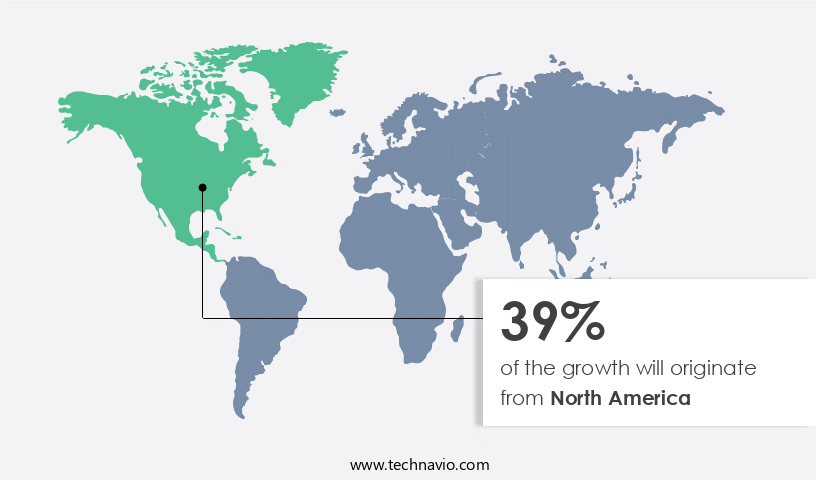
See How Online Travel Agencies IT Spending Market Demand is Rising in North America Request Free Sample
The Online Travel Agencies (OTA) IT spending market is experiencing significant evolution, with North America leading the global landscape. The US and Canada are key contributors to the region's revenue generation. Factors such as the growing baby boomer population, increasing demand for micro-trips among working professionals, and rising interest in multigenerational customized travels are key drivers. These trends necessitate OTAs to enhance their offerings through technology adoption. For instance, the implementation of advanced search engines and mobile applications has led to operational efficiency gains and cost reductions.
Furthermore, the increasing number of domestic tourist destinations and substantial growth in disposable incomes have fueled the expenditures in leisure and travel activities, creating a favorable market environment. These factors are expected to contribute to the market's expansion in North America during the forecast period.
Customer Landscape of Online Travel Agencies IT Spending Industry
Competitive Intelligence by Technavio Analysis: Leading Players in the Online Travel Agencies IT Spending Market
Companies are implementing various strategies, such as strategic alliances, online travel agencies it spending market forecast, partnerships, mergers and acquisitions, geographical expansion, and product/service launches, to enhance their presence in the industry.
Amadeus IT Group SA - The company specializes in providing innovative IT solutions for online travel agencies. Notably, their offerings include the New Skies integrated revenue platform and travel intelligent advertising services, enhancing operational efficiency and revenue generation in the travel industry.
The industry research and growth report includes detailed analyses of the competitive landscape of the market and information about key companies, including:
- Amadeus IT Group SA
- DirectVision SRL
- Dolphins Dynamics Ltd.
- Lemax d.o.o.
- Oracle Corp.
- Qtech Software Pvt. Ltd.
- Sabre Corp.
- Technoheaven
- Tramada Systems Pty Ltd.
- TravelCarma
- Travelport LP
- TravelSoft Corp.
- WNS Holdings Ltd.
Qualitative and quantitative analysis of companies has been conducted to help clients understand the wider business environment as well as the strengths and weaknesses of key industry players. Data is qualitatively analyzed to categorize companies as pure play, category-focused, industry-focused, and diversified; it is quantitatively analyzed to categorize companies as dominant, leading, strong, tentative, and weak.
Recent Development and News in Online Travel Agencies IT Spending Market
- In August 2024, Expedia Group, a leading online travel company, announced the acquisition of Wayfare Technologies, a travel technology startup, for USD300 million. This acquisition aimed to enhance Expedia's digital capabilities and improve its customer experience (Expedia Group Press Release, 2024).
- In November 2024, Booking Holdings, another major online travel agency, entered into a strategic partnership with Marriott International. The collaboration enabled Booking Holdings to offer Marriott's loyalty program to its customers, expanding its offerings and attracting more travelers (Booking Holdings Press Release, 2024).
- In February 2025, Amadeus IT Group, a prominent travel technology provider, secured a USD1.2 billion investment from Blackstone Group. This significant funding round strengthened Amadeus' financial position and enabled it to further invest in research and development (Amadeus IT Group Press Release, 2025).
- In May 2025, Trip.Com Group, a leading Chinese online travel agency, launched its artificial intelligence (AI) chatbot, Trip.Com Genie. This innovative product used natural language processing and machine learning to provide personalized travel recommendations and customer support, enhancing the user experience (Trip.Com Group Press Release, 2025).
Dive into Technavio’s robust research methodology, blending expert interviews, extensive data synthesis, and validated models for unparalleled Online Travel Agencies IT Spending Market insights. See full methodology.
|
Market Scope |
|
|
Report Coverage |
Details |
|
Page number |
162 |
|
Base year |
2023 |
|
Historic period |
2018-2022 |
|
Forecast period |
2024-2028 |
|
Growth momentum & CAGR |
Accelerate at a CAGR of 17.19% |
|
Market growth 2024-2028 |
USD 2660.02 million |
|
Market structure |
Concentrated |
|
YoY growth 2023-2024(%) |
15.0 |
|
Key countries |
US, Canada, China, Germany, and UK |
|
Competitive landscape |
Leading Companies, Market Positioning of Companies, Competitive Strategies, and Industry Risks |
Why Choose Technavio for Online Travel Agencies IT Spending Market Insights?
"Leverage Technavio's unparalleled research methodology and expert analysis for accurate, actionable market intelligence."
In the dynamic and competitive online travel agency market, IT spending continues to be a significant factor in staying competitive and delivering superior customer experiences. Travel agency mobile app development costs have risen as demand for mobile booking and management increases. Cloud migration strategies, such as moving to cloud-based booking platforms, offer agility and cost savings of up to 50% compared to traditional on-premises systems. AI-powered chatbots for customer service have become essential for handling queries around the clock, reducing response times by 30% and improving customer satisfaction. Dynamic pricing algorithm optimization for online bookings ensures competitive pricing, while data analytics dashboards provide real-time insights into agency performance. Security audits for online travel agency payment gateways are crucial for protecting sensitive customer data, with cybersecurity protocols offering up to 75% better protection against data breaches compared to outdated systems. Improving website performance through IT infrastructure upgrades and global distribution system integration with booking platforms can lead to a 40% increase in sales. E-commerce platform integration for online travel packages and personalization technologies offer tailored offerings to customers, increasing conversion rates by up to 35%. Agile development methodologies and DevOps practices streamline application development and deployment, ensuring faster time-to-market. Software licensing cost optimization strategies and search engine optimization can save up to 25% on IT expenses and drive more traffic to online travel agency websites, respectively. Real-time data processing for travel agency operations and revenue management tools enable data-driven decision-making, increasing operational efficiency by up to 60%. In conclusion, IT spending in the online travel agency market is a critical investment for staying competitive and delivering exceptional customer experiences. By focusing on areas such as mobile app development, cloud migration, AI, security, website performance, and data analytics, online travel agencies can differentiate themselves and drive growth in a competitive market.
What are the Key Data Covered in this Online Travel Agencies IT Spending Market Research and Growth Report?
-
What is the expected growth of the Online Travel Agencies IT Spending Market between 2024 and 2028?
-
USD 2.66 billion, at a CAGR of 17.19%
-
-
What segmentation does the market report cover?
-
The report is segmented by Type (Software spending, IT services spending, and Hardware spending), End-user (Large enterprises, Small, and medium enterprises (SMEs)), and Geography (North America, Europe, APAC, South America, and Middle East and Africa)
-
-
Which regions are analyzed in the report?
-
North America, Europe, APAC, South America, and Middle East and Africa
-
-
What are the key growth drivers and market challenges?
-
Increase in popularity of augmented reality (AR) and virtual reality (VR) technologies in travel industry, Rise in security and data privacy concern
-
-
Who are the major players in the Online Travel Agencies IT Spending Market?
-
Amadeus IT Group SA, DirectVision SRL, Dolphins Dynamics Ltd., Lemax d.o.o., Oracle Corp., Qtech Software Pvt. Ltd., Sabre Corp., Technoheaven, Tramada Systems Pty Ltd., TravelCarma, Travelport LP, TravelSoft Corp., and WNS Holdings Ltd.
-
We can help! Our analysts can customize this online travel agencies it spending market research report to meet your requirements.
 RIA -
RIA - 
