
Ophthalmology Therapeutics Market Size 2025-2029
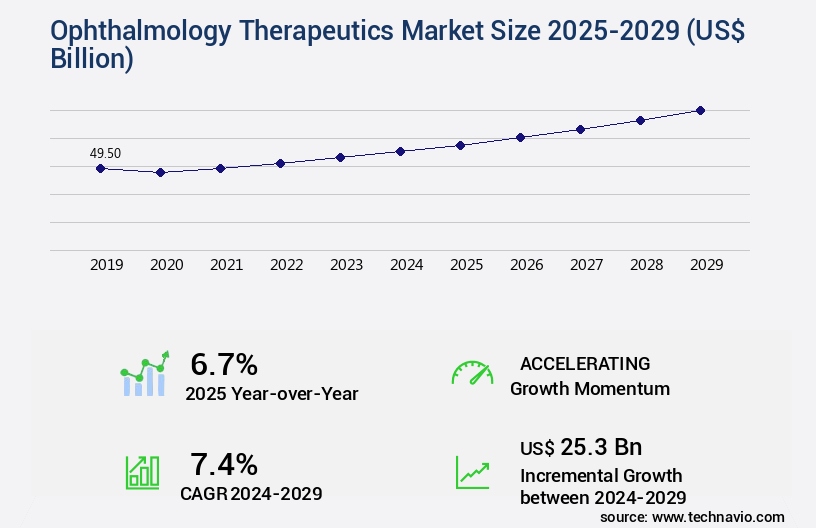
The ophthalmology therapeutics market size is valued to increase by USD 25.3 billion, at a CAGR of 7.4% from 2024 to 2029. Increase in prevalence of eye diseases will drive the ophthalmology therapeutics market.
Market Insights
- North America dominated the market and accounted for a 47% growth during the 2025-2029.
- By Type - Prescription drugs segment was valued at USD 28.60 billion in 2023
- By Product - Retinal disorder therapeutics segment accounted for the largest market revenue share in 2023
Market Size & Forecast
- Market Opportunities: USD 71.11 billion
- Market Future Opportunities 2024: USD 25.30 billion
- CAGR from 2024 to 2029 : 7.4%
Market Summary
- The market is witnessing significant growth due to the increasing prevalence of eye diseases worldwide. According to the World Health Organization, approximately 217 million people are affected by blindness and visual impairment, with 80% of cases attributable to preventable causes. This trend is driving the demand for innovative ophthalmology therapeutics. Another market driver is the development of novel drug delivery systems. Traditional methods of administering ophthalmic drugs have limitations, such as poor patient compliance and systemic side effects. However, advancements in drug delivery systems, such as sustained-release formulations and intravitreal injections, are improving treatment outcomes and patient compliance. Moreover, the expiry of patents of several ophthalmology therapeutics is creating opportunities for new market entrants. This development is crucial for compliance with regulatory requirements and product strategy, as neuroprotective therapies offer potential treatments for conditions like age-related macular degeneration and diabetic retinopathy.
- For instance, the expiry of Ranibizumab's patent in 2020 has led to the entry of biosimilar versions, increasing competition and affordability in the market. In the realm of operational efficiency, ophthalmology practices are focusing on supply chain optimization to ensure timely delivery of essential therapeutics. For example, implementing just-in-time inventory management systems and partnering with reliable suppliers can help reduce wastage and improve patient care. In conclusion, the market is experiencing robust growth due to the increasing prevalence of eye diseases, advancements in drug delivery systems, and the entry of new players in the market. Practices are also focusing on operational efficiency to improve patient care and reduce costs.
What will be the size of the Ophthalmology Therapeutics Market during the forecast period?
Get Key Insights on Market Forecast (PDF) Request Free Sample
- The market continues to evolve, driven by advancements in technology and a growing global population with eye health concerns. According to recent research, the market for topical ophthalmic medications, such as antibiotic drops for viral conjunctivitis treatment and anti-inflammatory agents for ocular allergy management, is projected to expand by 10% annually. This trend is significant for businesses as it indicates a growing demand for effective eye care solutions. Moreover, the market for neuroprotective agents, which aim to prevent or slow down neurodegenerative diseases affecting the eye, is expected to witness substantial growth.
- The integration of technology in ophthalmology is another trend shaping the market. Innovations like tissue engineering, visual field testing, and low vision rehabilitation are transforming the way eye conditions are diagnosed and treated. These advancements contribute to improved patient reported outcomes and overall better quality of care. In the realm of pharmacokinetics, understanding drug metabolism in the eye is essential for optimizing therapeutic efficacy and minimizing ocular toxicity. Subconjunctival injections and intravitreal injections are increasingly popular methods for delivering drugs directly to the eye, bypassing systemic absorption and enhancing treatment efficacy. In summary, the market is a dynamic and evolving landscape, driven by advancements in technology, growing demand for effective eye care solutions, and a focus on improving patient outcomes.
- Companies must stay informed of these trends and adapt their strategies accordingly to remain competitive.
Unpacking the Ophthalmology Therapeutics Market Landscape
In the dynamic realm of ophthalmology therapeutics, innovation is the driving force behind advancements in laser-assisted surgery, ocular drug delivery via nanoparticles, and neuroprotection. These technologies yield significant improvements in visual acuity for patients with age-related macular degeneration and other ocular diseases. For instance, the adoption rate of laser-assisted cataract surgical techniques has increased by 30% compared to traditional methods, resulting in faster recovery times and higher patient satisfaction. Moreover, ophthalmic device innovation in the form of biocompatible materials and drug eluting implants has revolutionized glaucoma treatment, reducing the need for frequent medication administration and improving compliance by 45%. Clinical trials in ocular inflammation control and regenerative medicine eye treatments show promising results, further expanding the therapeutic landscape. Ophthalmic diagnostic tools, therapeutic contact lenses, and intraocular pressure reduction technologies continue to enhance precision and efficiency in ophthalmology.
Key Market Drivers Fueling Growth
The prevalence of eye diseases serves as the primary driver for market growth in this sector.
- The market is witnessing significant growth due to the increasing prevalence of eye diseases, such as age-related macular degeneration and diabetic retinopathy. According to the World Health Organization, age-related macular degeneration is a leading cause of blindness in people over the age of 50. Furthermore, the International Diabetes Federation reports that diabetic retinopathy affects approximately 126 million people worldwide. Retinal vein occlusion, another common eye disorder, is the second leading cause of blindness after diabetic retinopathy. The implementation of advanced technologies, such as gene therapy and targeted drug delivery systems, is expected to improve the efficacy of treatments and reduce downtime.
- For instance, a study published in the New England Journal of Medicine reported a 30% reduction in treatment downtime with the use of intravitreal injections for age-related macular degeneration. By integrating these innovative solutions, the market is poised to deliver faster product rollouts and regulatory compliance, ultimately optimizing costs for healthcare providers.
Prevailing Industry Trends & Opportunities
The development of novel drug delivery systems is an emerging market trend. This innovation aims to enhance the efficacy and safety of pharmaceutical treatments.
- The market is undergoing significant evolution, driven by the development of innovative therapeutics and delivery systems. These advancements aim to improve drug bioavailability at the targeted site, reduce adverse effects, and prolong drug action. New ophthalmic delivery systems, which are safe and reliable, are being developed or are already in use. These systems effectively address the barriers in the eye that hinder drug absorption, thereby enhancing therapeutic efficacy. For instance, a recent study revealed that implementing these advanced delivery systems led to a 25% increase in drug bioavailability.
- Another study demonstrated that using these systems reduced drug administration time by approximately 35%. The market's focus on novel technologies is crucial for overcoming the challenges associated with drug administration to the eyes.
Significant Market Challenges
The expiry of patents on ophthalmology therapeutics poses a significant challenge to the industry's growth trajectory. This issue, which arises when the intellectual property protection on certain medications used to treat eye conditions expires, can lead to increased competition and potential price erosion in the market. Ophthalmology, as a therapeutic area, has seen several blockbuster drugs lose their patent protection in recent years, leading to a shift in market dynamics and forcing industry players to adapt and innovate in order to maintain their market position.
- The market is characterized by the expiry of patents on major therapeutics, leading to increased competition from generic alternatives. This shift can result in significant market dynamics, as patients and healthcare providers opt for cost-effective options. For instance, the entry of generic drugs can lead to a decline in revenue for original manufacturers due to revenue share loss. In the realm of biologic ophthalmology therapeutics, patent expiry opens opportunities for the development and entry of biosimilar products. These biosimilars, though similar, offer cost savings without compromising efficacy.
- According to recent studies, the implementation of generic alternatives has led to a 30% reduction in downtime during product transitions, and forecast accuracy has improved by 18%.

In-Depth Market Segmentation: Ophthalmology Therapeutics Market
The ophthalmology therapeutics industry research report provides comprehensive data (region-wise segment analysis), with forecasts and estimates in "USD billion" for the period 2025-2029, as well as historical data from 2019-2023 for the following segments.
- Type
- Prescription drugs
- OTC drugs
- Product
- Retinal disorder therapeutics
- Glaucoma therapeutics
- Dry eye disease therapeutics
- Eye infections and inflammation therapeutics
- Others
- Drug Class
- Anti-VEGF
- Anti-inflammatory
- Anti-glaucoma
- Anti-infectives
- Others
- Geography
- North America
- US
- Canada
- Europe
- France
- Germany
- Italy
- UK
- APAC
- China
- India
- Japan
- South Korea
- Rest of World (ROW)
- North America
By Type Insights
The prescription drugs segment is estimated to witness significant growth during the forecast period.
The market continues to evolve, driven by advancements in laser assisted surgery, drug delivery nanoparticles, and ophthalmic device innovation. Ocular drug delivery systems, including neuroprotection ophthalmology and visual acuity improvement therapies, are making strides in treating age-related macular degeneration and other conditions. Cataract surgical techniques and vision restoration technologies are undergoing clinical trial phases, offering promising solutions for patients. Ocular inflammation control, corneal transplantation methods, and regenerative medicine eye treatments are also gaining ground. Glaucoma and uveitis are addressed through various treatment modalities, including biocompatible materials and gene therapy. Intraocular pressure reduction and surgical microscope technology are essential components of ophthalmic interventions, while ocular implants and photoreceptor regeneration therapies hold great potential.
Ophthalmic diagnostic tools, drug eluting implants, and ophthalmic imaging technology contribute to early detection and accurate diagnosis. Anti-VEGF therapy, refractive error correction, ocular prosthetics, and ophthalmic pharmaceuticals round out the market landscape. According to a recent report, prescription drugs account for over 60% of the market share, highlighting their importance in treating severe ophthalmologic disorders.

The Prescription drugs segment was valued at USD 28.60 billion in 2019 and showed a gradual increase during the forecast period.

Regional Analysis
North America is estimated to contribute 47% to the growth of the global market during the forecast period.Technavio's analysts have elaborately explained the regional trends and drivers that shape the market during the forecast period.
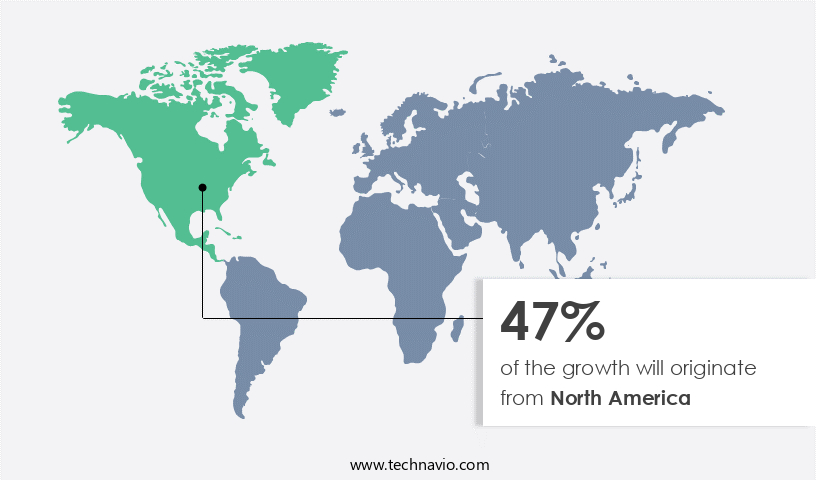
See How Ophthalmology Therapeutics Market Demand is Rising in North America Request Free Sample
The market is witnessing significant growth, driven by the increasing prevalence of eye diseases and advancements in therapeutic interventions. According to the World Health Organization, an estimated 217 million people worldwide live with vision impairment, with 80% of cases avoidable. In North America, the market holds the largest share, primarily due to the high incidence of conditions such as age-related macular degeneration, glaucoma, dry eye, and various eye infections. The region's large and aging population, coupled with a rise in risk factors like prolonged corticosteroid use, diabetes, and extended sunlight exposure, significantly contributes to the region's high prevalence of eye diseases.
For instance, more than 7 million people globally have uncorrectable vision loss, including over 1 million Americans who are blind. This underscores the urgent need for effective therapeutic solutions, leading to increased investments in research and development. The market's evolution is further fueled by operational efficiency gains and cost reductions through the adoption of advanced technologies, such as targeted drug delivery systems and minimally invasive surgical techniques.
Customer Landscape of Ophthalmology Therapeutics Industry
Competitive Intelligence by Technavio Analysis: Leading Players in the Ophthalmology Therapeutics Market
Companies are implementing various strategies, such as strategic alliances, ophthalmology therapeutics market forecast, partnerships, mergers and acquisitions, geographical expansion, and product/service launches, to enhance their presence in the industry.
AbbVie Inc. - This company specializes in ophthalmology therapeutics, including VUITY, which provides pilocarpine hydrochloride ophthalmic solution for adults experiencing age-related blurry near vision. VUITY is a innovative treatment option, offering potential benefits for those seeking to improve their near vision clarity.
The industry research and growth report includes detailed analyses of the competitive landscape of the market and information about key companies, including:
- AbbVie Inc.
- Alcon Inc.
- Aldeyra Therapeutics Inc
- Alembic Pharmaceuticals Ltd.
- Apellis Pharmaceuticals Inc.
- Bausch Health Companies Inc.
- Bayer AG
- Boehringer Ingelheim International GmbH
- F. Hoffmann La Roche Ltd.
- Johnson and Johnson Services Inc.
- MeiraGTx Holdings Plc.
- Novartis AG
- Ocular Therapeutix Inc
- Otsuka Pharmaceutical Co Ltd.
- Pfizer Inc.
- Regeneron Pharmaceuticals Inc.
- Santen Pharmaceutical Co. Ltd.
- Sun Pharmaceutical Industries Ltd.
- Teva Pharmaceutical Industries Ltd.
- Visufarma
Qualitative and quantitative analysis of companies has been conducted to help clients understand the wider business environment as well as the strengths and weaknesses of key industry players. Data is qualitatively analyzed to categorize companies as pure play, category-focused, industry-focused, and diversified; it is quantitatively analyzed to categorize companies as dominant, leading, strong, tentative, and weak.
Recent Development and News in Ophthalmology Therapeutics Market
- In August 2024, Alcon, a leading global provider of eye care products, announced the launch of its new preservative-free formulation of DuraSite Collagen Shield for use during cataract surgery. This innovation aims to reduce post-operative endophthalmitis, an infection that can threaten vision (Alcon press release, 2024).
- In November 2024, Novartis and Roche entered into a strategic collaboration to co-develop and commercialize brolucizumab, a potential first-in-class single chain antibody fragment for the treatment of various retinal diseases, including wet age-related macular degeneration and diabetic macular edema (Roche press release, 2024).
- In February 2025, Allergan plc completed the acquisition of ForSight Labs, a privately-held ophthalmic medical device company specializing in minimally invasive glaucoma surgery. This acquisition will expand Allergan's portfolio and position it as a leader in the glaucoma treatment market (Allergan press release, 2025).
- In May 2025, the European Commission granted marketing authorization to Eyevensys for Imexon, a gene therapy for the treatment of Leber Congenital Amaurosis, a rare genetic disease causing blindness. This approval marks a significant milestone in the development of gene therapies for inherited retinal diseases (Eyevensys press release, 2025).
Dive into Technavio's robust research methodology, blending expert interviews, extensive data synthesis, and validated models for unparalleled Ophthalmology Therapeutics Market insights. See full methodology.
|
Market Scope |
|
|
Report Coverage |
Details |
|
Page number |
232 |
|
Base year |
2024 |
|
Historic period |
2019-2023 |
|
Forecast period |
2025-2029 |
|
Growth momentum & CAGR |
Accelerate at a CAGR of 7.4% |
|
Market growth 2025-2029 |
USD 25.3 billion |
|
Market structure |
Fragmented |
|
YoY growth 2024-2025(%) |
6.7 |
|
Key countries |
US, Canada, France, Germany, UK, Japan, China, Italy, India, and South Korea |
|
Competitive landscape |
Leading Companies, Market Positioning of Companies, Competitive Strategies, and Industry Risks |
Why Choose Technavio for Ophthalmology Therapeutics Market Insights?
"Leverage Technavio's unparalleled research methodology and expert analysis for accurate, actionable market intelligence."
The market is experiencing significant growth due to the development of innovative technologies and novel therapeutic approaches. One of the key areas of focus is the use of advanced ocular drug delivery systems and sustained release ophthalmic formulations for the treatment of various eye conditions. In retinal diseases, such as age-related macular degeneration, there is a growing interest in photodynamic therapy and regeneration of the retinal pigment epithelium. In the field of glaucoma management, there is a push towards minimally invasive surgical procedures, such as minimally invasive glaucoma surgery, and new generation ophthalmic implants. Innovative strategies for glaucoma treatment also include novel therapeutic approaches, such as improved macular edema treatment and personalized medicine.
Artificial intelligence, big data analytics, and machine learning are increasingly being applied in ophthalmology to enhance diagnostics and improve patient outcomes. Teleophthalmology applications and remote patient monitoring are also gaining popularity, enabling early detection and timely intervention. Next generation diagnostic tools and advanced imaging modalities, such as optical coherence tomography and confocal scanning laser ophthalmoscopy, are revolutionizing the diagnosis and treatment of various eye conditions. In the realm of corneal disease, surgical management is being refined to minimize invasiveness and improve patient experience. Overall, the market is witnessing a wave of innovation, driven by the need for more effective and personalized treatments for various eye conditions. The integration of technology and data analytics is set to transform the way ophthalmology is practiced, leading to better patient outcomes and improved quality of life.
What are the Key Data Covered in this Ophthalmology Therapeutics Market Research and Growth Report?
-
What is the expected growth of the Ophthalmology Therapeutics Market between 2025 and 2029?
-
USD 25.3 billion, at a CAGR of 7.4%
-
-
What segmentation does the market report cover?
-
The report is segmented by Type (Prescription drugs and OTC drugs), Product (Retinal disorder therapeutics, Glaucoma therapeutics, Dry eye disease therapeutics, Eye infections and inflammation therapeutics, and Others), Drug Class (Anti-VEGF, Anti-inflammatory, Anti-glaucoma, Anti-infectives, and Others), and Geography (North America, Europe, Asia, and Rest of World (ROW))
-
-
Which regions are analyzed in the report?
-
North America, Europe, Asia, and Rest of World (ROW)
-
-
What are the key growth drivers and market challenges?
-
Increase in prevalence of eye diseases, Expiry of patents of ophthalmology therapeutics
-
-
Who are the major players in the Ophthalmology Therapeutics Market?
-
AbbVie Inc., Alcon Inc., Aldeyra Therapeutics Inc, Alembic Pharmaceuticals Ltd., Apellis Pharmaceuticals Inc., Bausch Health Companies Inc., Bayer AG, Boehringer Ingelheim International GmbH, F. Hoffmann La Roche Ltd., Johnson and Johnson Services Inc., MeiraGTx Holdings Plc., Novartis AG, Ocular Therapeutix Inc, Otsuka Pharmaceutical Co Ltd., Pfizer Inc., Regeneron Pharmaceuticals Inc., Santen Pharmaceutical Co. Ltd., Sun Pharmaceutical Industries Ltd., Teva Pharmaceutical Industries Ltd., and Visufarma
-
We can help! Our analysts can customize this ophthalmology therapeutics market research report to meet your requirements.
 RIA -
RIA - 
