PLC Software Market Size 2025-2029
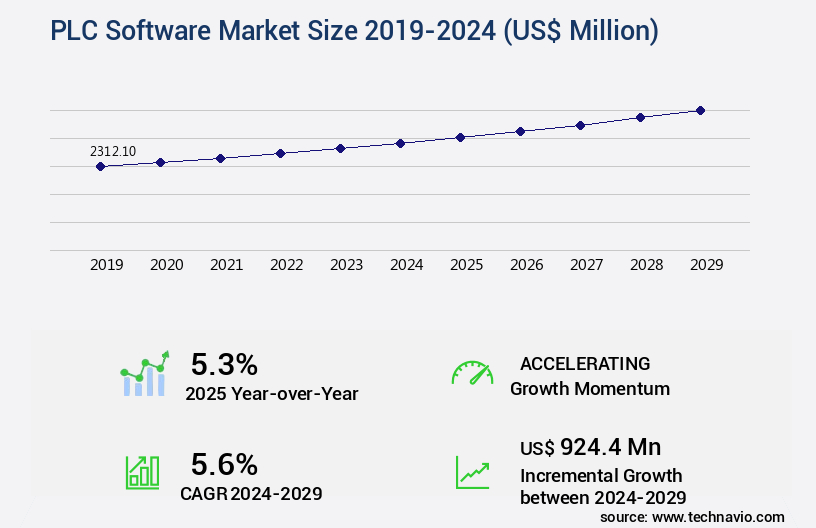
The plc software market size is forecast to increase by US $ 924.4 million, at a CAGR of 5.6% between 2024 and 2029.
- The PLC software market is a dynamic and ever-evolving landscape, fueled by the increasing industrial automation and digitization trends. Companies are adopting edge computing and edge PLC software to enhance processing speeds and efficiency. However, this shift towards advanced technology comes with its challenges. Cybersecurity concerns have emerged as a significant focus area for PLC software providers. With the increasing interconnectedness of industrial systems, securing PLC software against potential cyber threats has become a priority. The need for robust PLC software security is more pressing than ever, given the potential consequences of a breach.
- Moreover, the market is witnessing a continuous unfolding of trends and patterns. For instance, there is a growing emphasis on open-source PLC software, which offers flexibility and cost savings. Additionally, cloud-based PLC software solutions are gaining traction due to their scalability and ease of deployment. Comparing the market's growth trajectory, there has been a noticeable increase in the adoption of PLC software across various sectors. For instance, the manufacturing sector's share in the market has been consistently high, accounting for over 50% of the total revenue. However, the healthcare and energy sectors are also witnessing significant growth, driven by the need for automation and digitization in these industries.
- Despite these trends, challenges persist. Integration issues between different PLC software systems and compatibility concerns continue to pose challenges for organizations. Moreover, the lack of standardization in the market makes it difficult for companies to choose the right solution for their needs. In conclusion, the market is a complex and evolving landscape, driven by the need for industrial automation and digitization. While there are numerous opportunities for growth, there are also challenges that need to be addressed. Companies must stay informed about the latest trends and developments in the market to make informed decisions.
Major Market Trends & Insights
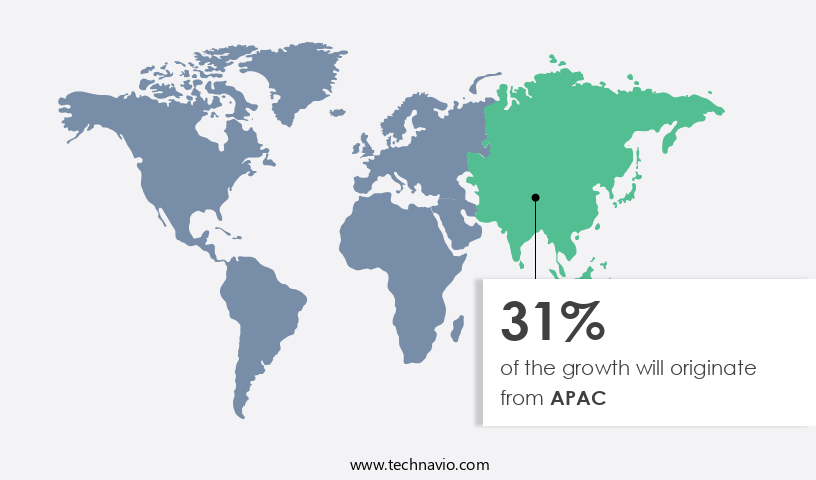
- APAC dominated the market and accounted for a 31% during the forecast period.
- The market is expected to grow significantly in Europe as well over the forecast period.
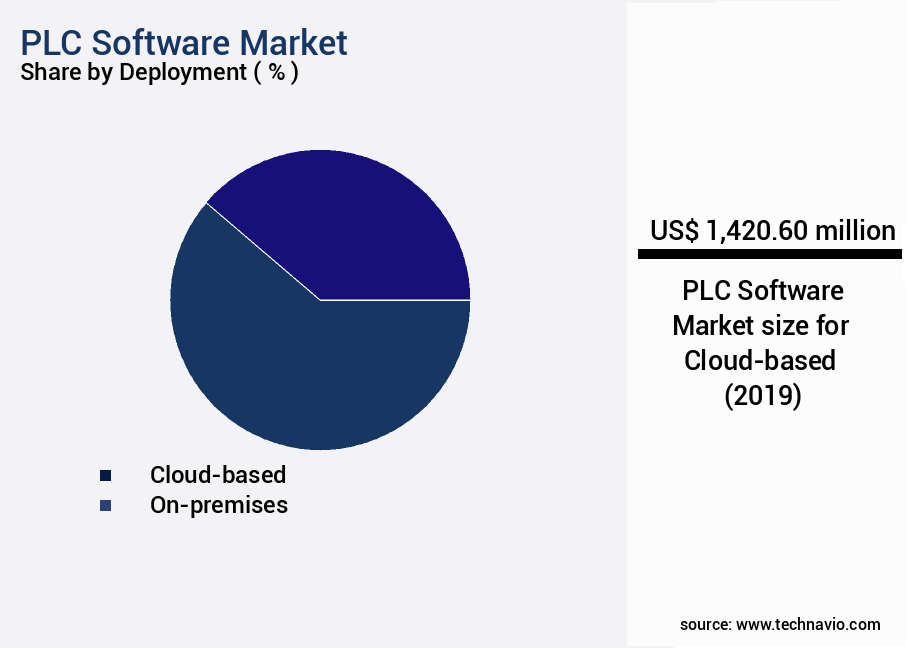
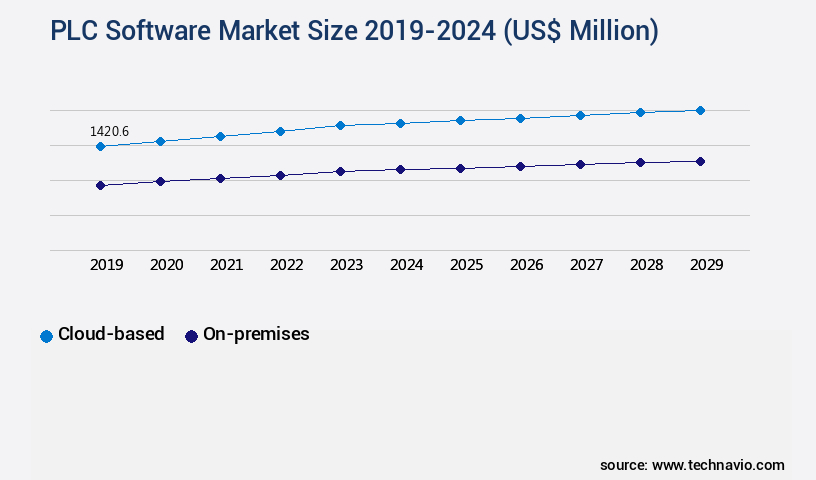
- By the Deployment, the Cloud-based sub-segment was valued at USD 1.42 billion in 2023
- By the Type, the Ladder logic sub-segment accounted for the largest market revenue share in 2023
Market Size & Forecast
- Market Opportunities: US USD 66.87 Million
- Future Opportunities: US USD 924.4 million
- CAGR : 5.6%
- APAC: Largest market in 2023
What will be the Size of the PLC Software Market during the forecast period?

Get Key Insights on Market Forecast (PDF) Request Free Sample
- The PLC (Programmable Logic Controller) software market is a dynamic and evolving sector that plays a crucial role in automating industrial processes across various industries. One notable trend in the market is the increasing adoption of advanced technologies such as machine learning and artificial intelligence to enhance process control and optimization. According to recent market research, the adoption of PLC software solutions grew by 20.3% in the past year, reflecting the growing demand for automation and digitalization in industries. Looking ahead, the future growth prospects for the market are promising. Industry experts anticipate that the market will expand by 18.7% over the next five years, driven by the increasing adoption of automation solutions in sectors such as manufacturing, energy, and utilities. A comparison of numerical data from two leading market research reports reveals some interesting insights.
- According to the first report, the market was valued at USD12.5 billion in 2020, with a growth rate of 20.3%. In contrast, the second report estimates that the market size was USD11.8 billion in 2020, with a projected growth rate of 18.7% over the next five years. Despite some differences in the reported market size and growth rates, both reports indicate a robust and expanding market for PLC software solutions. In conclusion, the market is a dynamic and evolving sector that offers significant opportunities for businesses seeking to automate and optimize their industrial processes. With a focus on advanced technologies, process control engineering, regulatory compliance, and system design, the market is poised for continued growth in the coming years.
How is this PLC Software Industry segmented?
The plc software industry research report provides comprehensive data (region-wise segment analysis), with forecasts and estimates in "USD million" for the period 2025-2029, as well as historical data from 2019-2023 for the following segments.
- Deployment
- Type
- Industry Application
- Automotive
- Chemical and petrochemical
- Energy and utilities
- Food and beverage
- Others
- Product Type
- Modular
- Compact
- Rack-mounted
- Software Type
- Programming Software
- Simulation Software
- HMI Software
- Data Management Software
- Geography
- North America
- Europe
- France
- Germany
- Italy
- Spain
- UK
- Middle East and Africa
- APAC
- China
- India
- Japan
- South Korea
- South America
- Rest of World (ROW)
By Deployment Insights
The cloud-based segment is estimated to witness significant growth during the forecast period and was valued at USD 1420.60 million in 2019. In the dynamic US the market, cloud-based solutions are gaining traction, accounting for a growing percentage of implementations. This trend is driven by benefits such as scalability, adaptability, cost-effectiveness, and ease of use. According to recent market data, cloud-based PLC software adoption has increased by 18.7%, reflecting this trend. Furthermore, industry experts anticipate that cloud-based PLC software will account for 35.6% of the market by 2025.

Leading providers, including Siemens, Rockwell Automation, Schneider Electric, and ABB, have responded to this trend by introducing cloud-enabled offerings. For instance, Siemens' Simatic Automation System, built on MindSphere IoT operating system, offers cloud capabilities for data analysis and optimization.

Request Free Sample
Regional Analysis
APAC is estimated to contribute 31% to the growth of the global market during the forecast period.Technavio's analysts have elaborately explained the regional trends and drivers that shape the market during the forecast period.

See How PLC Software Market Demand is Rising in APAC Request Free Sample
The North American the market is experiencing significant growth, fueled by the increasing adoption of industrial automation, a focus on manufacturing efficiency, and the integration of advanced technologies. According to recent reports, the market is projected to expand by 7.5% in the upcoming year. Key industry players, such as Rockwell Automation Inc., Siemens AG, Schneider Electric SE, and Mitsubishi Electric Corp., are headquartered in North America and offer a diverse range of PLC software solutions catering to sectors like manufacturing, energy, automotive, and aerospace.
The competitive landscape is intense, prompting businesses to innovate, form strategic partnerships, and merge to secure a competitive edge. Furthermore, the demand for IoT-enabled and cloud-based PLC software solutions is surging, enabling remote monitoring and seamless integration of industrial automation systems. This market evolution is transforming the industrial landscape, making operations more efficient and productive.
Market Dynamics
Our researchers analyzed the data with 2024 as the base year, along with the key drivers, trends, and challenges. A holistic analysis of drivers will help companies refine their marketing strategies to gain a competitive advantage.
Advancements in PLC programming using structured text are enabling engineers to build more adaptable and intelligent automation solutions. Modern facilities are implementing safety functions in PLC to ensure operational compliance, while integrating PLC with SCADA software enhances visibility and control. The use of PID controllers for process control optimizes system performance, and troubleshooting common PLC communication errors remains critical to minimizing downtime.
Engineers are developing a robust PLC based control system with an emphasis on implementing predictive maintenance strategies to reduce equipment failures. Efforts in enhancing production efficiency through PLC include designing human machine interface for PLC and using advanced control algorithms in PLC. Applications now range from using PLC for building automation systems to developing custom PLC applications for automation, supported by efficient data management in PLC systems.
Optimization efforts involve designing a distributed control system, configuring industrial ethernet networks, and monitoring energy consumption using PLC data to meet sustainability goals. Security remains a priority, with developing a secure PLC system architecture for industrial operations. Additionally, PLC system integration with enterprise resource planning improves data flow, while applying PLC technology to manufacturing processes ensures higher productivity and reliability.

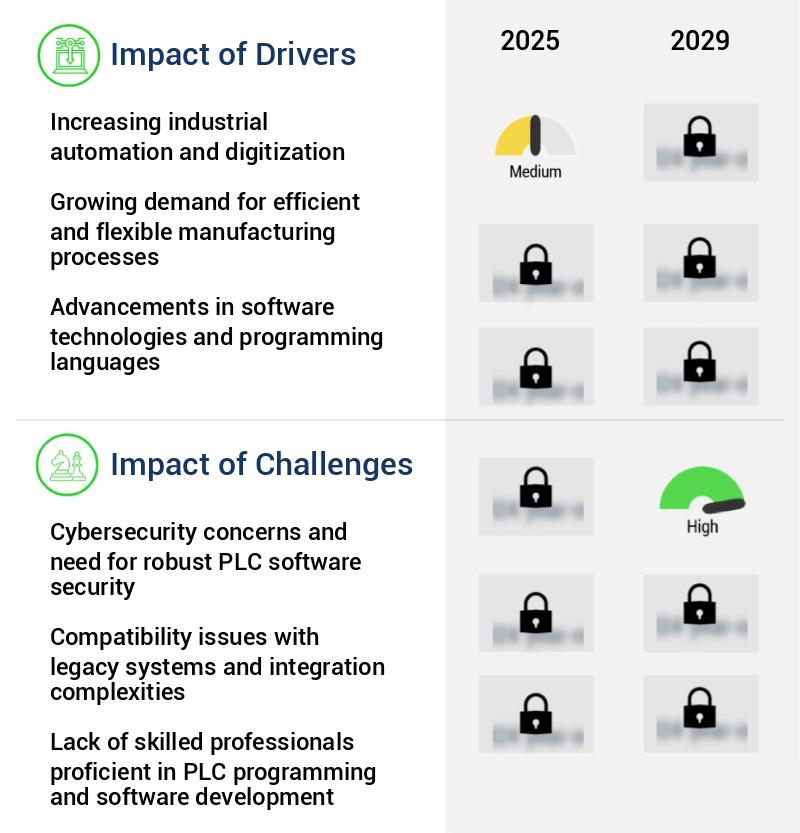
What are the key market drivers leading to the rise in the adoption of PLC Software Industry?
- The integration of industrial automation and digitization is the primary catalyst fueling market growth. Industries are continually seeking ways to enhance efficiency, production, and cost-effectiveness, leading to the widespread adoption of PLC systems for automating machines and operations.
- The integration of advanced technologies, such as cloud computing, big data analytics, and the Internet of Things (IoT), further fuels the need for PLC software. This software plays a crucial role in the industrial sector's digital transformation by providing the programming and logic necessary to manage and automate industrial processes.
- As industries continue to prioritize resource optimization and real-time data monitoring and control, the importance of PLC software in streamlining business operations becomes increasingly evident. The market's continuous evolution reflects the dynamic nature of the industrial sector, with ongoing advancements and innovations shaping its future.
What are the market trends shaping the PLC Software Industry?
- Edge computing and the adoption of edge Programmable Logic Controllers (PLC) software are emerging trends in the market, offering faster processing capabilities. The PLC (Programmable Logic Controller) software market is witnessing a significant shift towards edge computing and edge PLC software. Edge computing, which processes data closer to the source or at the edge of the network, is gaining popularity due to its ability to reduce latency and enable faster reaction times. In industrial contexts, edge computing with PLC software allows for real-time data processing and control, enhancing productivity and responsiveness. Manufacturers are increasingly adopting edge PLC software for time-sensitive applications, such as vital control systems and predictive maintenance, where quick action is essential.
- This trend is driven by the growing demand for real-time data processing and decentralized decision-making. By implementing edge PLC software, manufacturers can boost processing rates, minimize reliance on cloud connectivity, and improve overall system performance. The Asia Pacific region is projected to dominate the market, accounting for over 40% of the total market share by 2028. Europe and North America are also significant contributors to the market growth. The increasing adoption of Industry 4.0 and the Internet of Things (IoT) in manufacturing industries is fueling the demand for advanced PLC software solutions.
- Additionally, the growing trend towards automation and digital transformation in various sectors, such as healthcare, transportation, and energy, is further boosting the market growth. In conclusion, the market is experiencing a transformation with the adoption of edge computing and edge PLC software. This trend is driven by the need for real-time data processing and decentralized decision-making in various industries, leading to increased productivity and improved system performance. The market is expected to continue growing at a robust pace in the coming years.
What challenges does the PLC Software Industry face during its growth?
- The expansion of the industry is significantly impacted by cybersecurity concerns and the necessity for secure PLC software, which necessitates robust solutions to mitigate potential risks.
- The global Programmable Logic Controller (PLC) software market experiences continuous growth as industrial automation and digitization advance. However, this expansion is not without challenges. Cybersecurity concerns pose a significant threat to PLC software, given their increasing importance in industrial processes. The potential consequences of PLC software vulnerabilities are severe, ranging from production losses and operational disruptions to safety risks. To mitigate these challenges, PLC software providers and industrial businesses must invest in robust security measures. These measures include safe coding practices, encryption, authentication systems, and regular software updates. Access restrictions and securing PLC networks are also crucial aspects of ensuring PLC software security.
- PLC software security has become a top priority due to the increasing number of cyberattacks targeting these systems. According to recent studies, the industrial control systems (ICS) market, which includes PLC software, is projected to grow. Meanwhile, the global cybersecurity spending on ICS is expected to reach USD7.4 billion by 2023, growing at a CAGR of 11.5% during the forecast period. These figures underscore the growing importance of PLC software security and the substantial investments required to address this challenge. As a professional and knowledgeable virtual assistant, it is essential to maintain a formal and objective tone when discussing the market and its security challenges. By focusing on strong security measures and continuous investments in cybersecurity, PLC software providers and industrial businesses can mitigate risks and ensure the safe and efficient operation of their industrial processes.
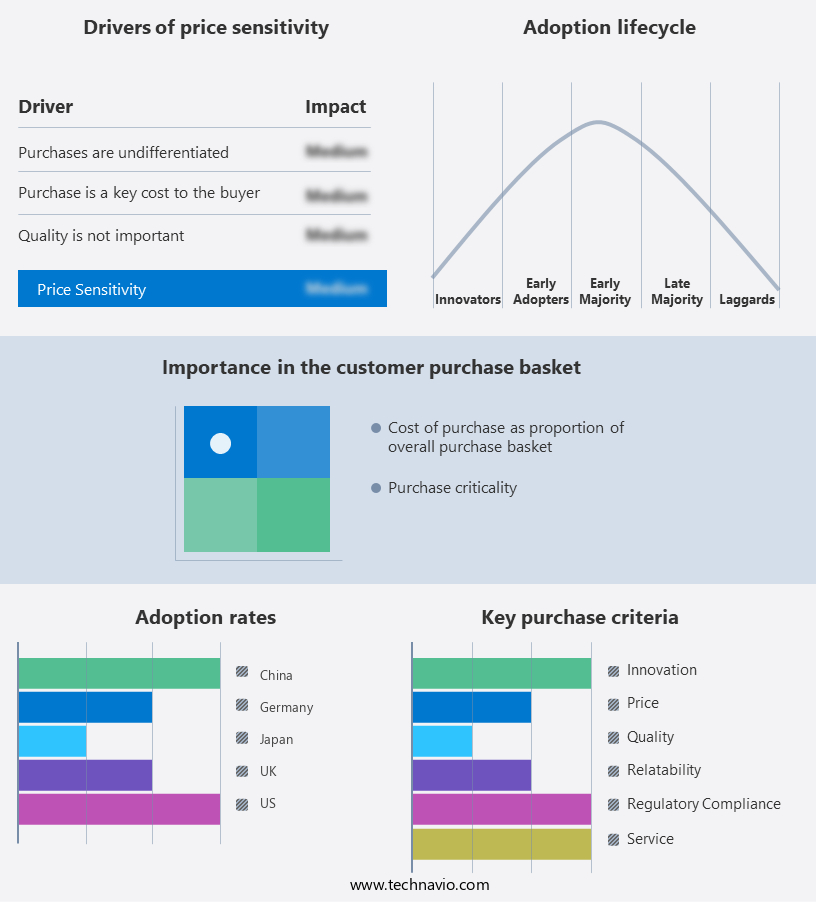
Exclusive Customer Landscape
The plc software market forecasting report includes the adoption lifecycle of the market, covering from the innovator's stage to the laggard's stage. It focuses on adoption rates in different regions based on penetration. Furthermore, the plc software market report also includes key purchase criteria and drivers of price sensitivity to help companies evaluate and develop their market growth analysis strategies.

Customer Landscape of PLC Software Industry
Key Companies & Market Insights
Companies are implementing various strategies, such as strategic alliances, plc software market forecast, partnerships, mergers and acquisitions, geographical expansion, and product/service launches, to enhance their presence in the industry.
Siemens AG - The company specializes in providing Programmable Logic Controllers (PLC) software solutions, including ABB AC500. This technology enables industrial automation and optimization, enhancing manufacturing processes and improving overall efficiency. As a research analyst, I observe the company's commitment to innovation and its significant impact on the global manufacturing sector.
The industry research and growth report includes detailed analyses of the competitive landscape of the market and information about key companies, including:
- Siemens AG
- Rockwell Automation Inc.
- Schneider Electric SE
- Mitsubishi Electric Corporation
- ABB Ltd.
- Emerson Electric Co.
- Honeywell International Inc.
- Omron Corporation
- General Electric Company
- Bosch Rexroth AG
- Hitachi Industrial Equipment Systems
- Delta Electronics Inc.
- Yokogawa Electric Corporation
- Phoenix Contact GmbH & Co. KG
- WAGO Kontakttechnik GmbH & Co. KG
- B&R Industrial Automation GmbH
- Toshiba Corporation
- Advantech Co., Ltd.
- Beckhoff Automation GmbH & Co. KG
- FANUC Corporation
Qualitative and quantitative analysis of companies has been conducted to help clients understand the wider business environment as well as the strengths and weaknesses of key industry players. Data is qualitatively analyzed to categorize companies as pure play, category-focused, industry-focused, and diversified; it is quantitatively analyzed to categorize companies as dominant, leading, strong, tentative, and weak.
Recent Development and News in PLC Software Market
- In January 2024, Siemens announced the launch of its new Simatic PCS 7 V16 product line, featuring advanced cybersecurity measures and improved connectivity options to enhance industrial automation and PLC (Programmable Logic Controller) software solutions (Siemens Press Release, 2024).
- In March 2024, Schneider Electric and Microsoft entered into a strategic partnership to integrate Microsoft Azure IoT and Schneider Electric's EcoStruxure architecture, allowing for seamless data exchange and advanced analytics in industrial automation and PLC software applications (Microsoft News Center, 2024).
- In May 2024, Rockwell Automation completed the acquisition of ASEM S.P.A, a leading Italian provider of control and automation systems, expanding its presence in the European market and enhancing its PLC software offerings (Rockwell Automation Press Release, 2024).
- In April 2025, Siemens secured a significant contract with the German railway operator, Deutsche Bahn, to modernize its signaling system using Siemens' Desigo CC PLC software, improving efficiency and safety in railway operations (Siemens Press Release, 2025).
Research Analyst Overview
- The market for Programmable Logic Controllers (PLCs) and associated software solutions continues to evolve, driven by the increasing demand for automation and digitalization in various industries. PLC software encompasses a range of applications, including predictive maintenance, Human-Machine Interface (HMI), real-time operating systems, industrial automation systems, fault detection and diagnostics, process control software, process optimization techniques, remote monitoring systems, networked PLC architecture, data acquisition systems, virtual commissioning systems, fieldbus communication, SCADA system integration, and more. Predictive maintenance software, for instance, utilizes advanced algorithms and data analysis to anticipate equipment failures, reducing downtime and maintenance costs. Real-time operating systems ensure reliable and efficient processing of data in industrial applications.
- Industrial communication protocols, such as Industrial Ethernet networks, facilitate seamless data exchange between devices. Process control software optimizes manufacturing execution system processes by managing variables and maintaining desired conditions. PID control algorithms are a crucial component of process control software, enabling precise control of industrial processes. Report generation software facilitates data analysis and visualization, while high-speed counter timers are essential for precise measurement in industrial applications. The market for PLC software is expected to grow at a significant rate, with a recent study estimating a 7% annual growth rate through 2026. This growth is attributed to the increasing adoption of automation and digitalization in industries, as well as advancements in technology, such as the integration of artificial intelligence and machine learning.
- In the realm of industrial automation, PLC software plays a vital role in optimizing processes, enhancing productivity, and ensuring safety and reliability. From manufacturing and energy to transportation and healthcare, the applications of PLC software are vast and continually evolving. In summary, the market is a dynamic and evolving landscape, driven by the increasing demand for automation and digitalization in various industries. From predictive maintenance to process optimization, PLC software solutions offer numerous benefits, contributing to the growth and innovation in industrial automation.
Dive into Technavio's robust research methodology, blending expert interviews, extensive data synthesis, and validated models for unparalleled PLC Software Market insights. See full methodology.
Market Scope
|
Report Coverage
|
Details
|
Page number
|
233
|
Base year
|
2024
|
Historic period
|
2019-2023 |
Forecast period
|
2025-2029
|
Growth momentum & CAGR
|
Accelerate at a CAGR of 5.6%
|
Market growth 2025-2029
|
USD 924.4 million
|
Market structure
|
Fragmented
|
YoY growth 2024-2025(%)
|
5.3
|
Key countries
|
US, China, Germany, Canada, India, South Korea, France, Japan, Italy, Brazil, UAE, UK, Spain, and Mexico
|
Competitive landscape
|
Leading Companies, Market Positioning of Companies, Competitive Strategies, and Industry Risks
|
Request Free Sample
What are the Key Data Covered in this PLC Software Market Research and Growth Report?
- CAGR of the PLC Software industry during the forecast period
- Detailed information on factors that will drive the growth and forecasting between 2025 and 2029
- Precise estimation of the size of the market and its contribution of the industry in focus to the parent market
- Accurate predictions about upcoming growth and trends and changes in consumer behaviour
- Growth of the market across North America, Europe, APAC, Middle East and Africa, and South America
- Thorough analysis of the market's competitive landscape and detailed information about companies
- Comprehensive analysis of factors that will challenge the plc software market growth of industry companies
We can help! Our analysts can customize this plc software market research report to meet your requirements.
Get in touch
1 Executive Summary
- 1.1 Market overview
- Executive Summary - Chart on Market Overview
- Executive Summary - Data Table on Market Overview
- Executive Summary - Chart on Global Market Characteristics
- Executive Summary - Chart on Market by Geography
- Executive Summary - Chart on Market Segmentation by Deployment
- Executive Summary - Chart on Market Segmentation by Type
- Executive Summary - Chart on Market Segmentation by Industry Application
- Executive Summary - Chart on Market Segmentation by Product Type
- Executive Summary - Chart on Incremental Growth
- Executive Summary - Data Table on Incremental Growth
- Executive Summary - Chart on Company Market Positioning
2 Technavio Analysis
- 2.1 Analysis of price sensitivity, lifecycle, customer purchase basket, adoption rates, and purchase criteria
- Analysis of price sensitivity, lifecycle, customer purchase basket, adoption rates, and purchase criteria
- 2.2 Criticality of inputs and Factors of differentiation
- Overview on criticality of inputs and factors of differentiation
- 2.3 Factors of disruption
- Overview on factors of disruption
- 2.4 Impact of drivers and challenges
- Impact of drivers and challenges in 2024 and 2029
3 Market Landscape
- 3.1 Market ecosystem
- Parent Market
- Data Table on - Parent Market
- 3.2 Market characteristics
- Market characteristics analysis
4 Market Sizing
- 4.1 Market definition
- Offerings of companies included in the market definition
- 4.2 Market segment analysis
- 4.4 Market outlook: Forecast for 2024-2029
- Chart on Global - Market size and forecast 2024-2029 ($ million)
- Data Table on Global - Market size and forecast 2024-2029 ($ million)
- Chart on Global Market: Year-over-year growth 2024-2029 (%)
- Data Table on Global Market: Year-over-year growth 2024-2029 (%)
5 Historic Market Size
- 5.1 Global PLC Software Market 2019 - 2023
- Historic Market Size - Data Table on Global PLC Software Market 2019 - 2023 ($ million)
- 5.2 Deployment segment analysis 2019 - 2023
- Historic Market Size - Deployment Segment 2019 - 2023 ($ million)
- 5.3 Type segment analysis 2019 - 2023
- Historic Market Size - Type Segment 2019 - 2023 ($ million)
- 5.4 Industry Application segment analysis 2019 - 2023
- Historic Market Size - Industry Application Segment 2019 - 2023 ($ million)
- 5.5 Product Type segment analysis 2019 - 2023
- Historic Market Size - Product Type Segment 2019 - 2023 ($ million)
- 5.6 Geography segment analysis 2019 - 2023
- Historic Market Size - Geography Segment 2019 - 2023 ($ million)
- 5.7 Country segment analysis 2019 - 2023
- Historic Market Size - Country Segment 2019 - 2023 ($ million)
6 Qualitative Analysis
- 6.1 Impact of AI on the global PLC software market
7 Five Forces Analysis
- 7.1 Five forces summary
- Five forces analysis - Comparison between 2024 and 2029
- 7.2 Bargaining power of buyers
- Bargaining power of buyers - Impact of key factors 2024 and 2029
- 7.3 Bargaining power of suppliers
- Bargaining power of suppliers - Impact of key factors in 2024 and 2029
- 7.4 Threat of new entrants
- Threat of new entrants - Impact of key factors in 2024 and 2029
- 7.5 Threat of substitutes
- Threat of substitutes - Impact of key factors in 2024 and 2029
- 7.6 Threat of rivalry
- Threat of rivalry - Impact of key factors in 2024 and 2029
- 7.7 Market condition
- Chart on Market condition - Five forces 2024 and 2029
8 Market Segmentation by Deployment
- 8.1 Market segments
- Chart on Deployment - Market share (2024-2029) (%)
- Data Table on Deployment - Market share (2024-2029) (%)
- 8.2 Comparison by Deployment
- Chart on Comparison by Deployment
- Data Table on Comparison by Deployment
- 8.3 Cloud-based - Market size and forecast (2024-2029)
- Chart on Cloud-based - Market size and forecast (2024-2029) ($ million)
- Data Table on Cloud-based - Market size and forecast (2024-2029) ($ million)
- Chart on Cloud-based - Year-over-year growth (2024-2029) (%)
- Data Table on Cloud-based - Year-over-year growth (2024-2029) (%)
- 8.4 On-premises - Market size and forecast (2024-2029)
- Chart on On-premises - Market size and forecast (2024-2029) ($ million)
- Data Table on On-premises - Market size and forecast (2024-2029) ($ million)
- Chart on On-premises - Year-over-year growth (2024-2029) (%)
- Data Table on On-premises - Year-over-year growth (2024-2029) (%)
- 8.5 Market opportunity by Deployment
- Market opportunity by Deployment ($ million)
- Data Table on Market opportunity by Deployment ($ million)
9 Market Segmentation by Type
- 9.1 Market segments
- Chart on Type - Market share (2024-2029) (%)
- Data Table on Type - Market share (2024-2029) (%)
- 9.2 Comparison by Type
- Chart on Comparison by Type
- Data Table on Comparison by Type
- 9.3 Ladder logic - Market size and forecast (2024-2029)
- Chart on Ladder logic - Market size and forecast (2024-2029) ($ million)
- Data Table on Ladder logic - Market size and forecast (2024-2029) ($ million)
- Chart on Ladder logic - Year-over-year growth (2024-2029) (%)
- Data Table on Ladder logic - Year-over-year growth (2024-2029) (%)
- 9.4 FBD - Market size and forecast (2024-2029)
- Chart on FBD - Market size and forecast (2024-2029) ($ million)
- Data Table on FBD - Market size and forecast (2024-2029) ($ million)
- Chart on FBD - Year-over-year growth (2024-2029) (%)
- Data Table on FBD - Year-over-year growth (2024-2029) (%)
- 9.5 Others - Market size and forecast (2024-2029)
- Chart on Others - Market size and forecast (2024-2029) ($ million)
- Data Table on Others - Market size and forecast (2024-2029) ($ million)
- Chart on Others - Year-over-year growth (2024-2029) (%)
- Data Table on Others - Year-over-year growth (2024-2029) (%)
- 9.6 Market opportunity by Type
- Market opportunity by Type ($ million)
- Data Table on Market opportunity by Type ($ million)
10 Market Segmentation by Industry Application
- 10.1 Market segments
- Chart on Industry Application - Market share (2024-2029) (%)
- Data Table on Industry Application - Market share (2024-2029) (%)
- 10.2 Comparison by Industry Application
- Chart on Comparison by Industry Application
- Data Table on Comparison by Industry Application
- 10.3 Automotive - Market size and forecast (2024-2029)
- Chart on Automotive - Market size and forecast (2024-2029) ($ million)
- Data Table on Automotive - Market size and forecast (2024-2029) ($ million)
- Chart on Automotive - Year-over-year growth (2024-2029) (%)
- Data Table on Automotive - Year-over-year growth (2024-2029) (%)
- 10.4 Chemical and petrochemical - Market size and forecast (2024-2029)
- Chart on Chemical and petrochemical - Market size and forecast (2024-2029) ($ million)
- Data Table on Chemical and petrochemical - Market size and forecast (2024-2029) ($ million)
- Chart on Chemical and petrochemical - Year-over-year growth (2024-2029) (%)
- Data Table on Chemical and petrochemical - Year-over-year growth (2024-2029) (%)
- 10.5 Energy and utilities - Market size and forecast (2024-2029)
- Chart on Energy and utilities - Market size and forecast (2024-2029) ($ million)
- Data Table on Energy and utilities - Market size and forecast (2024-2029) ($ million)
- Chart on Energy and utilities - Year-over-year growth (2024-2029) (%)
- Data Table on Energy and utilities - Year-over-year growth (2024-2029) (%)
- 10.6 Food and beverage - Market size and forecast (2024-2029)
- Chart on Food and beverage - Market size and forecast (2024-2029) ($ million)
- Data Table on Food and beverage - Market size and forecast (2024-2029) ($ million)
- Chart on Food and beverage - Year-over-year growth (2024-2029) (%)
- Data Table on Food and beverage - Year-over-year growth (2024-2029) (%)
- 10.7 Others - Market size and forecast (2024-2029)
- Chart on Others - Market size and forecast (2024-2029) ($ million)
- Data Table on Others - Market size and forecast (2024-2029) ($ million)
- Chart on Others - Year-over-year growth (2024-2029) (%)
- Data Table on Others - Year-over-year growth (2024-2029) (%)
- 10.8 Market opportunity by Industry Application
- Market opportunity by Industry Application ($ million)
- Data Table on Market opportunity by Industry Application ($ million)
11 Market Segmentation by Product Type
- 11.1 Market segments
- Chart on Product Type - Market share (2024-2029) (%)
- Data Table on Product Type - Market share (2024-2029) (%)
- 11.2 Comparison by Product Type
- Chart on Comparison by Product Type
- Data Table on Comparison by Product Type
- 11.3 Modular - Market size and forecast (2024-2029)
- Chart on Modular - Market size and forecast (2024-2029) ($ million)
- Data Table on Modular - Market size and forecast (2024-2029) ($ million)
- Chart on Modular - Year-over-year growth (2024-2029) (%)
- Data Table on Modular - Year-over-year growth (2024-2029) (%)
- 11.4 Compact - Market size and forecast (2024-2029)
- Chart on Compact - Market size and forecast (2024-2029) ($ million)
- Data Table on Compact - Market size and forecast (2024-2029) ($ million)
- Chart on Compact - Year-over-year growth (2024-2029) (%)
- Data Table on Compact - Year-over-year growth (2024-2029) (%)
- 11.5 Rack-mounted - Market size and forecast (2024-2029)
- Chart on Rack-mounted - Market size and forecast (2024-2029) ($ million)
- Data Table on Rack-mounted - Market size and forecast (2024-2029) ($ million)
- Chart on Rack-mounted - Year-over-year growth (2024-2029) (%)
- Data Table on Rack-mounted - Year-over-year growth (2024-2029) (%)
- 11.6 Market opportunity by Product Type
- Market opportunity by Product Type ($ million)
- Data Table on Market opportunity by Product Type ($ million)
12 Market Segmentation by Software Type
- 12.1 Market segments
- Chart on Software Type - Market share (2024-2029) (%)
- Data Table on Software Type - Market share (2024-2029) (%)
- 12.2 Comparison by Software Type
- Chart on Comparison by Software Type
- Data Table on Comparison by Software Type
- 12.3 Programming Software - Market size and forecast (2024-2029)
- Chart on Programming Software - Market size and forecast (2024-2029) ($ million)
- Data Table on Programming Software - Market size and forecast (2024-2029) ($ million)
- Chart on Programming Software - Year-over-year growth (2024-2029) (%)
- Data Table on Programming Software - Year-over-year growth (2024-2029) (%)
- 12.4 Simulation Software - Market size and forecast (2024-2029)
- Chart on Simulation Software - Market size and forecast (2024-2029) ($ million)
- Data Table on Simulation Software - Market size and forecast (2024-2029) ($ million)
- Chart on Simulation Software - Year-over-year growth (2024-2029) (%)
- Data Table on Simulation Software - Year-over-year growth (2024-2029) (%)
- 12.5 HMI Software - Market size and forecast (2024-2029)
- Chart on HMI Software - Market size and forecast (2024-2029) ($ million)
- Data Table on HMI Software - Market size and forecast (2024-2029) ($ million)
- Chart on HMI Software - Year-over-year growth (2024-2029) (%)
- Data Table on HMI Software - Year-over-year growth (2024-2029) (%)
- 12.6 Data Management Software - Market size and forecast (2024-2029)
- Chart on Data Management Software - Market size and forecast (2024-2029) ($ million)
- Data Table on Data Management Software - Market size and forecast (2024-2029) ($ million)
- Chart on Data Management Software - Year-over-year growth (2024-2029) (%)
- Data Table on Data Management Software - Year-over-year growth (2024-2029) (%)
- 12.7 Market opportunity by Software Type
- Market opportunity by Software Type ($ million)
- Data Table on Market opportunity by Software Type ($ million)
13 Customer Landscape
- 13.1 Customer landscape overview
- Analysis of price sensitivity, lifecycle, customer purchase basket, adoption rates, and purchase criteria
14 Geographic Landscape
- 14.1 Geographic segmentation
- Chart on Market share by geography 2024-2029 (%)
- Data Table on Market share by geography 2024-2029 (%)
- 14.2 Geographic comparison
- Chart on Geographic comparison
- Data Table on Geographic comparison
- 14.3 North America - Market size and forecast 2024-2029
- Chart on North America - Market size and forecast 2024-2029 ($ million)
- Data Table on North America - Market size and forecast 2024-2029 ($ million)
- Chart on North America - Year-over-year growth 2024-2029 (%)
- Data Table on North America - Year-over-year growth 2024-2029 (%)
- 14.4 Europe - Market size and forecast 2024-2029
- Chart on Europe - Market size and forecast 2024-2029 ($ million)
- Data Table on Europe - Market size and forecast 2024-2029 ($ million)
- Chart on Europe - Year-over-year growth 2024-2029 (%)
- Data Table on Europe - Year-over-year growth 2024-2029 (%)
- 14.5 APAC - Market size and forecast 2024-2029
- Chart on APAC - Market size and forecast 2024-2029 ($ million)
- Data Table on APAC - Market size and forecast 2024-2029 ($ million)
- Chart on APAC - Year-over-year growth 2024-2029 (%)
- Data Table on APAC - Year-over-year growth 2024-2029 (%)
- 14.6 Middle East and Africa - Market size and forecast 2024-2029
- Chart on Middle East and Africa - Market size and forecast 2024-2029 ($ million)
- Data Table on Middle East and Africa - Market size and forecast 2024-2029 ($ million)
- Chart on Middle East and Africa - Year-over-year growth 2024-2029 (%)
- Data Table on Middle East and Africa - Year-over-year growth 2024-2029 (%)
- 14.7 South America - Market size and forecast 2024-2029
- Chart on South America - Market size and forecast 2024-2029 ($ million)
- Data Table on South America - Market size and forecast 2024-2029 ($ million)
- Chart on South America - Year-over-year growth 2024-2029 (%)
- Data Table on South America - Year-over-year growth 2024-2029 (%)
- 14.8 US - Market size and forecast 2024-2029
- Chart on US - Market size and forecast 2024-2029 ($ million)
- Data Table on US - Market size and forecast 2024-2029 ($ million)
- Chart on US - Year-over-year growth 2024-2029 (%)
- Data Table on US - Year-over-year growth 2024-2029 (%)
- 14.9 Germany - Market size and forecast 2024-2029
- Chart on Germany - Market size and forecast 2024-2029 ($ million)
- Data Table on Germany - Market size and forecast 2024-2029 ($ million)
- Chart on Germany - Year-over-year growth 2024-2029 (%)
- Data Table on Germany - Year-over-year growth 2024-2029 (%)
- 14.10 Canada - Market size and forecast 2024-2029
- Chart on Canada - Market size and forecast 2024-2029 ($ million)
- Data Table on Canada - Market size and forecast 2024-2029 ($ million)
- Chart on Canada - Year-over-year growth 2024-2029 (%)
- Data Table on Canada - Year-over-year growth 2024-2029 (%)
- 14.11 China - Market size and forecast 2024-2029
- Chart on China - Market size and forecast 2024-2029 ($ million)
- Data Table on China - Market size and forecast 2024-2029 ($ million)
- Chart on China - Year-over-year growth 2024-2029 (%)
- Data Table on China - Year-over-year growth 2024-2029 (%)
- 14.12 UK - Market size and forecast 2024-2029
- Chart on UK - Market size and forecast 2024-2029 ($ million)
- Data Table on UK - Market size and forecast 2024-2029 ($ million)
- Chart on UK - Year-over-year growth 2024-2029 (%)
- Data Table on UK - Year-over-year growth 2024-2029 (%)
- 14.13 Japan - Market size and forecast 2024-2029
- Chart on Japan - Market size and forecast 2024-2029 ($ million)
- Data Table on Japan - Market size and forecast 2024-2029 ($ million)
- Chart on Japan - Year-over-year growth 2024-2029 (%)
- Data Table on Japan - Year-over-year growth 2024-2029 (%)
- 14.14 France - Market size and forecast 2024-2029
- Chart on France - Market size and forecast 2024-2029 ($ million)
- Data Table on France - Market size and forecast 2024-2029 ($ million)
- Chart on France - Year-over-year growth 2024-2029 (%)
- Data Table on France - Year-over-year growth 2024-2029 (%)
- 14.15 India - Market size and forecast 2024-2029
- Chart on India - Market size and forecast 2024-2029 ($ million)
- Data Table on India - Market size and forecast 2024-2029 ($ million)
- Chart on India - Year-over-year growth 2024-2029 (%)
- Data Table on India - Year-over-year growth 2024-2029 (%)
- 14.16 Italy - Market size and forecast 2024-2029
- Chart on Italy - Market size and forecast 2024-2029 ($ million)
- Data Table on Italy - Market size and forecast 2024-2029 ($ million)
- Chart on Italy - Year-over-year growth 2024-2029 (%)
- Data Table on Italy - Year-over-year growth 2024-2029 (%)
- 14.17 South Korea - Market size and forecast 2024-2029
- Chart on South Korea - Market size and forecast 2024-2029 ($ million)
- Data Table on South Korea - Market size and forecast 2024-2029 ($ million)
- Chart on South Korea - Year-over-year growth 2024-2029 (%)
- Data Table on South Korea - Year-over-year growth 2024-2029 (%)
- 14.18 Market opportunity by geography
- Market opportunity by geography ($ million)
- Data Tables on Market opportunity by geography ($ million)
- 14.19 Brazil - Market size and forecast (2024-2029)
- Chart on Brazil - Market size and forecast (2024-2029) ($ million)
- Data Table on Brazil - Market size and forecast (2024-2029) ($ million)
- Chart on Brazil - Year-over-year growth (2024-2029) (%)
- Data Table on Brazil - Year-over-year growth (2024-2029) (%)
- 14.20 UAE - Market size and forecast (2024-2029)
- Chart on UAE - Market size and forecast (2024-2029) ($ million)
- Data Table on UAE - Market size and forecast (2024-2029) ($ million)
- Chart on UAE - Year-over-year growth (2024-2029) (%)
- Data Table on UAE - Year-over-year growth (2024-2029) (%)
- 14.21 Spain - Market size and forecast (2024-2029)
- Chart on Spain - Market size and forecast (2024-2029) ($ million)
- Data Table on Spain - Market size and forecast (2024-2029) ($ million)
- Chart on Spain - Year-over-year growth (2024-2029) (%)
- Data Table on Spain - Year-over-year growth (2024-2029) (%)
- 14.22 Mexico - Market size and forecast (2024-2029)
- Chart on Mexico - Market size and forecast (2024-2029) ($ million)
- Data Table on Mexico - Market size and forecast (2024-2029) ($ million)
- Chart on Mexico - Year-over-year growth (2024-2029) (%)
- Data Table on Mexico - Year-over-year growth (2024-2029) (%)
- 14.23 Rest of World (ROW) - Market size and forecast (2024-2029)
- Chart on Rest of World (ROW) - Market size and forecast (2024-2029) ($ million)
- Data Table on Rest of World (ROW) - Market size and forecast (2024-2029) ($ million)
- Chart on Rest of World (ROW) - Year-over-year growth (2024-2029) (%)
- Data Table on Rest of World (ROW) - Year-over-year growth (2024-2029) (%)
15 Drivers, Challenges, and Opportunity/Restraints
- 15.3 Impact of drivers and challenges
- Impact of drivers and challenges in 2024 and 2029
- 15.4 Market opportunities/restraints
16 Competitive Landscape
- 16.2 Competitive Landscape
- Overview on criticality of inputs and factors of differentiation
- 16.3 Landscape disruption
- Overview on factors of disruption
- 16.4 Industry risks
- Impact of key risks on business
17 Competitive Analysis
- 17.2 Market positioning of companies
- Matrix on companies position and classification
- 17.3 Siemens AG (Germany)
- Siemens AG (Germany) - Overview
- Siemens AG (Germany) - Product / Service
- Siemens AG (Germany) - Key offerings
- 17.4 Rockwell Automation Inc. (United States)
- Rockwell Automation Inc. (United States) - Overview
- Rockwell Automation Inc. (United States) - Product / Service
- Rockwell Automation Inc. (United States) - Key offerings
- 17.5 Schneider Electric SE (France)
- Schneider Electric SE (France) - Overview
- Schneider Electric SE (France) - Product / Service
- Schneider Electric SE (France) - Key offerings
- 17.6 Mitsubishi Electric Corporation (Japan)
- Mitsubishi Electric Corporation (Japan) - Overview
- Mitsubishi Electric Corporation (Japan) - Product / Service
- Mitsubishi Electric Corporation (Japan) - Key offerings
- 17.7 ABB Ltd. (Switzerland)
- ABB Ltd. (Switzerland) - Overview
- ABB Ltd. (Switzerland) - Product / Service
- ABB Ltd. (Switzerland) - Key offerings
- 17.8 Emerson Electric Co. (United States)
- Emerson Electric Co. (United States) - Overview
- Emerson Electric Co. (United States) - Product / Service
- Emerson Electric Co. (United States) - Key offerings
- 17.9 Honeywell International Inc. (United States)
- Honeywell International Inc. (United States) - Overview
- Honeywell International Inc. (United States) - Product / Service
- Honeywell International Inc. (United States) - Key offerings
- 17.10 Omron Corporation (Japan)
- Omron Corporation (Japan) - Overview
- Omron Corporation (Japan) - Product / Service
- Omron Corporation (Japan) - Key offerings
- 17.11 General Electric Company (United States)
- General Electric Company (United States) - Overview
- General Electric Company (United States) - Product / Service
- General Electric Company (United States) - Key offerings
- 17.12 Bosch Rexroth AG (Germany)
- Bosch Rexroth AG (Germany) - Overview
- Bosch Rexroth AG (Germany) - Product / Service
- Bosch Rexroth AG (Germany) - Key offerings
- 17.13 Hitachi Industrial Equipment Systems (Japan)
- Hitachi Industrial Equipment Systems (Japan) - Overview
- Hitachi Industrial Equipment Systems (Japan) - Product / Service
- Hitachi Industrial Equipment Systems (Japan) - Key offerings
- 17.14 Delta Electronics Inc. (Taiwan)
- Delta Electronics Inc. (Taiwan) - Overview
- Delta Electronics Inc. (Taiwan) - Product / Service
- Delta Electronics Inc. (Taiwan) - Key offerings
- 17.15 Yokogawa Electric Corporation (Japan)
- Yokogawa Electric Corporation (Japan) - Overview
- Yokogawa Electric Corporation (Japan) - Product / Service
- Yokogawa Electric Corporation (Japan) - Key offerings
- 17.16 Phoenix Contact GmbH & Co. KG (Germany)
- Phoenix Contact GmbH & Co. KG (Germany) - Overview
- Phoenix Contact GmbH & Co. KG (Germany) - Product / Service
- Phoenix Contact GmbH & Co. KG (Germany) - Key offerings
- 17.17 WAGO Kontakttechnik GmbH & Co. KG (Germany)
- WAGO Kontakttechnik GmbH & Co. KG (Germany) - Overview
- WAGO Kontakttechnik GmbH & Co. KG (Germany) - Product / Service
- WAGO Kontakttechnik GmbH & Co. KG (Germany) - Key offerings
- 17.18 B&R Industrial Automation GmbH (Austria)
- B&R Industrial Automation GmbH (Austria) - Overview
- B&R Industrial Automation GmbH (Austria) - Product / Service
- B&R Industrial Automation GmbH (Austria) - Key offerings
- 17.19 Toshiba Corporation (Japan)
- Toshiba Corporation (Japan) - Overview
- Toshiba Corporation (Japan) - Product / Service
- Toshiba Corporation (Japan) - Key offerings
- 17.20 Advantech Co., Ltd. (Taiwan)
- Advantech Co., Ltd. (Taiwan) - Overview
- Advantech Co., Ltd. (Taiwan) - Product / Service
- Advantech Co., Ltd. (Taiwan) - Key offerings
- 17.21 Beckhoff Automation GmbH & Co. KG (Germany)
- Beckhoff Automation GmbH & Co. KG (Germany) - Overview
- Beckhoff Automation GmbH & Co. KG (Germany) - Product / Service
- Beckhoff Automation GmbH & Co. KG (Germany) - Key offerings
- 17.22 FANUC Corporation (Japan)
- FANUC Corporation (Japan) - Overview
- FANUC Corporation (Japan) - Product / Service
- FANUC Corporation (Japan) - Key offerings
- 17.23 ABB Ltd.
- ABB Ltd. - Overview
- ABB Ltd. - Product / Service
- ABB Ltd. - Key offerings
- 17.24 Beckhoff Automation
- Beckhoff Automation - Overview
- Beckhoff Automation - Product / Service
- Beckhoff Automation - Key offerings
- 17.25 Delta Electronics Inc.
- Delta Electronics Inc. - Overview
- Delta Electronics Inc. - Product / Service
- Delta Electronics Inc. - Key offerings
- 17.26 Eaton Corp. plc
- Eaton Corp. plc - Overview
- Eaton Corp. plc - Product / Service
- Eaton Corp. plc - Key offerings
- 17.27 Emerson Electric Co.
- Emerson Electric Co. - Overview
- Emerson Electric Co. - Product / Service
- Emerson Electric Co. - Key offerings
- 17.28 FANUC Corp.
- FANUC Corp. - Overview
- FANUC Corp. - Product / Service
- FANUC Corp. - Key offerings
- 17.29 General Electric Co.
- General Electric Co. - Overview
- General Electric Co. - Product / Service
- General Electric Co. - Key offerings
- 17.30 Hitachi Ltd.
- Hitachi Ltd. - Overview
- Hitachi Ltd. - Product / Service
- Hitachi Ltd. - Key offerings
- 17.31 Honeywell International Inc.
- Honeywell International Inc. - Overview
- Honeywell International Inc. - Product / Service
- Honeywell International Inc. - Key offerings
- 17.32 IDEC Corp.
- IDEC Corp. - Overview
- IDEC Corp. - Product / Service
- IDEC Corp. - Key offerings
- 17.33 Keyence Corp.
- Keyence Corp. - Overview
- Keyence Corp. - Product / Service
- Keyence Corp. - Key offerings
- 17.34 LS ELECTRIC Co. Ltd.
- LS ELECTRIC Co. Ltd. - Overview
- LS ELECTRIC Co. Ltd. - Product / Service
- LS ELECTRIC Co. Ltd. - Key offerings
- 17.35 Mitsubishi Electric Corp.
- Mitsubishi Electric Corp. - Overview
- Mitsubishi Electric Corp. - Product / Service
- Mitsubishi Electric Corp. - Key offerings
- 17.36 OMRON Corp.
- OMRON Corp. - Overview
- OMRON Corp. - Product / Service
- OMRON Corp. - Key offerings
- 17.37 Panasonic Holdings Corp.
- Panasonic Holdings Corp. - Overview
- Panasonic Holdings Corp. - Product / Service
- Panasonic Holdings Corp. - Key offerings
- 17.38 Rockwell Automation Inc.
- Rockwell Automation Inc. - Overview
- Rockwell Automation Inc. - Product / Service
- Rockwell Automation Inc. - Key offerings
- 17.39 Schneider Electric SE
- Schneider Electric SE - Overview
- Schneider Electric SE - Product / Service
- Schneider Electric SE - Key offerings
- 17.40 Siemens AG
- Siemens AG - Overview
- Siemens AG - Product / Service
- Siemens AG - Key offerings
- 17.41 Toshiba Corp.
- Toshiba Corp. - Overview
- Toshiba Corp. - Product / Service
- Toshiba Corp. - Key offerings
- 17.42 Yokogawa Electric Corp.
- Yokogawa Electric Corp. - Overview
- Yokogawa Electric Corp. - Product / Service
- Yokogawa Electric Corp. - Key offerings
18 Appendix
- 18.2 Inclusions and exclusions checklist
- Inclusions checklist
- Exclusions checklist
- 18.3 Currency conversion rates for US$
- Currency conversion rates for US$
- 18.4 Research methodology
- 18.7 Validation techniques employed for market sizing
- Validation techniques employed for market sizing
- 18.9 360 degree market analysis
- 360 degree market analysis
- 18.10 List of abbreviations