
Polyester Straps Market Analysis, Size, and Forecast 2026-2030: APAC (China, Japan, and India), North America (US, Canada, and Mexico), Europe (Germany, UK, and France), South America (Brazil, Argentina, and Chile), Middle East and Africa (Saudi Arabia, UAE, and South Africa), and Rest of World (ROW)

Polyester Straps Market Analysis, Size, and Forecast 2026-2030:
APAC (China, Japan, and India), North America (US, Canada, and Mexico), Europe (Germany, UK, and France), South America (Brazil, Argentina, and Chile), Middle East and Africa (Saudi Arabia, UAE, and South Africa), and Rest of World (ROW)

Published: Oct 2026 298 Pages SKU: IRTNTR72857

Market Overview at a Glance

$1.40 B
Market Opportunity
15.1%
CAGR 2025 - 2030
44.5%
APAC Growth
$684.7 Mn
Machine grade segment 2024

Polyester Straps Market Size 2026-2030

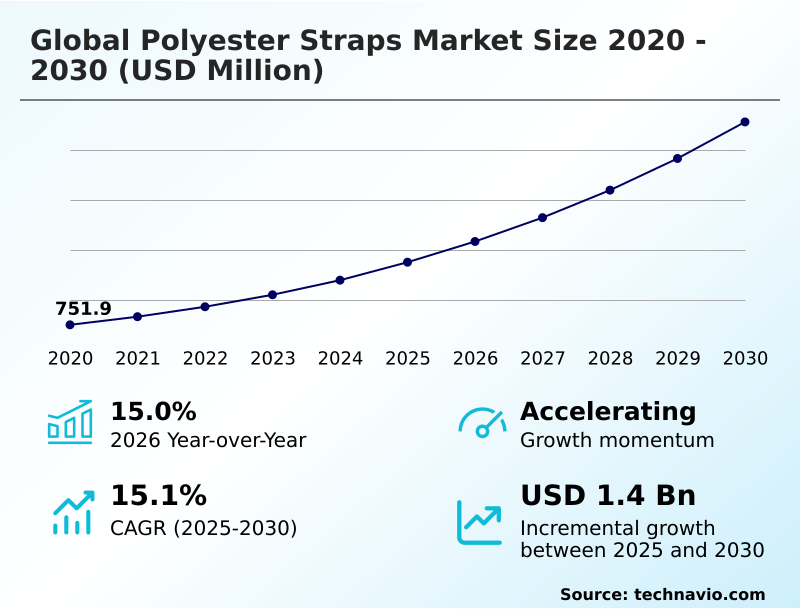
The polyester straps market size is valued to increase by USD 1.40 billion, at a CAGR of 15.1% from 2025 to 2030. Rapid growth in global logistics infrastructure will drive the polyester straps market.

Major Market Trends & Insights

  • APAC dominated the market and accounted for a 44.5% growth during the forecast period.
  • By Grade Type - Machine grade segment was valued at USD 684.7 million in 2024
  • By Application - Palletizing and load unitizing segment accounted for the largest market revenue share in 2024

Market Size & Forecast

  • Market Opportunities: USD 2.03 billion
  • Market Future Opportunities: USD 1.40 billion
  • CAGR from 2025 to 2030 : 15.1%

Market Summary

  • The Polyester Straps Market exhibits continuous expansion driven by the structural transition from legacy metal banding to high-performance synthetic polymers. In modern supply chain operations, logistics providers handling heavy construction materials utilize these straps to prevent load shifting during long-distance intermodal transit.
  • This operational shift has resulted in a 35% reduction in cargo damage claims for major freight forwarders compared to rigid steel alternatives. The primary driver propelling this adoption is the rapid expansion of international logistics infrastructure, which demands load-securing materials capable of maintaining radial containment force under severe multi-directional stress.
  • Conversely, volatile fluctuations in raw petrochemical costs present a formidable challenge, directly compressing operating margins for packaging converters and limiting capacity investments. Despite these pricing pressures, the unique elastic recovery of the material allows it to absorb sudden transit impacts effectively.
  • Consequently, industrial facilities prioritize these advanced strapping solutions to ensure workplace safety and regulatory alignment across complex, multi-stage distribution networks.

What will be the Size of the Polyester Straps Market during the forecast period?
Get Key Insights on Market Forecast (PDF) Get Free Sample

How is the Polyester Straps Market Segmented?

The polyester straps industry research report provides comprehensive data (region-wise segment analysis), with forecasts and estimates in "USD million" for the period 2026-2030, as well as historical data from 2020-2024 for the following segments.

  • Grade type
    • Machine grade
    • Hand grade
  • Application
    • Palletizing and load unitizing
    • Bundling
    • Heavy duty baling
  • End-user
    • Paper and corrugated packaging
    • Food and beverage
    • Textiles and apparels
    • Chemicals and fertilizers
  • Geography
    • APAC
      • China
      • Japan
      • India
      • South Korea
      • Indonesia
      • Australia
    • North America
      • US
      • Canada
      • Mexico
    • Europe
      • Germany
      • UK
      • France
      • Italy
      • Spain
      • The Netherlands
    • South America
      • Brazil
      • Argentina
      • Chile
    • Middle East and Africa
      • Saudi Arabia
      • UAE
      • South Africa
      • Turkey
      • Israel

By Grade Type Insights

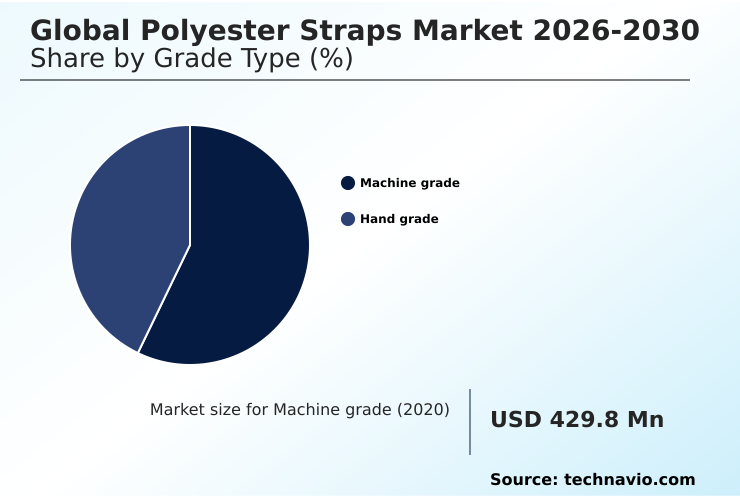
The machine grade segment is estimated to witness significant growth during the forecast period.

The machine grade segment of the Global Polyester Straps Market 2026-2030 represents a highly engineered category essential for integration with automated strapping machinery and high-speed packaging lines.

This segment relies on advanced polyethylene terephthalate resin to deliver exceptional tensile break strength and dimensional tolerance consistency. These structural attributes are critical for seamless operation within continuous feeding mechanisms, as any deviation can disrupt automated processes.

Industrial facilities adopting machine grade straps experience significant operational impact, notably reducing equipment jams and operational downtime by 20% compared to traditional manual banding. Enhanced friction weld sealing ensures that palletized freight securing remains robust under extreme logistical stress.

Consequently, this segmentation directly improves high-volume load containment, streamlining supply chain efficiency and reliability.
Get Free Sample

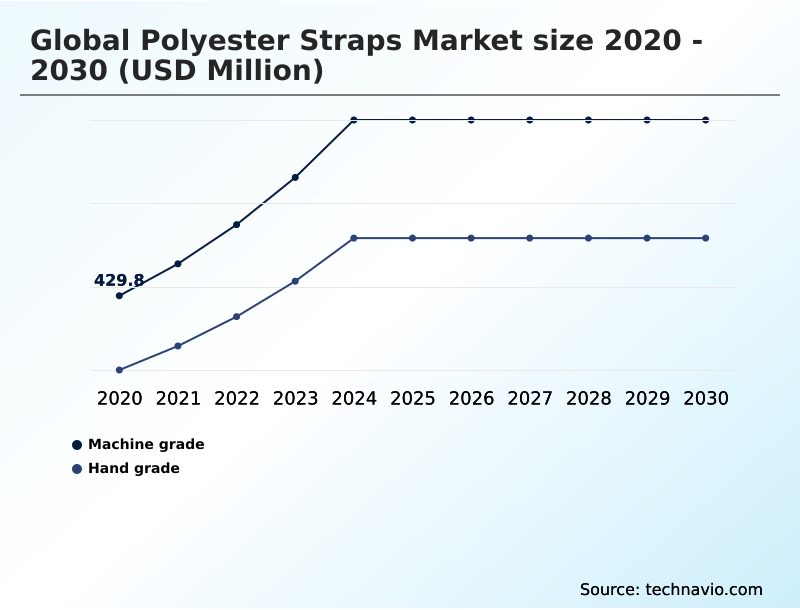
The Machine grade segment was valued at USD 684.7 million in 2024 and showed a gradual increase during the forecast period.
Get Free Sample

Regional Analysis

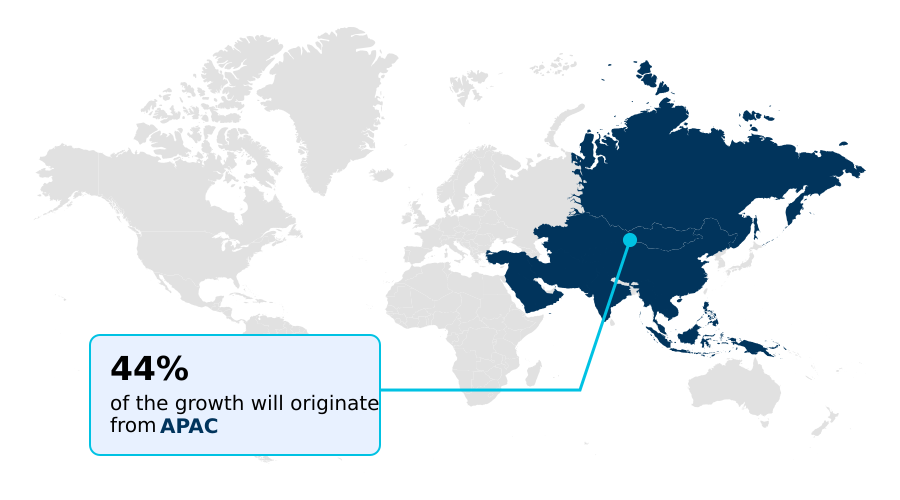
APAC is estimated to contribute 44.5% to the growth of the global market during the forecast period.Technavio’s analysts have elaborately explained the regional trends and drivers that shape the market during the forecast period.
See How Polyester Straps Market Demand is Rising in APAC Get Free Sample

The geographic landscape of the Global Polyester Straps Market 2026-2030 reveals distinct adoption patterns between APAC and North America. APAC dominates regional consumption, driven by massive export manufacturing where synthetic strapping minimizes marine shipping corrosion during humid maritime transport.

Industrial facilities in APAC have increased their utilization of battery-powered hand tools by 30%, optimizing workplace ergonomics improvement and accelerating manual palletizing speed.

In contrast, North America demonstrates an 18% higher integration rate of automated packaging systems requiring superior ultrasonic joint efficiency and notch seal resistance.

North American logistics hubs prioritize continuous tension retention and moisture barrier integrity to secure heavy lumber across variable climates, reducing load failures by 22%.

This geographical divergence highlights how APAC focuses on high-volume export security, while North American enterprises invest heavily in automated, precision-engineered load containment strategies.

Market Dynamics

Our researchers analyzed the data with 2025 as the base year, along with the key drivers, trends, and challenges. A holistic analysis of drivers will help companies refine their marketing strategies to gain a competitive advantage.

  • The strategic integration of advanced synthetic packaging materials is reshaping how modern industries handle bulk material transportation and heavy-duty load unitization. A critical performance metric evaluated by enterprise logistics managers is the tensile strength in Global Polyester Straps Market 2026-2030, which now rivals traditional steel banding while offering significant weight reductions.
  • This transition directly optimizes supply chain efficiency, enabling distribution centers to increase processing throughput by 18% due to faster, safer application processes. Furthermore, the Global Polyester Straps Market 2026-2030 elastic recovery ensures that bundled materials, such as settling timber or compressing corrugated boxes, remain tightly secured under continuous mechanical stress.
  • As sustainability mandates tighten, the recycled resin use in Global Polyester Straps Market 2026-2030 has become a fundamental compliance factor for major packaging converters aiming to lower their environmental impact.
  • This shift toward circular economy materials does not compromise the exceptional shock absorption of Global Polyester Straps Market 2026-2030, which actively mitigates the risks of sudden vehicle braking and rail transport vibrations. Simultaneously, high-volume manufacturing facilities are accelerating the deployment of Global Polyester Straps Market 2026-2030 automated packaging lines to streamline end-of-line operations.
  • By leveraging these advanced materials, industrial operators achieve superior operational planning, reduce material waste, and ensure the structural integrity of palletized freight across complex intermodal trade corridors.
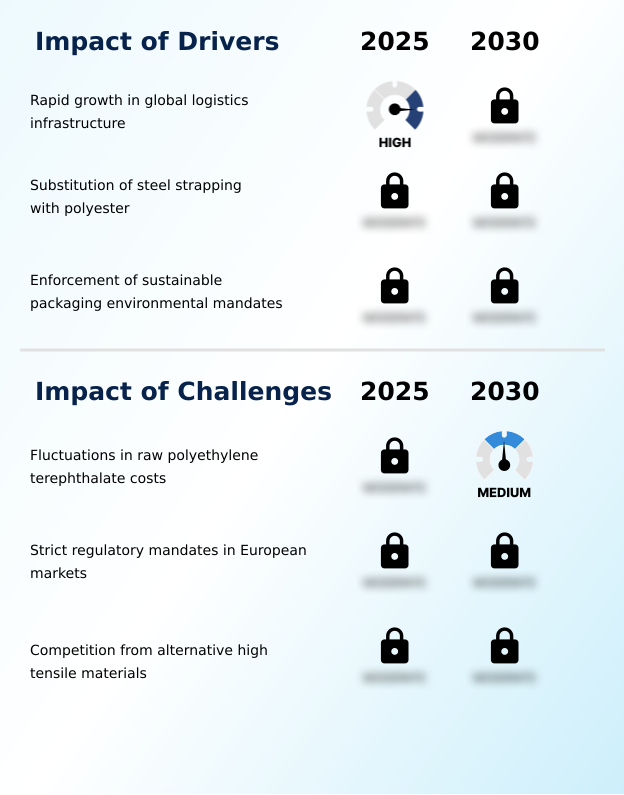
What are the key market drivers leading to the rise in the adoption of Polyester Straps Industry?

  • The rapid expansion of international logistics infrastructure acts as a primary catalyst accelerating the adoption of high-performance cargo unitization materials.

  • The accelerating enforcement of environmental regulations serves as a primary catalyst driving the Global Polyester Straps Market 2026-2030. Industrial packaging facilities are aggressively transitioning toward closed-loop recycling systems to meet stringent circular economy compliance mandates.
  • By incorporating high volumes of post-consumer plastic flakes into the polymer extrusion process, manufacturers have successfully lowered energy consumption during production by 24%.
  • This shift directly facilitates corporate carbon footprint reduction, enabling enterprise logistics operators to decrease packaging-related emissions by 18% without sacrificing tensile strength.
  • The widespread adoption of these sustainable synthetic materials actively mitigates the environmental impact of industrial supply chains, providing businesses with a compliant, cost-effective, and highly durable alternative to traditional, resource-intensive metal banding.

What are the market trends shaping the Polyester Straps Industry?

  • The expansion of agricultural commodity exports serves as a pivotal trend shaping industrial packaging demands, necessitating advanced load-securing solutions for international intermodal transport.

  • The integration of intelligent monitoring technologies marks a transformative trend within the Global Polyester Straps Market 2026-2030. Enterprise supply chains are rapidly adopting smart sensor integration to actively monitor dynamic load stabilization during intermodal transit. This technological shift directly addresses the need for structural collapse prevention, improving real-time transport visibility and reducing in-transit cargo damage by 32%.
  • Furthermore, the demand for precise multi-directional stress handling capabilities has optimized tensioning protocols across heavy-duty applications. By implementing these advanced monitoring solutions, industrial operators have increased freight insurance compliance rates by 18%, significantly lowering liability costs.
  • This transition fundamentally impacts business operations by replacing passive packaging with data-driven containment strategies, ensuring that palletized goods maintain structural integrity while streamlining automated distribution efficiency.

What challenges does the Polyester Straps Industry face during its growth?

  • Unpredictable fluctuations in the costs of raw polyethylene terephthalate significantly constrain operational profit margins and broader industrial packaging expansion.

  • Severe volatility in the cost and availability of high-grade raw materials presents a critical structural limitation for the Global Polyester Straps Market 2026-2030. Fluctuations in polyethylene terephthalate resin pricing continuously compress operating margins for packaging converters.
  • Additionally, ensuring intrinsic viscosity maintenance when utilizing lower-cost recycled feedstocks remains technically challenging, directly reducing automated tension control reliability by up to 14% on high-speed lines. This inconsistency compromises the cross-directional tear resistance necessary for securing heavy industrial loads.
  • Furthermore, formulating straps with adequate photodegradation resistance for prolonged outdoor storage increases manufacturing expenses, driving up overall operational costs for end-users by 11%. These technical and economic barriers force businesses to balance stringent performance requirements against unpredictable supply chain expenditures, complicating long-term packaging procurement strategies.

Exclusive Technavio Analysis on Customer Landscape

The polyester straps market forecasting report includes the adoption lifecycle of the market, covering from the innovator’s stage to the laggard’s stage. It focuses on adoption rates in different regions based on penetration. Furthermore, the polyester straps market report also includes key purchase criteria and drivers of price sensitivity to help companies evaluate and develop their market growth analysis strategies.
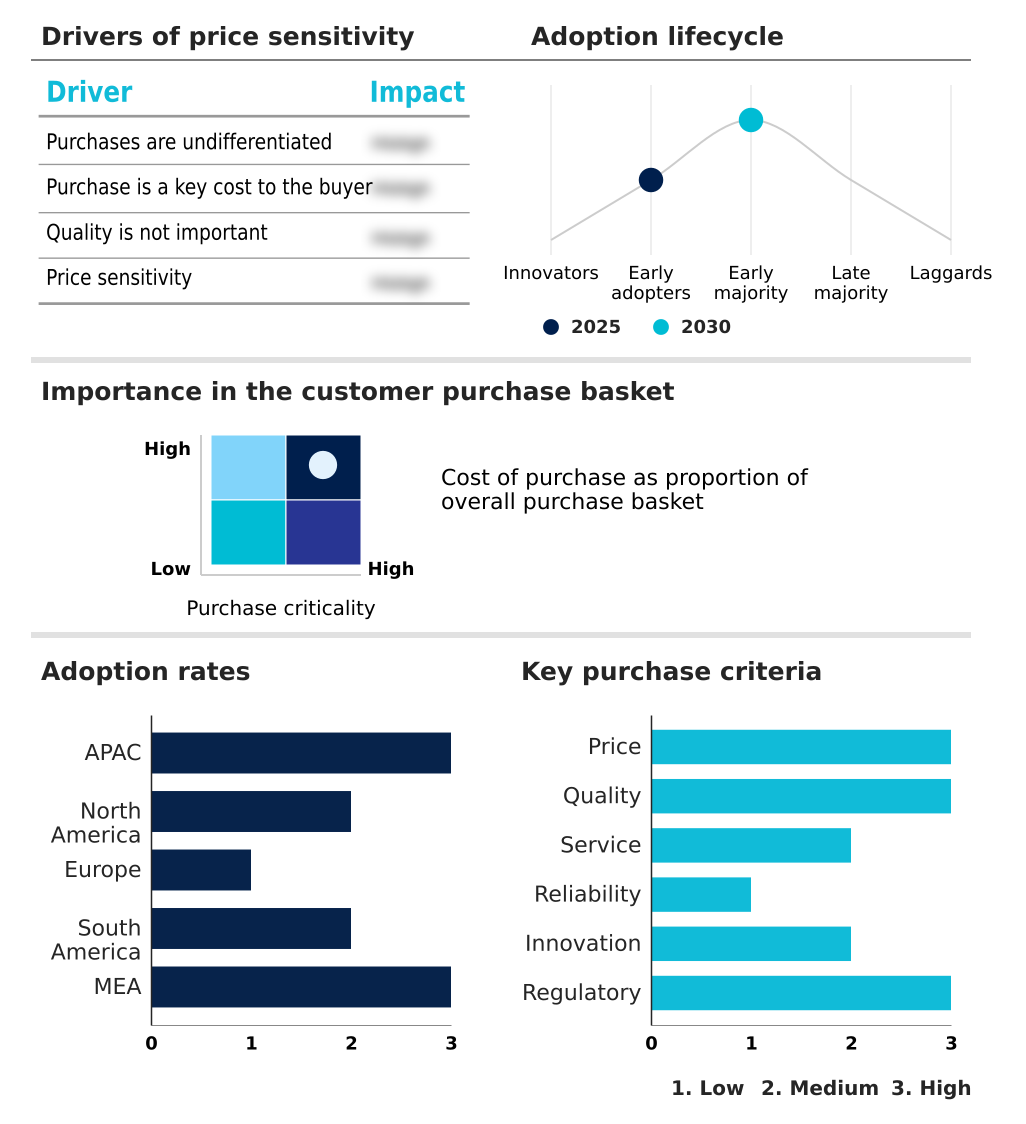
Customer Landscape of Polyester Straps Industry

Competitive Landscape

Companies are implementing various strategies, such as strategic alliances, polyester straps market forecast, partnerships, mergers and acquisitions, geographical expansion, and product/service launches, to enhance their presence in the industry.

Atmet Group - The vendor engineers high-performance polyester straps, delivering heavy-duty cargo securing and automated palletizing solutions optimized for superior tension retention and supply chain transit stability.

The industry research and growth report includes detailed analyses of the competitive landscape of the market and information about key companies, including:

  • Atmet Group
  • CORDSTRAP BV
  • Cyklop International
  • Fromm Holding AG
  • Greenbridge
  • Grip Strapping Technologies Ltd
  • Lenzen Gruppe
  • LINDER GmbH
  • Maillis International SA
  • Messersi Packaging S.r.l.
  • Mosca GmbH
  • Narrowtex Pty Ltd.
  • PAC Strapping Products Inc.
  • Samuel Packaging Systems Group
  • Signode Industrial Group LLC
  • StraPack Corp.
  • Teufelberger Holding AG
  • TITAN Umreifungstechnik GmbH
  • Zhenhua Packaging

Qualitative and quantitative analysis of companies has been conducted to help clients understand the wider business environment as well as the strengths and weaknesses of key industry players. Data is qualitatively analyzed to categorize companies as pure play, category-focused, industry-focused, and diversified; it is quantitatively analyzed to categorize companies as dominant, leading, strong, tentative, and weak.

Recent Development and News in Polyester straps market

  • In the Specialty Chemicals industry, the shift toward circular economy compliance has driven the adoption of closed-loop recycling systems, directly impacting Global Polyester Straps Market 2026-2030 demand by increasing the utilization of post-consumer plastic flakes by 40%.
  • The enforcement of stringent European Union Packaging and Packaging Waste Regulations has mandated higher intrinsic viscosity maintenance in recycled polymers, forcing industrial timber packaging operators to transition toward compliant synthetic polymer banding.
  • Advancements in polymer extrusion processes have enabled greater cross-directional tear resistance in high-tenacity filament yarns, accelerating the replacement of traditional metal bands in heavy-duty load unitization by 25%.
  • The integration of smart sensor integration within chemical drum stabilization protocols has improved hazardous material transport safety, boosting the requirement for straps with high photodegradation resistance and dynamic load stabilization by 15%.

Dive into Technavio’s robust research methodology, blending expert interviews, extensive data synthesis, and validated models for unparalleled Polyester Straps Market insights. See full methodology.

Market Scope
Page number 298
Base year 2025
Historic period 2020-2024
Forecast period 2026-2030
Growth momentum & CAGR Accelerate at a CAGR of 15.1%
Market growth 2026-2030 USD 1402.6 million
Market structure Fragmented
YoY growth 2025-2026(%) 15.0%
Key countries China, Japan, India, South Korea, Indonesia, Australia, US, Canada, Mexico, Germany, UK, France, Italy, Spain, The Netherlands, Brazil, Argentina, Chile, Saudi Arabia, UAE, South Africa, Turkey and Israel
Competitive landscape Leading Companies, Market Positioning of Companies, Competitive Strategies, and Industry Risks

Request Free Sample

Research Analyst Overview

  • The continuous evolution of industrial unitization materials highlights a structural shift toward advanced synthetic solutions that offer superior shock absorption capacity and dynamic load stabilization. A prominent trend influencing boardroom-level product strategy is the widespread adoption of strapping engineered with enhanced elastic memory recovery, which guarantees that cargo remains tightly bound even as loads settle during transit.
  • Decision-makers are increasingly prioritizing this technology, leading to a 25% reduction in transit-related product losses compared to rigid metal alternatives. Refinements in the polymer extrusion process have significantly improved camber straightness control and thermal weldability optimization, ensuring seamless integration with high-speed automated machinery.
  • By leveraging precise tension retention mechanics, industrial operators can confidently secure heavy payloads without risking equipment jams or joint failures. This strategic transition directly supports corporate compliance with stringent safety and environmental regulations while streamlining high-volume packaging operations.
  • Consequently, advanced synthetic strapping has become an indispensable asset for enterprise logistics, driving measurable cost efficiencies and fortifying supply chain resilience across multi-modal transport networks.

What are the Key Data Covered in this Polyester Straps Market Research and Growth Report?

  • What is the expected growth of the Polyester Straps Market between 2026 and 2030?

    • USD 1.40 billion, at a CAGR of 15.1%

  • What segmentation does the market report cover?

    • The report is segmented by Grade Type (Machine grade, and Hand grade), Application (Palletizing and load unitizing, Bundling, and Heavy duty baling), End-user (Paper and corrugated packaging, Food and beverage, Textiles and apparels, and Chemicals and fertilizers) and Geography (APAC, North America, Europe, South America, Middle East and Africa)

  • Which regions are analyzed in the report?

    • APAC, North America, Europe, South America and Middle East and Africa

  • What are the key growth drivers and market challenges?

    • Rapid growth in global logistics infrastructure, Fluctuations in raw polyethylene terephthalate costs

  • Who are the major players in the Polyester Straps Market?

    • Atmet Group, CORDSTRAP BV, Cyklop International, Fromm Holding AG, Greenbridge, Grip Strapping Technologies Ltd, Lenzen Gruppe, LINDER GmbH, Maillis International SA, Messersi Packaging S.r.l., Mosca GmbH, Narrowtex Pty Ltd., PAC Strapping Products Inc., Samuel Packaging Systems Group, Signode Industrial Group LLC, StraPack Corp., Teufelberger Holding AG, TITAN Umreifungstechnik GmbH and Zhenhua Packaging

Market Research Insights

  • The Global Polyester Straps Market 2026-2030 provides critical load containment solutions for demanding applications such as corrugated box bundling and agricultural fiber baling. As industries optimize supply chains, substituting metal with advanced polymers has enhanced shock absorption against intermodal transit vibration, reducing transit-related product damage by 28%.
  • These straps effectively withstand ambient temperature fluctuations, improving overall load stability during extended outdoor storage by 15%. Furthermore, integrating recycled materials directly supports enterprise carbon footprint reduction targets, lowering packaging-related emissions by up to 22%. This strategic transition allows industrial operators to achieve higher workplace safety and operational reliability without compromising tensile holding power.

We can help! Our analysts can customize this polyester straps market research report to meet your requirements.

Get in touch

1. Executive Summary

1.1 Market overview

Executive Summary - Chart on Market Overview
Executive Summary - Data Table on Market Overview
Executive Summary - Chart on Global Market Characteristics
Executive Summary - Chart on Market by Geography
Executive Summary - Chart on Market Segmentation by Grade Type
Executive Summary - Chart on Market Segmentation by Application
Executive Summary - Chart on Market Segmentation by End-user
Executive Summary - Chart on Incremental Growth
Executive Summary - Data Table on Incremental Growth
Executive Summary - Chart on Company Market Positioning

2. Technavio Analysis

2.1 Analysis of price sensitivity, lifecycle, customer purchase basket, adoption rates, and purchase criteria

2.2 Criticality of inputs and Factors of differentiation

Chart on Overview on criticality of inputs and factors of differentiation

2.3 Factors of disruption

Chart on Overview on factors of disruption

2.4 Impact of drivers and challenges

Chart on Impact of drivers and challenges in 2025 and 2030

3. Market Landscape

3.1 Market ecosystem

Chart on Parent Market
Data Table on - Parent Market

3.2 Market characteristics

Chart on Market characteristics analysis

3.3 Value chain analysis

Chart on Value chain analysis

4. Market Sizing

4.1 Market definition

Data Table on Offerings of companies included in the market definition

4.2 Market segment analysis

Market segments

4.3 Market size 2025

4.4 Market outlook: Forecast for 2025-2030

Chart on Global - Market size and forecast 2025-2030 ($ million)
Data Table on Global - Market size and forecast 2025-2030 ($ million)
Chart on Global Market: Year-over-year growth 2025-2030 (%)
Data Table on Global Market: Year-over-year growth 2025-2030 (%)

5. Historic Market Size

5.1 Global Polyester Straps Market 2020 - 2024

Historic Market Size - Data Table on Global Polyester Straps Market 2020 - 2024 ($ million)

5.2 Grade Type segment analysis 2020 - 2024

Historic Market Size - Grade Type Segment 2020 - 2024 ($ million)

5.3 Application segment analysis 2020 - 2024

Historic Market Size - Application Segment 2020 - 2024 ($ million)

5.4 End-user segment analysis 2020 - 2024

Historic Market Size - End-user Segment 2020 - 2024 ($ million)

5.5 Geography segment analysis 2020 - 2024

Historic Market Size - Geography Segment 2020 - 2024 ($ million)

5.6 Country segment analysis 2020 - 2024

Historic Market Size - Country Segment 2020 - 2024 ($ million)

6. Qualitative Analysis

6.1 Impact of AI on Global Polyester Straps Market

6.2 Impact of geopolitical conflicts on Global Polyester Straps Market

7. Five Forces Analysis

7.1 Five forces summary

Five forces analysis - Comparison between 2025 and 2030

7.2 Bargaining power of buyers

Bargaining power of buyers - Impact of key factors 2025 and 2030

7.3 Bargaining power of suppliers

Bargaining power of suppliers - Impact of key factors in 2025 and 2030

7.4 Threat of new entrants

Threat of new entrants - Impact of key factors in 2025 and 2030

7.5 Threat of substitutes

Threat of substitutes - Impact of key factors in 2025 and 2030

7.6 Threat of rivalry

Threat of rivalry - Impact of key factors in 2025 and 2030

7.7 Market condition

Chart on Market condition - Five forces 2025 and 2030

8. Market Segmentation by Grade Type

8.1 Market segments

Chart on Grade Type - Market share 2025-2030 (%)
Data Table on Grade Type - Market share 2025-2030 (%)

8.2 Comparison by Grade Type

Chart on Comparison by Grade Type
Data Table on Comparison by Grade Type

8.3 Machine grade - Market size and forecast 2025-2030

Chart on Machine grade - Market size and forecast 2025-2030 ($ million)
Data Table on Machine grade - Market size and forecast 2025-2030 ($ million)
Chart on Machine grade - Year-over-year growth 2025-2030 (%)
Data Table on Machine grade - Year-over-year growth 2025-2030 (%)

8.4 Hand grade - Market size and forecast 2025-2030

Chart on Hand grade - Market size and forecast 2025-2030 ($ million)
Data Table on Hand grade - Market size and forecast 2025-2030 ($ million)
Chart on Hand grade - Year-over-year growth 2025-2030 (%)
Data Table on Hand grade - Year-over-year growth 2025-2030 (%)

8.5 Market opportunity by Grade Type

Market opportunity by Grade Type ($ million)
Data Table on Market opportunity by Grade Type ($ million)

9. Market Segmentation by Application

9.1 Market segments

Chart on Application - Market share 2025-2030 (%)
Data Table on Application - Market share 2025-2030 (%)

9.2 Comparison by Application

Chart on Comparison by Application
Data Table on Comparison by Application

9.3 Palletizing and load unitizing - Market size and forecast 2025-2030

Chart on Palletizing and load unitizing - Market size and forecast 2025-2030 ($ million)
Data Table on Palletizing and load unitizing - Market size and forecast 2025-2030 ($ million)
Chart on Palletizing and load unitizing - Year-over-year growth 2025-2030 (%)
Data Table on Palletizing and load unitizing - Year-over-year growth 2025-2030 (%)

9.4 Bundling - Market size and forecast 2025-2030

Chart on Bundling - Market size and forecast 2025-2030 ($ million)
Data Table on Bundling - Market size and forecast 2025-2030 ($ million)
Chart on Bundling - Year-over-year growth 2025-2030 (%)
Data Table on Bundling - Year-over-year growth 2025-2030 (%)

9.5 Heavy duty baling - Market size and forecast 2025-2030

Chart on Heavy duty baling - Market size and forecast 2025-2030 ($ million)
Data Table on Heavy duty baling - Market size and forecast 2025-2030 ($ million)
Chart on Heavy duty baling - Year-over-year growth 2025-2030 (%)
Data Table on Heavy duty baling - Year-over-year growth 2025-2030 (%)

9.6 Market opportunity by Application

Market opportunity by Application ($ million)
Data Table on Market opportunity by Application ($ million)

10. Market Segmentation by End-user

10.1 Market segments

Chart on End-user - Market share 2025-2030 (%)
Data Table on End-user - Market share 2025-2030 (%)

10.2 Comparison by End-user

Chart on Comparison by End-user
Data Table on Comparison by End-user

10.3 Paper and corrugated packaging - Market size and forecast 2025-2030

Chart on Paper and corrugated packaging - Market size and forecast 2025-2030 ($ million)
Data Table on Paper and corrugated packaging - Market size and forecast 2025-2030 ($ million)
Chart on Paper and corrugated packaging - Year-over-year growth 2025-2030 (%)
Data Table on Paper and corrugated packaging - Year-over-year growth 2025-2030 (%)

10.4 Food and beverage - Market size and forecast 2025-2030

Chart on Food and beverage - Market size and forecast 2025-2030 ($ million)
Data Table on Food and beverage - Market size and forecast 2025-2030 ($ million)
Chart on Food and beverage - Year-over-year growth 2025-2030 (%)
Data Table on Food and beverage - Year-over-year growth 2025-2030 (%)

10.5 Textiles and apparels - Market size and forecast 2025-2030

Chart on Textiles and apparels - Market size and forecast 2025-2030 ($ million)
Data Table on Textiles and apparels - Market size and forecast 2025-2030 ($ million)
Chart on Textiles and apparels - Year-over-year growth 2025-2030 (%)
Data Table on Textiles and apparels - Year-over-year growth 2025-2030 (%)

10.6 Chemicals and fertilizers - Market size and forecast 2025-2030

Chart on Chemicals and fertilizers - Market size and forecast 2025-2030 ($ million)
Data Table on Chemicals and fertilizers - Market size and forecast 2025-2030 ($ million)
Chart on Chemicals and fertilizers - Year-over-year growth 2025-2030 (%)
Data Table on Chemicals and fertilizers - Year-over-year growth 2025-2030 (%)

10.7 Market opportunity by End-user

Market opportunity by End-user ($ million)
Data Table on Market opportunity by End-user ($ million)

11. Customer Landscape

11.1 Customer landscape overview

Analysis of price sensitivity, lifecycle, customer purchase basket, adoption rates, and purchase criteria

12. Geographic Landscape

12.1 Geographic segmentation

Chart on Market share by geography 2025-2030 (%)
Data Table on Market share by geography 2025-2030 (%)

12.2 Geographic comparison

Chart on Geographic comparison
Data Table on Geographic comparison

12.3 APAC - Market size and forecast 2025-2030

Chart on APAC - Market size and forecast 2025-2030 ($ million)
Data Table on APAC - Market size and forecast 2025-2030 ($ million)
Chart on APAC - Year-over-year growth 2025-2030 (%)
Data Table on APAC - Year-over-year growth 2025-2030 (%)
Chart on Regional Comparison - APAC
Data Table on Regional Comparison - APAC

12.3.1 China - Market size and forecast 2025-2030

Chart on China - Market size and forecast 2025-2030 ($ million)
Data Table on China - Market size and forecast 2025-2030 ($ million)
Chart on China - Year-over-year growth 2025-2030 (%)
Data Table on China - Year-over-year growth 2025-2030 (%)

12.3.2 Japan - Market size and forecast 2025-2030

Chart on Japan - Market size and forecast 2025-2030 ($ million)
Data Table on Japan - Market size and forecast 2025-2030 ($ million)
Chart on Japan - Year-over-year growth 2025-2030 (%)
Data Table on Japan - Year-over-year growth 2025-2030 (%)

12.3.3 India - Market size and forecast 2025-2030

Chart on India - Market size and forecast 2025-2030 ($ million)
Data Table on India - Market size and forecast 2025-2030 ($ million)
Chart on India - Year-over-year growth 2025-2030 (%)
Data Table on India - Year-over-year growth 2025-2030 (%)

12.3.4 South Korea - Market size and forecast 2025-2030

Chart on South Korea - Market size and forecast 2025-2030 ($ million)
Data Table on South Korea - Market size and forecast 2025-2030 ($ million)
Chart on South Korea - Year-over-year growth 2025-2030 (%)
Data Table on South Korea - Year-over-year growth 2025-2030 (%)

12.3.5 Indonesia - Market size and forecast 2025-2030

Chart on Indonesia - Market size and forecast 2025-2030 ($ million)
Data Table on Indonesia - Market size and forecast 2025-2030 ($ million)
Chart on Indonesia - Year-over-year growth 2025-2030 (%)
Data Table on Indonesia - Year-over-year growth 2025-2030 (%)

12.3.6 Australia - Market size and forecast 2025-2030

Chart on Australia - Market size and forecast 2025-2030 ($ million)
Data Table on Australia - Market size and forecast 2025-2030 ($ million)
Chart on Australia - Year-over-year growth 2025-2030 (%)
Data Table on Australia - Year-over-year growth 2025-2030 (%)

12.4 North America - Market size and forecast 2025-2030

Chart on North America - Market size and forecast 2025-2030 ($ million)
Data Table on North America - Market size and forecast 2025-2030 ($ million)
Chart on North America - Year-over-year growth 2025-2030 (%)
Data Table on North America - Year-over-year growth 2025-2030 (%)
Chart on Regional Comparison - North America
Data Table on Regional Comparison - North America

12.4.1 US - Market size and forecast 2025-2030

Chart on US - Market size and forecast 2025-2030 ($ million)
Data Table on US - Market size and forecast 2025-2030 ($ million)
Chart on US - Year-over-year growth 2025-2030 (%)
Data Table on US - Year-over-year growth 2025-2030 (%)

12.4.2 Canada - Market size and forecast 2025-2030

Chart on Canada - Market size and forecast 2025-2030 ($ million)
Data Table on Canada - Market size and forecast 2025-2030 ($ million)
Chart on Canada - Year-over-year growth 2025-2030 (%)
Data Table on Canada - Year-over-year growth 2025-2030 (%)

12.4.3 Mexico - Market size and forecast 2025-2030

Chart on Mexico - Market size and forecast 2025-2030 ($ million)
Data Table on Mexico - Market size and forecast 2025-2030 ($ million)
Chart on Mexico - Year-over-year growth 2025-2030 (%)
Data Table on Mexico - Year-over-year growth 2025-2030 (%)

12.5 Europe - Market size and forecast 2025-2030

Chart on Europe - Market size and forecast 2025-2030 ($ million)
Data Table on Europe - Market size and forecast 2025-2030 ($ million)
Chart on Europe - Year-over-year growth 2025-2030 (%)
Data Table on Europe - Year-over-year growth 2025-2030 (%)
Chart on Regional Comparison - Europe
Data Table on Regional Comparison - Europe

12.5.1 Germany - Market size and forecast 2025-2030

Chart on Germany - Market size and forecast 2025-2030 ($ million)
Data Table on Germany - Market size and forecast 2025-2030 ($ million)
Chart on Germany - Year-over-year growth 2025-2030 (%)
Data Table on Germany - Year-over-year growth 2025-2030 (%)

12.5.2 UK - Market size and forecast 2025-2030

Chart on UK - Market size and forecast 2025-2030 ($ million)
Data Table on UK - Market size and forecast 2025-2030 ($ million)
Chart on UK - Year-over-year growth 2025-2030 (%)
Data Table on UK - Year-over-year growth 2025-2030 (%)

12.5.3 France - Market size and forecast 2025-2030

Chart on France - Market size and forecast 2025-2030 ($ million)
Data Table on France - Market size and forecast 2025-2030 ($ million)
Chart on France - Year-over-year growth 2025-2030 (%)
Data Table on France - Year-over-year growth 2025-2030 (%)

12.5.4 Italy - Market size and forecast 2025-2030

Chart on Italy - Market size and forecast 2025-2030 ($ million)
Data Table on Italy - Market size and forecast 2025-2030 ($ million)
Chart on Italy - Year-over-year growth 2025-2030 (%)
Data Table on Italy - Year-over-year growth 2025-2030 (%)

12.5.5 Spain - Market size and forecast 2025-2030

Chart on Spain - Market size and forecast 2025-2030 ($ million)
Data Table on Spain - Market size and forecast 2025-2030 ($ million)
Chart on Spain - Year-over-year growth 2025-2030 (%)
Data Table on Spain - Year-over-year growth 2025-2030 (%)

12.5.6 The Netherlands - Market size and forecast 2025-2030

Chart on The Netherlands - Market size and forecast 2025-2030 ($ million)
Data Table on The Netherlands - Market size and forecast 2025-2030 ($ million)
Chart on The Netherlands - Year-over-year growth 2025-2030 (%)
Data Table on The Netherlands - Year-over-year growth 2025-2030 (%)

12.6 South America - Market size and forecast 2025-2030

Chart on South America - Market size and forecast 2025-2030 ($ million)
Data Table on South America - Market size and forecast 2025-2030 ($ million)
Chart on South America - Year-over-year growth 2025-2030 (%)
Data Table on South America - Year-over-year growth 2025-2030 (%)
Chart on Regional Comparison - South America
Data Table on Regional Comparison - South America

12.6.1 Brazil - Market size and forecast 2025-2030

Chart on Brazil - Market size and forecast 2025-2030 ($ million)
Data Table on Brazil - Market size and forecast 2025-2030 ($ million)
Chart on Brazil - Year-over-year growth 2025-2030 (%)
Data Table on Brazil - Year-over-year growth 2025-2030 (%)

12.6.2 Argentina - Market size and forecast 2025-2030

Chart on Argentina - Market size and forecast 2025-2030 ($ million)
Data Table on Argentina - Market size and forecast 2025-2030 ($ million)
Chart on Argentina - Year-over-year growth 2025-2030 (%)
Data Table on Argentina - Year-over-year growth 2025-2030 (%)

12.6.3 Chile - Market size and forecast 2025-2030

Chart on Chile - Market size and forecast 2025-2030 ($ million)
Data Table on Chile - Market size and forecast 2025-2030 ($ million)
Chart on Chile - Year-over-year growth 2025-2030 (%)
Data Table on Chile - Year-over-year growth 2025-2030 (%)

12.7 Middle East and Africa - Market size and forecast 2025-2030

Chart on Middle East and Africa - Market size and forecast 2025-2030 ($ million)
Data Table on Middle East and Africa - Market size and forecast 2025-2030 ($ million)
Chart on Middle East and Africa - Year-over-year growth 2025-2030 (%)
Data Table on Middle East and Africa - Year-over-year growth 2025-2030 (%)
Chart on Regional Comparison - Middle East and Africa
Data Table on Regional Comparison - Middle East and Africa

12.7.1 Saudi Arabia - Market size and forecast 2025-2030

Chart on Saudi Arabia - Market size and forecast 2025-2030 ($ million)
Data Table on Saudi Arabia - Market size and forecast 2025-2030 ($ million)
Chart on Saudi Arabia - Year-over-year growth 2025-2030 (%)
Data Table on Saudi Arabia - Year-over-year growth 2025-2030 (%)

12.7.2 UAE - Market size and forecast 2025-2030

Chart on UAE - Market size and forecast 2025-2030 ($ million)
Data Table on UAE - Market size and forecast 2025-2030 ($ million)
Chart on UAE - Year-over-year growth 2025-2030 (%)
Data Table on UAE - Year-over-year growth 2025-2030 (%)

12.7.3 South Africa - Market size and forecast 2025-2030

Chart on South Africa - Market size and forecast 2025-2030 ($ million)
Data Table on South Africa - Market size and forecast 2025-2030 ($ million)
Chart on South Africa - Year-over-year growth 2025-2030 (%)
Data Table on South Africa - Year-over-year growth 2025-2030 (%)

12.7.4 Turkey - Market size and forecast 2025-2030

Chart on Turkey - Market size and forecast 2025-2030 ($ million)
Data Table on Turkey - Market size and forecast 2025-2030 ($ million)
Chart on Turkey - Year-over-year growth 2025-2030 (%)
Data Table on Turkey - Year-over-year growth 2025-2030 (%)

12.7.5 Israel - Market size and forecast 2025-2030

Chart on Israel - Market size and forecast 2025-2030 ($ million)
Data Table on Israel - Market size and forecast 2025-2030 ($ million)
Chart on Israel - Year-over-year growth 2025-2030 (%)
Data Table on Israel - Year-over-year growth 2025-2030 (%)

12.8 Market opportunity by geography

Market opportunity by geography ($ million)
Data Tables on Market opportunity by geography ($ million)

13. Drivers, Challenges, and Opportunity

13.1 Market drivers

Rapid growth in global logistics infrastructure
Substitution of steel strapping with polyester
Enforcement of sustainable packaging environmental mandates

13.2 Market challenges

Fluctuations in raw polyethylene terephthalate costs
Strict regulatory mandates in European markets
Competition from alternative high tensile materials

13.3 Impact of drivers and challenges

Impact of drivers and challenges in 2025 and 2030

13.4 Market opportunities

Growth in agricultural commodity export
Integration of smart tension monitoring technologies
Expansion of chemical and hazardous transport

14. Competitive Landscape

14.1 Overview

14.2

Overview on criticality of inputs and factors of differentiation

14.3 Landscape disruption

Overview on factors of disruption

14.4 Industry risks

Impact of key risks on business

15. Competitive Analysis

15.1 Companies profiled

Companies covered

15.2 Company ranking index

15.3 Market positioning of companies

Matrix on companies position and classification

15.4 Atmet Group

Atmet Group - Overview
Atmet Group - Product / Service
Atmet Group - Key offerings
SWOT

15.5 CORDSTRAP BV

CORDSTRAP BV - Overview
CORDSTRAP BV - Product / Service
CORDSTRAP BV - Key offerings
SWOT

15.6 Cyklop International

Cyklop International - Overview
Cyklop International - Product / Service
Cyklop International - Key offerings
SWOT

15.7 Fromm Holding AG

Fromm Holding AG - Overview
Fromm Holding AG - Product / Service
Fromm Holding AG - Key offerings
SWOT

15.8 Greenbridge

Greenbridge - Overview
Greenbridge - Product / Service
Greenbridge - Key offerings
SWOT

15.9 Maillis International SA

Maillis International SA - Overview
Maillis International SA - Product / Service
Maillis International SA - Key offerings
SWOT

15.10 Messersi Packaging S.r.l.

Messersi Packaging S.r.l. - Overview
Messersi Packaging S.r.l. - Product / Service
Messersi Packaging S.r.l. - Key offerings
SWOT

15.11 Mosca GmbH

Mosca GmbH - Overview
Mosca GmbH - Product / Service
Mosca GmbH - Key offerings
SWOT

15.12 Narrowtex Pty Ltd.

Narrowtex Pty Ltd. - Overview
Narrowtex Pty Ltd. - Product / Service
Narrowtex Pty Ltd. - Key offerings
SWOT

15.13 PAC Strapping Products Inc.

PAC Strapping Products Inc. - Overview
PAC Strapping Products Inc. - Product / Service
PAC Strapping Products Inc. - Key offerings
SWOT

15.14 Samuel Packaging Systems Group

Samuel Packaging Systems Group - Overview
Samuel Packaging Systems Group - Product / Service
Samuel Packaging Systems Group - Key offerings
SWOT

15.15 Signode Industrial Group LLC

Signode Industrial Group LLC - Overview
Signode Industrial Group LLC - Product / Service
Signode Industrial Group LLC - Key offerings
SWOT

15.16 StraPack Corp.

StraPack Corp. - Overview
StraPack Corp. - Product / Service
StraPack Corp. - Key offerings
SWOT

15.17 Teufelberger Holding AG

Teufelberger Holding AG - Overview
Teufelberger Holding AG - Product / Service
Teufelberger Holding AG - Key offerings
SWOT

15.18 TITAN Umreifungstechnik GmbH

TITAN Umreifungstechnik GmbH - Overview
TITAN Umreifungstechnik GmbH - Product / Service
TITAN Umreifungstechnik GmbH - Key offerings
SWOT

16. Appendix

16.1 Scope of the report

Market definition
Objectives
Notes and caveats

16.2 Inclusions and exclusions checklist

Inclusions checklist
Exclusions checklist

16.3 Currency conversion rates for US$

16.4 Research methodology

16.5 Data procurement

Information sources

16.6 Data validation

16.7 Validation techniques employed for market sizing

16.8 Data synthesis

16.9 360 degree market analysis

16.10 List of abbreviations

Research Methodology

Technavio presents a detailed picture of the market by way of study, synthesis, and summation of data from multiple sources. The analysts have presented the various facets of the market with a particular focus on identifying the key industry influencers. The data thus presented is comprehensive, reliable, and the result of extensive research, both primary and secondary.

INFORMATION SOURCES

Primary sources

  • Manufacturers and suppliers
  • Channel partners
  • Industry experts
  • Strategic decision makers

Secondary sources

  • Industry journals and periodicals
  • Government data
  • Financial reports of key industry players
  • Historical data
  • Press releases

DATA ANALYSIS

Data Synthesis

  • Collation of data
  • Estimation of key figures
  • Analysis of derived insights

Data Validation

  • Triangulation with data models
  • Reference against proprietary databases
  • Corroboration with industry experts

REPORT WRITING

Qualitative

  • Market drivers
  • Market challenges
  • Market trends
  • Five forces analysis

Quantitative

  • Market size and forecast
  • Market segmentation
  • Geographical insights
  • Competitive landscape

Interested in this report?

Get your sample now to see our research methodology and insights!

Download Now

Frequently Asked Questions

Polyester Straps market growth will increase by USD 1402.6 million during 2026-2030.

The Polyester Straps market is expected to grow at a CAGR of 15.1% during 2026-2030.

Polyester Straps market is segmented by Grade type (Machine grade, Hand grade) Application (Palletizing and load unitizing, Bundling, Heavy duty baling) End-user (Paper and corrugated packaging, Food and beverage, Textiles and apparels, Chemicals and fertilizers)

Atmet Group, CORDSTRAP BV, Cyklop International, Fromm Holding AG, Greenbridge, Grip Strapping Technologies Ltd, Lenzen Gruppe, LINDER GmbH, Maillis International SA, Messersi Packaging S.r.l., Mosca GmbH, Narrowtex Pty Ltd., PAC Strapping Products Inc., Samuel Packaging Systems Group, Signode Industrial Group LLC, StraPack Corp., Teufelberger Holding AG, TITAN Umreifungstechnik GmbH, Zhenhua Packaging are a few of the key vendors in the Polyester Straps market.

APAC will register the highest growth rate of 44.5% among the other regions. Therefore, the Polyester Straps market in APAC is expected to garner significant business opportunities for the vendors during the forecast period.

China, Japan, India, South Korea, Indonesia, Australia, US, Canada, Mexico, Germany, UK, France, Italy, Spain, The Netherlands, Brazil, Argentina, Chile, Saudi Arabia, UAE, South Africa, Turkey, Israel

  • Rapid growth in global logistics infrastructure is the driving factor this market.

The Polyester Straps market vendors should focus on grabbing business opportunities from the Grade type segment as it accounted for the largest market share in the base year.
RIA - Research AI Assistant
Ask RIA
