Polymer Fillers Market Analysis APAC, North America, Europe, Middle East and Africa, South America - China, Japan, US, Germany, UK - Size and Forecast 2024-2028

Polymer Fillers Market Analysis APAC, North America, Europe, Middle East and Africa, South America - China, Japan, US, Germany, UK - Size and Forecast 2024-2028

Published: Jun 2024 180 Pages SKU: IRTNTR46494

Market Overview at a Glance

$9.47 B
Market Opportunity
3.2%
CAGR
3.06
YoY growth 2023-2024(%)

Polymer Fillers Market Size 2024-2028

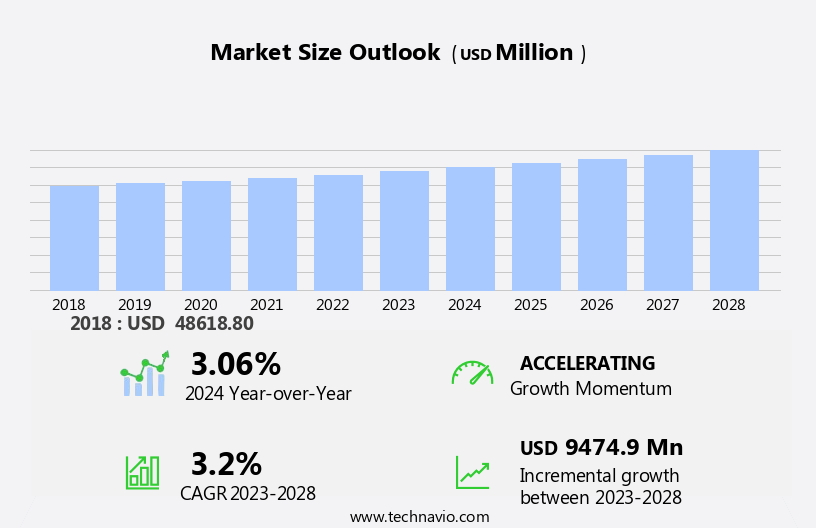
The polymer fillers market size is forecast to increase by USD 9.47 billion at a CAGR of 3.2% between 2023 and 2028.

  • The market is experiencing significant growth due to the increasing usage of high-performance polymers in various industries. Key fillers such as aluminum, zinc, magnesium, talc, lime, and salt are extensively used as reinforcements in polymers to enhance their properties. The demand for lightweight materials, particularly in the packaging, automotive, and construction sectors, is driving the market growth. However, the volatility in raw material prices, especially for crude oil and carbon black, poses a challenge to market participants. Nanofillers like graphene, graphite, and carbon black are gaining popularity due to their superior properties and are expected to influence the market dynamics. Additionally, the rise of e-commerce and the increasing demand for flooring, roofing, insulation, and composite materials are providing new opportunities for market expansion.

What will be the Size of the Polymer Fillers Market During the Forecast Period?

Polymer Fillers Market Size

 Request Free Sample

  • The market encompasses a wide range of inorganic and organic materials used to enhance the properties of polymers. Key trends include the demand for eco-friendly alternatives, such as natural fibers like hemp and organic fillers, due to their reduced carbon footprint and easy availability. Inorganic fillers, including metal hydroxides, oxides, and salts, continue to dominate the market due to their low cost and superior performance in terms of strength and durability. However, concerns over environmental impacts are driving research and development efforts toward more sustainable options. Non-toxic environments are a priority, leading to increased interest in natural fillers and the reduction of no environmental constraints In the production process.
  • Industryarc reports that The market is expected to grow at a significant rate due to these trends and the versatility of polymer fillers in various industries. Flour, polypropylene, limestone, and other fillers are also finding extensive applications in adhesives, sealants, and concrete industries. Overall, the market is expected to witness growth In the coming years, with trends such as increasing demand from the construction sector and the use of eco-friendly and sustainable fillers shaping the market landscape.

How is this Polymer Fillers Industry segmented and which is the largest segment?

The polymer fillers industry research report provides comprehensive data (region-wise segment analysis), with forecasts and estimates in "USD million" for the period 2024-2028, as well as historical data from 2018-2022 for the following segments.

  • End-user
    • Building and construction
    • Automotive
    • Electrical and electronics
    • Industrial
    • Others
  • Type
    • Inorganic fillers
    • Organic fillers
  • Geography
    • APAC
      • China
      • Japan
    • North America
      • US
    • Europe
      • Germany
      • UK
    • Middle East and Africa
    • South America

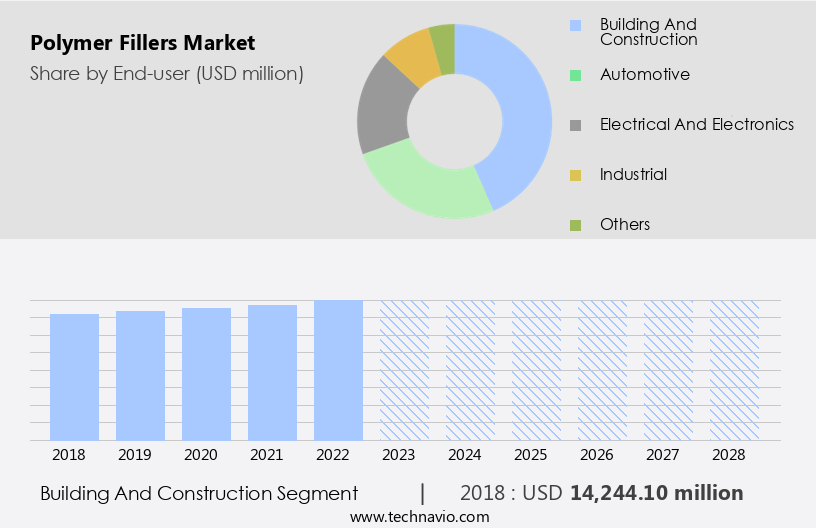
By End-user Insights

  • The building and construction segment is estimated to witness significant growth during the forecast period.

The market In the building and construction sector is projected to experience steady growth due to the enhancement of mechanical, thermal, and chemical properties of polymer-based materials in various construction applications. These fillers, which include inorganic and organic materials, improve the strength, durability, and resistance of polymers to environmental factors such as moisture, temperature fluctuations, and UV radiation. Commonly used fillers include calcium carbonate, silica, carbon black, and natural fibers. Inorganic fillers like oxides, silicates, and salts offer high-quality characteristics but can have limited application due to their costly nature. Organic fillers, such as hydroxides, are non-toxic and environmentally friendly, making them suitable for adhesives and non-biodegradable polymer fillers.

New technologies, including carbon nanotubes, graphene oxide, and nanoclay, are gaining popularity due to their advanced properties. The industry is driven by factors such as cost reduction, sustainability, and changing lifestyle, industrialization, and urbanization trends. The supply chain for raw materials, including carbon footprint concerns, may experience disruptions, necessitating initiative plans for binder materials and filler materials. The automotive sector, electrical and electronics, consumer goods, and industrial sectors also utilize polymer fillers for their cost reduction, tensile strength, heat resistance, toughness, color, clarity, and insulating properties.

Polymer Fillers Market Size

Get a glance at the market report of share of various segments Request Free Sample

The Building and construction segment was valued at USD 14.24 billion in 2018 and showed a gradual increase during the forecast period.

Regional Analysis

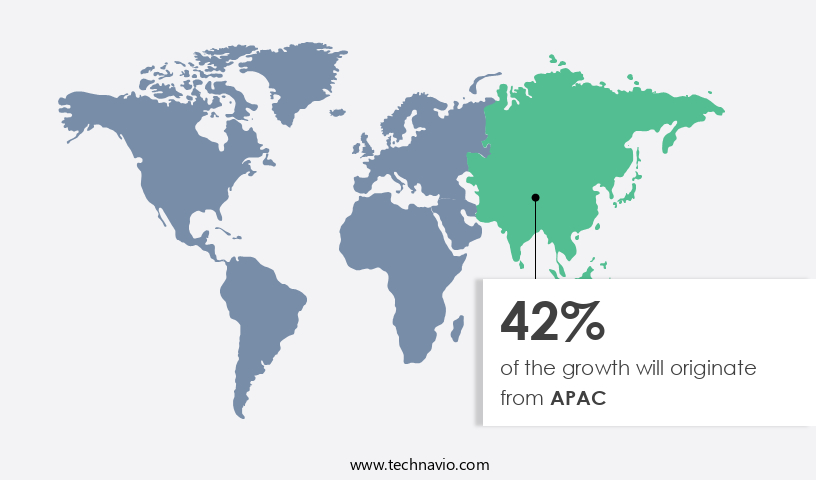
  • APAC is estimated to contribute 42% to the growth of the global market during the forecast period.

Technavio's analysts have elaborately explained the regional trends and drivers that shape the market during the forecast period.

Polymer Fillers Market Share by Geography

For more insights on the market size of various regions, Request Free Sample

The market is experiencing significant growth, particularly In the Asia Pacific (APAC) region. The region's expanding packaging industry and increasing agricultural activities are key drivers for market growth. Notably, the rise of e-commerce companies, such as Taobao, Flipkart Internet Pvt. Ltd., Alibaba.Com, Snapdeal, Didi Chuxing, Rakuten Inc., and Coupang Corp., is fueling demand for polymer fillers. These companies utilize bio-based plastics for packaging, which are derived from biodegradable polymer fillers. These fillers offer high-impact strength, ensuring product protection during transportation. Inorganic fillers, including hydroxides, carbon nanotubes, and graphene oxide, are commonly used in polymer compounds for their ease of availability, low cost, and non-toxicity.

New technologies, such as those using nanoclay, carbon fibers, and glass fibers, are also gaining popularity for their high-quality characteristics. Despite the benefits, the use of non-biodegradable materials raises concerns regarding sustainability and environmental impacts. IndustryARC reports that the market for polymer fillers is expected to grow, driven by advancements in processing techniques and the development of new products using raw materials like calcium carbonate, silica, and carbon black. However, supply chain disruptions and economic downturns may pose challenges to market growth.

Market Dynamics

Our researchers analyzed the data with 2023 as the base year, along with the key drivers, trends, and challenges. A holistic analysis of drivers will help companies refine their marketing strategies to gain a competitive advantage.

What are the key market drivers leading to the rise In the adoption of Polymer Fillers Industry?

Usage of nanofillers in polymers is the key driver of the market.

  • The Polymer Fillers Market is experiencing significant growth due to the adoption of new technologies, such as nanofillers, In the production of polymer compounds. Nanofillers, including nanoparticles and nanofibers, offer enhanced mechanical, electrical, optical, and thermal properties, making them ideal for various industries. The increasing consumption of plastics, particularly in countries with large populations like China and India, is driving the demand for polymer compounds, thereby fueling market growth. The packaging industry, which heavily relies on adhesives, sealants, and plastic films, is a major consumer of nanofillers, contributing to the global market expansion. Inorganic fillers, such as hydroxides, oxides, silicates, and salts, are commonly used In the industry.
  • Organic fillers, including natural fibers and wood flour, are also gaining popularity due to their sustainability and cost-effectiveness. Despite their benefits, the use of non-biodegradable nanofillers raises concerns regarding their carbon footprint and environmental impact. However, initiatives are underway to develop bio-degradable polymer fillers to mitigate these concerns. Processing techniques, such as melt processing, are being optimized to improve cost reduction, tensile strength, heat resistance, and toughness. Overall, the Polymer Filler Market is expected to continue its growth trajectory, driven by the modernization of industries, changing lifestyle, urbanization, and industrialization.

What are the market trends shaping the Polymer Fillers Industry?

Increasing demand for lightweight materials is the upcoming market trend.

  • The Polymer Filler Market is witnessing significant growth due to the increasing demand for lightweight materials in various industries, such as automotive, construction, and packaging. Inorganic fillers, including hydroxides, carbon black, and oxides, are commonly used to reduce the weight of plastic products while preserving their high-quality characteristics. These fillers offer advantages like easy availability, low cost, and no environmental constraints, making them a popular choice for manufacturers. Moreover, new technologies, such as the use of carbon nanotubes, graphene oxide, nanoclay, and binder materials, are gaining traction In the industry. These advanced fillers offer enhanced properties like tensile strength, heat resistance, toughness, color, and clarity, making them suitable for a wide range of applications.
  • Organic fillers, such as natural fibers, wood flour, and salts, are also gaining popularity due to their sustainability and cost reduction benefits. However, the use of non-biodegradable materials raises health concerns, and the industry is exploring the use of bio-degradable polymer fillers to address these issues. Processing techniques like melt processing and raw material selection play a crucial role In the production of polymer fillers. The supply chain disruption due to the pandemic has highlighted the importance of having a diversified supply base and exploring new sources of raw materials. In the automotive sector, the use of fillers in polypropylene (PP) compounds is a significant trend, as it helps reduce the weight of vehicles and improve their fuel efficiency.
  • The construction industry also relies heavily on filler materials for insulating roofing, flooring, and concrete. The Electrical & electronics and consumer goods industries are also major consumers of polymer fillers, with the demand driven by the need for lightweight and durable products. The industrial sector, particularly In the areas of building & construction and filler materials, is expected to witness significant growth In the medium-term due to modernization, changing lifestyle, industrialization, and urbanization initiatives. Despite the benefits, the use of fillers also raises environmental concerns, particularly with regard to their carbon footprint. Unimin Corporation, a leading player In the industry, is taking steps to reduce its carbon footprint by exploring new production techniques and using renewable energy sources.
  • The industry is also exploring the use of natural polymer fillers to reduce its environmental impact. The Polymer Filler Market is expected to witness significant growth In the coming years, driven by the increasing demand for lightweight materials in various industries and the development of new technologies. However, the industry also faces challenges, including environmental concerns and supply chain disruptions, which need to be addressed to ensure sustainable growth.

What challenges does the Polymer Fillers Industry face during its growth?

Volatility in raw material prices is a key challenge affecting the industry growth.

  • The Polymer Filler Market is significantly influenced by the cost of raw materials, which can impact production costs, profit margins, and the prices of end products. Inorganic fillers, such as hydroxides, carbon black, glass fibers, carbon fibers, oxides, and silicates, are commonly used In the production of polymer fillers. The availability and cost of these raw materials can fluctuate due to various factors, including supply and demand, geopolitical issues, and environmental regulations. For instance, the availability of minerals like calcium carbonate, talc, and silica, which are widely used as fillers, can cause price volatility In the market. Moreover, the price of crude oil, a key raw material used In the manufacture of chemicals for fillers, can also impact the cost of raw materials In the Polymer Filler Market.
  • Organic fillers, such as natural fibers, wood flour, and nanoclay, are also used In the production of polymer fillers, and their availability and cost can also influence market dynamics. The use of advanced technologies, such as carbon nanotubes, graphene oxide, and nanoclay, is increasing In the production of high-quality characteristics, such as tensile strength, heat resistance, toughness, color, clarity, and insulating properties, in various industries, including automotive, construction, electrical & electronics, consumer goods, and industrial applications. However, the use of non-biodegradable polymer fillers can raise health concerns and environmental impacts. IndustryARC reports that the market for polymer fillers is expected to grow In the medium-term due to modernization, changing lifestyle, industrialization, urbanization, and the development of new technologies.
  • Cost reduction is a key driver In the market, as polymer fillers improve the properties of polymers, reduce the amount of raw materials used, and lower the carbon footprint of end products. Processing techniques, such as melt processing, are also being optimized to increase efficiency and reduce costs. New products and raw materials, such as bio-degradable polymer fillers, are being developed to address sustainability concerns and meet the evolving needs of various industries. Despite these initiatives, supply chain disruptions can occur due to various factors, including geopolitical issues and natural disasters, which can impact the availability and cost of raw materials and, ultimately, the profitability of the Polymer Filler Market.

Exclusive Customer Landscape

The polymer fillers market forecasting report includes the adoption lifecycle of the market, covering from the innovator's stage to the laggard's stage. It focuses on adoption rates in different regions based on penetration. Furthermore, the polymer fillers market report also includes key purchase criteria and drivers of price sensitivity to help companies evaluate and develop their market growth analysis strategies.

Polymer Fillers Market Share by Geography

 Customer Landscape

Key Companies & Market Insights

Companies are implementing various strategies, such as strategic alliances, polymer fillers market forecast, partnerships, mergers and acquisitions, geographical expansion, and product/service launches, to enhance their presence In the industry.

The industry research and growth report includes detailed analyses of the competitive landscape of the market and information about key companies, including:

  • 20 Microns Ltd.
  • Aditya Birla Management Corp. Pvt. Ltd.
  • Cabot Corp.
  • Covia Holdings LLC
  • Formosa Plastics Corp.
  • GESTORA CATALANA DE RESIDUOS SLU
  • Hoffmann Mineral GmbH
  • Imerys S.A.
  • J M Huber Corp.
  • Jay Minerals
  • Karntner Montanindustrie GmbH
  • Luossavaara Kiirunavaara AB
  • Merit Polymers
  • Minerals Technologies Inc.
  • Mississippi Lime Co.
  • Omya International AG
  • Quartz Works GmbH
  • RAG Stiftung
  • Solvay SA
  • Toray Industries Inc.

Qualitative and quantitative analysis of companies has been conducted to help clients understand the wider business environment as well as the strengths and weaknesses of key industry players. Data is qualitatively analyzed to categorize companies as pure play, category-focused, industry-focused, and diversified; it is quantitatively analyzed to categorize companies as dominant, leading, strong, tentative, and weak.

Research Analyst Overview

The polymer fillers market encompasses a diverse range of inorganic and organic materials used to enhance the properties of polymers. Inorganic fillers, such as hydroxides, offer several advantages, including easy availability, low cost, and a minimal carbon footprint. These fillers do not pose environmental constraints and are non-toxic in a manufacturing environment. Inorganic fillers, including hydroxides, find extensive applications in various industries. For instance, In the automotive sector, they are used In the production of light commercial vehicles to improve the performance of polypropylene (PP) compounds. New technologies, such as carbon nanotubes, graphite, and graphene oxide, are gaining popularity due to their high-quality characteristics and ability to enhance the tensile strength, heat resistance, and toughness of polymers.

Binder materials play a crucial role In the polymer filler market. Sustainability is a key consideration, with a shift towards the use of bio-degradable polymer fillers in various applications. Inorganic fillers, such as calcium carbonate, silica, and carbon black, continue to dominate the market due to their cost-effectiveness and wide availability. However, organic fillers, including natural fibers and wood flour, are gaining traction due to their eco-friendly nature and ability to reduce the use of costly plastic resins. The polymer filler market is influenced by several factors, including processing techniques, supply chain disruptions, and economic downfall. Melt processing is a common technique used to manufacture polymer compounds with fillers.

New products and raw materials are continually being developed to meet the evolving needs of various industries. The construction industry is a significant consumer of filler materials, with applications ranging from insulating roofing and flooring to concrete production. Inorganic fillers, such as silicates and salts, are commonly used due to their high heat resistance and ability to enhance the strength of concrete. The electrical & electronics and consumer goods industries also utilize polymer fillers to improve the performance and durability of their products. The industrial sector is a significant contributor to the polymer filler market, with applications ranging from adhesives to building & construction.

The use of fillers in industrial applications is driven by the need for cost reduction and improved product performance. The polymer filler market is influenced by several trends, including modernization, changing lifestyle, industrialization, and urbanization. Advanced technologies, such as nanoclay and carbon fibers, are being developed to address the environmental impacts of traditional fillers. The use of oxides, metals, and salts is limited due to their high cost and potential health concerns. The polymer filler market is a dynamic and evolving industry driven by the need to enhance the performance and sustainability of polymers. Inorganic and organic fillers offer several advantages, including cost reduction, improved product performance, and eco-friendliness.

The market is influenced by several factors, including processing techniques, supply chain disruptions, and economic conditions. The use of advanced technologies and sustainable fillers is expected to drive the growth of the market In the short-term and medium-term.

Market Scope

Report Coverage

Details

Page number

180

Base year

2023

Historic period

2018-2022

Forecast period

2024-2028

Growth momentum & CAGR

Accelerate at a CAGR of 3.2%

Market growth 2024-2028

USD 9.47 billion

Market structure

Fragmented

YoY growth 2023-2024(%)

3.06

Key countries

China, Japan, US, Germany, and UK

Competitive landscape

Leading Companies, Market Positioning of Companies, Competitive Strategies, and Industry Risks

Request Free Sample

What are the Key Data Covered in this Polymer Fillers Market Research and Growth Report?

  • CAGR of the Polymer Fillers industry during the forecast period
  • Detailed information on factors that will drive the growth and forecasting between 2024 and 2028
  • Precise estimation of the size of the market and its contribution of the industry in focus to the parent market
  • Accurate predictions about upcoming growth and trends and changes in consumer behaviour
  • Growth of the market across APAC, North America, Europe, Middle East and Africa, and South America
  • Thorough analysis of the market's competitive landscape and detailed information about companies
  • Comprehensive analysis of factors that will challenge the polymer fillers market growth of industry companies

We can help! Our analysts can customize this polymer fillers market research report to meet your requirements.

Get in touch

1 Executive Summary

  • 1.1 Market overview
    • Executive Summary - Chart on Market Overview
    • Executive Summary - Data Table on Market Overview
    • Executive Summary - Chart on Global Market Characteristics
    • Executive Summary - Chart on Market by Geography
    • Executive Summary - Chart on Market Segmentation by End-user
    • Executive Summary - Chart on Market Segmentation by Type
    • Executive Summary - Chart on Incremental Growth
    • Executive Summary - Data Table on Incremental Growth
    • Executive Summary - Chart on Company Market Positioning

2 Market Landscape

  • 2.1 Market ecosystem
    • Parent Market
    • Data Table on - Parent Market
  • 2.2 Market characteristics
    • Market characteristics analysis
  • 2.3 Value chain analysis
    • Value Chain Analysis

3 Market Sizing

  • 3.1 Market definition
    • Offerings of companies included in the market definition
  • 3.2 Market segment analysis
    • Market segments
  • 3.3 Market size 2023
    • 3.4 Market outlook: Forecast for 2023-2028
      • Chart on Global - Market size and forecast 2023-2028 ($ million)
      • Data Table on Global - Market size and forecast 2023-2028 ($ million)
      • Chart on Global Market: Year-over-year growth 2023-2028 (%)
      • Data Table on Global Market: Year-over-year growth 2023-2028 (%)

    4 Historic Market Size

    • 4.1 Global Polymer Fillers Market 2018 - 2022
      • Historic Market Size - Data Table on Global Polymer Fillers Market 2018 - 2022 ($ million)
    • 4.2 End-user segment analysis 2018 - 2022
      • Historic Market Size - End-user Segment 2018 - 2022 ($ million)
    • 4.3 Type segment analysis 2018 - 2022
      • Historic Market Size - Type Segment 2018 - 2022 ($ million)
    • 4.4 Geography segment analysis 2018 - 2022
      • Historic Market Size - Geography Segment 2018 - 2022 ($ million)
    • 4.5 Country segment analysis 2018 - 2022
      • Historic Market Size - Country Segment 2018 - 2022 ($ million)

    5 Five Forces Analysis

    • 5.1 Five forces summary
      • Five forces analysis - Comparison between 2023 and 2028
    • 5.2 Bargaining power of buyers
      • Bargaining power of buyers - Impact of key factors 2023 and 2028
    • 5.3 Bargaining power of suppliers
      • Bargaining power of suppliers - Impact of key factors in 2023 and 2028
    • 5.4 Threat of new entrants
      • Threat of new entrants - Impact of key factors in 2023 and 2028
    • 5.5 Threat of substitutes
      • Threat of substitutes - Impact of key factors in 2023 and 2028
    • 5.6 Threat of rivalry
      • Threat of rivalry - Impact of key factors in 2023 and 2028
    • 5.7 Market condition
      • Chart on Market condition - Five forces 2023 and 2028

    6 Market Segmentation by End-user

    • 6.1 Market segments
      • Chart on End-user - Market share 2023-2028 (%)
      • Data Table on End-user - Market share 2023-2028 (%)
    • 6.2 Comparison by End-user
      • Chart on Comparison by End-user
      • Data Table on Comparison by End-user
    • 6.3 Building and construction - Market size and forecast 2023-2028
      • Chart on Building and construction - Market size and forecast 2023-2028 ($ million)
      • Data Table on Building and construction - Market size and forecast 2023-2028 ($ million)
      • Chart on Building and construction - Year-over-year growth 2023-2028 (%)
      • Data Table on Building and construction - Year-over-year growth 2023-2028 (%)
    • 6.4 Automotive - Market size and forecast 2023-2028
      • Chart on Automotive - Market size and forecast 2023-2028 ($ million)
      • Data Table on Automotive - Market size and forecast 2023-2028 ($ million)
      • Chart on Automotive - Year-over-year growth 2023-2028 (%)
      • Data Table on Automotive - Year-over-year growth 2023-2028 (%)
    • 6.5 Electrical and electronics - Market size and forecast 2023-2028
      • Chart on Electrical and electronics - Market size and forecast 2023-2028 ($ million)
      • Data Table on Electrical and electronics - Market size and forecast 2023-2028 ($ million)
      • Chart on Electrical and electronics - Year-over-year growth 2023-2028 (%)
      • Data Table on Electrical and electronics - Year-over-year growth 2023-2028 (%)
    • 6.6 Industrial - Market size and forecast 2023-2028
      • Chart on Industrial - Market size and forecast 2023-2028 ($ million)
      • Data Table on Industrial - Market size and forecast 2023-2028 ($ million)
      • Chart on Industrial - Year-over-year growth 2023-2028 (%)
      • Data Table on Industrial - Year-over-year growth 2023-2028 (%)
    • 6.7 Others - Market size and forecast 2023-2028
      • Chart on Others - Market size and forecast 2023-2028 ($ million)
      • Data Table on Others - Market size and forecast 2023-2028 ($ million)
      • Chart on Others - Year-over-year growth 2023-2028 (%)
      • Data Table on Others - Year-over-year growth 2023-2028 (%)
    • 6.8 Market opportunity by End-user
      • Market opportunity by End-user ($ million)
      • Data Table on Market opportunity by End-user ($ million)

    7 Market Segmentation by Type

    • 7.1 Market segments
      • Chart on Type - Market share 2023-2028 (%)
      • Data Table on Type - Market share 2023-2028 (%)
    • 7.2 Comparison by Type
      • Chart on Comparison by Type
      • Data Table on Comparison by Type
    • 7.3 Inorganic fillers - Market size and forecast 2023-2028
      • Chart on Inorganic fillers - Market size and forecast 2023-2028 ($ million)
      • Data Table on Inorganic fillers - Market size and forecast 2023-2028 ($ million)
      • Chart on Inorganic fillers - Year-over-year growth 2023-2028 (%)
      • Data Table on Inorganic fillers - Year-over-year growth 2023-2028 (%)
    • 7.4 Organic fillers - Market size and forecast 2023-2028
      • Chart on Organic fillers - Market size and forecast 2023-2028 ($ million)
      • Data Table on Organic fillers - Market size and forecast 2023-2028 ($ million)
      • Chart on Organic fillers - Year-over-year growth 2023-2028 (%)
      • Data Table on Organic fillers - Year-over-year growth 2023-2028 (%)
    • 7.5 Market opportunity by Type
      • Market opportunity by Type ($ million)
      • Data Table on Market opportunity by Type ($ million)

    8 Customer Landscape

    • 8.1 Customer landscape overview
      • Analysis of price sensitivity, lifecycle, customer purchase basket, adoption rates, and purchase criteria

    9 Geographic Landscape

    • 9.1 Geographic segmentation
      • Chart on Market share by geography 2023-2028 (%)
      • Data Table on Market share by geography 2023-2028 (%)
    • 9.2 Geographic comparison
      • Chart on Geographic comparison
      • Data Table on Geographic comparison
    • 9.3 APAC - Market size and forecast 2023-2028
      • Chart on APAC - Market size and forecast 2023-2028 ($ million)
      • Data Table on APAC - Market size and forecast 2023-2028 ($ million)
      • Chart on APAC - Year-over-year growth 2023-2028 (%)
      • Data Table on APAC - Year-over-year growth 2023-2028 (%)
    • 9.4 North America - Market size and forecast 2023-2028
      • Chart on North America - Market size and forecast 2023-2028 ($ million)
      • Data Table on North America - Market size and forecast 2023-2028 ($ million)
      • Chart on North America - Year-over-year growth 2023-2028 (%)
      • Data Table on North America - Year-over-year growth 2023-2028 (%)
    • 9.5 Europe - Market size and forecast 2023-2028
      • Chart on Europe - Market size and forecast 2023-2028 ($ million)
      • Data Table on Europe - Market size and forecast 2023-2028 ($ million)
      • Chart on Europe - Year-over-year growth 2023-2028 (%)
      • Data Table on Europe - Year-over-year growth 2023-2028 (%)
    • 9.6 Middle East and Africa - Market size and forecast 2023-2028
      • Chart on Middle East and Africa - Market size and forecast 2023-2028 ($ million)
      • Data Table on Middle East and Africa - Market size and forecast 2023-2028 ($ million)
      • Chart on Middle East and Africa - Year-over-year growth 2023-2028 (%)
      • Data Table on Middle East and Africa - Year-over-year growth 2023-2028 (%)
    • 9.7 South America - Market size and forecast 2023-2028
      • Chart on South America - Market size and forecast 2023-2028 ($ million)
      • Data Table on South America - Market size and forecast 2023-2028 ($ million)
      • Chart on South America - Year-over-year growth 2023-2028 (%)
      • Data Table on South America - Year-over-year growth 2023-2028 (%)
    • 9.8 China - Market size and forecast 2023-2028
      • Chart on China - Market size and forecast 2023-2028 ($ million)
      • Data Table on China - Market size and forecast 2023-2028 ($ million)
      • Chart on China - Year-over-year growth 2023-2028 (%)
      • Data Table on China - Year-over-year growth 2023-2028 (%)
    • 9.9 Japan - Market size and forecast 2023-2028
      • Chart on Japan - Market size and forecast 2023-2028 ($ million)
      • Data Table on Japan - Market size and forecast 2023-2028 ($ million)
      • Chart on Japan - Year-over-year growth 2023-2028 (%)
      • Data Table on Japan - Year-over-year growth 2023-2028 (%)
    • 9.10 US - Market size and forecast 2023-2028
      • Chart on US - Market size and forecast 2023-2028 ($ million)
      • Data Table on US - Market size and forecast 2023-2028 ($ million)
      • Chart on US - Year-over-year growth 2023-2028 (%)
      • Data Table on US - Year-over-year growth 2023-2028 (%)
    • 9.11 Germany - Market size and forecast 2023-2028
      • Chart on Germany - Market size and forecast 2023-2028 ($ million)
      • Data Table on Germany - Market size and forecast 2023-2028 ($ million)
      • Chart on Germany - Year-over-year growth 2023-2028 (%)
      • Data Table on Germany - Year-over-year growth 2023-2028 (%)
    • 9.12 UK - Market size and forecast 2023-2028
      • Chart on UK - Market size and forecast 2023-2028 ($ million)
      • Data Table on UK - Market size and forecast 2023-2028 ($ million)
      • Chart on UK - Year-over-year growth 2023-2028 (%)
      • Data Table on UK - Year-over-year growth 2023-2028 (%)
    • 9.13 Market opportunity by geography
      • Market opportunity by geography ($ million)
      • Data Tables on Market opportunity by geography ($ million)

    10 Drivers, Challenges, and Opportunity/Restraints

    • 10.1 Market drivers
      • 10.2 Market challenges
        • 10.3 Impact of drivers and challenges
          • Impact of drivers and challenges in 2023 and 2028
        • 10.4 Market opportunities/restraints

          11 Competitive Landscape

          • 11.1 Overview
            • 11.2 Competitive Landscape
              • Overview on criticality of inputs and factors of differentiation
            • 11.3 Landscape disruption
              • Overview on factors of disruption
            • 11.4 Industry risks
              • Impact of key risks on business

            12 Competitive Analysis

            • 12.1 Companies profiled
              • Companies covered
            • 12.2 Market positioning of companies
              • Matrix on companies position and classification
            • 12.3 Cabot Corp.
              • Cabot Corp. - Overview
              • Cabot Corp. - Business segments
              • Cabot Corp. - Key news
              • Cabot Corp. - Key offerings
              • Cabot Corp. - Segment focus
            • 12.4 Covia Holdings LLC
              • Covia Holdings LLC - Overview
              • Covia Holdings LLC - Product / Service
              • Covia Holdings LLC - Key news
              • Covia Holdings LLC - Key offerings
            • 12.5 Formosa Plastics Corp.
              • Formosa Plastics Corp. - Overview
              • Formosa Plastics Corp. - Product / Service
              • Formosa Plastics Corp. - Key news
              • Formosa Plastics Corp. - Key offerings
            • 12.6 GESTORA CATALANA DE RESIDUOS SLU
              • GESTORA CATALANA DE RESIDUOS SLU - Overview
              • GESTORA CATALANA DE RESIDUOS SLU - Product / Service
              • GESTORA CATALANA DE RESIDUOS SLU - Key offerings
            • 12.7 Hoffmann Mineral GmbH
              • Hoffmann Mineral GmbH - Overview
              • Hoffmann Mineral GmbH - Product / Service
              • Hoffmann Mineral GmbH - Key offerings
            • 12.8 Imerys S.A.
              • Imerys S.A. - Overview
              • Imerys S.A. - Business segments
              • Imerys S.A. - Key news
              • Imerys S.A. - Key offerings
              • Imerys S.A. - Segment focus
            • 12.9 J M Huber Corp.
              • J M Huber Corp. - Overview
              • J M Huber Corp. - Product / Service
              • J M Huber Corp. - Key news
              • J M Huber Corp. - Key offerings
            • 12.10 Jay Minerals
              • Jay Minerals - Overview
              • Jay Minerals - Product / Service
              • Jay Minerals - Key offerings
            • 12.11 Karntner Montanindustrie GmbH
              • Karntner Montanindustrie GmbH - Overview
              • Karntner Montanindustrie GmbH - Product / Service
              • Karntner Montanindustrie GmbH - Key offerings
            • 12.12 Luossavaara Kiirunavaara AB
              • Luossavaara Kiirunavaara AB - Overview
              • Luossavaara Kiirunavaara AB - Product / Service
              • Luossavaara Kiirunavaara AB - Key offerings
            • 12.13 Mississippi Lime Co.
              • Mississippi Lime Co. - Overview
              • Mississippi Lime Co. - Product / Service
              • Mississippi Lime Co. - Key offerings
            • 12.14 Quartz Works GmbH
              • Quartz Works GmbH - Overview
              • Quartz Works GmbH - Product / Service
              • Quartz Works GmbH - Key offerings
            • 12.15 RAG Stiftung
              • RAG Stiftung - Overview
              • RAG Stiftung - Product / Service
              • RAG Stiftung - Key offerings
            • 12.16 Solvay SA
              • Solvay SA - Overview
              • Solvay SA - Business segments
              • Solvay SA - Key news
              • Solvay SA - Key offerings
              • Solvay SA - Segment focus
            • 12.17 Toray Industries Inc.
              • Toray Industries Inc. - Overview
              • Toray Industries Inc. - Business segments
              • Toray Industries Inc. - Key news
              • Toray Industries Inc. - Key offerings
              • Toray Industries Inc. - Segment focus

            13 Appendix

            • 13.1 Scope of the report
              • 13.2 Inclusions and exclusions checklist
                • Inclusions checklist
                • Exclusions checklist
              • 13.3 Currency conversion rates for US$
                • Currency conversion rates for US$
              • 13.4 Research methodology
                • Research methodology
              • 13.5 Data procurement
                • Information sources
              • 13.6 Data validation
                • Data validation
              • 13.7 Validation techniques employed for market sizing
                • Validation techniques employed for market sizing
              • 13.8 Data synthesis
                • Data synthesis
              • 13.9 360 degree market analysis
                • 360 degree market analysis
              • 13.10 List of abbreviations
                • List of abbreviations

              Research Methodology

              Technavio presents a detailed picture of the market by way of study, synthesis, and summation of data from multiple sources. The analysts have presented the various facets of the market with a particular focus on identifying the key industry influencers. The data thus presented is comprehensive, reliable, and the result of extensive research, both primary and secondary.

              INFORMATION SOURCES

              Primary sources

              • Manufacturers and suppliers
              • Channel partners
              • Industry experts
              • Strategic decision makers

              Secondary sources

              • Industry journals and periodicals
              • Government data
              • Financial reports of key industry players
              • Historical data
              • Press releases

              DATA ANALYSIS

              Data Synthesis

              • Collation of data
              • Estimation of key figures
              • Analysis of derived insights

              Data Validation

              • Triangulation with data models
              • Reference against proprietary databases
              • Corroboration with industry experts

              REPORT WRITING

              Qualitative

              • Market drivers
              • Market challenges
              • Market trends
              • Five forces analysis

              Quantitative

              • Market size and forecast
              • Market segmentation
              • Geographical insights
              • Competitive landscape

              Interested in this report?

              Get your sample now to see our research methodology and insights!

              Download Now

              Frequently Asked Questions

              Polymer Fillers market growth will increase by $ 9474.9 mn during 2024-2028 .

              The Polymer Fillers market is expected to grow at a CAGR of 3.2% during 2024-2028 .

              Polymer Fillers market is segmented by End-user( Building and construction, Automotive, Electrical and electronics, Industrial, Others) Type( Inorganic fillers, Organic fillers)

              20 Microns Ltd., Aditya Birla Management Corp. Pvt. Ltd., Cabot Corp., Covia Holdings LLC, Formosa Plastics Corp., GESTORA CATALANA DE RESIDUOS SLU, Hoffmann Mineral GmbH, Imerys S.A., J M Huber Corp., Jay Minerals, Karntner Montanindustrie GmbH, Luossavaara Kiirunavaara AB, Merit Polymers, Minerals Technologies Inc., Mississippi Lime Co., Omya International AG, Quartz Works GmbH, RAG Stiftung, Solvay SA, Toray Industries Inc. are a few of the key vendors in the Polymer Fillers market.

              APAC will register the highest growth rate of 42% among the other regions. Therefore, the Polymer Fillers market in APAC is expected to garner significant business opportunities for the vendors during the forecast period.

              China, Japan, US, Germany, UK

              • Usage of nanofillers in polymersNanofillers such as nanoparticles and nanofibers are some of the new technologies employed in the market in focus. Incorporating nano reinforcements into elastomers has led to the improvement in adhesion is the driving factor this market.
              • rheologic is the driving factor this market.
              • and process behavior. Nanofillers are being considered due to their robust mechanical is the driving factor this market.
              • electrical is the driving factor this market.
              • optical is the driving factor this market.
              • and thermal properties. The increased consumption of plastics is expected to foster the growth of polymer compounds. The demand for nanofillers is high in countries such as China and India is the driving factor this market.
              • which have a high population is the driving factor this market.
              • which reflects the demand for plastic merchandise. The rise in the demand for adhesives is the driving factor this market.
              • sealants is the driving factor this market.
              • and plastic films in the packaging industry is significantly driving the market for nanofillers globally. The competition in the polymer nanofillers market looks to be high due to the vast scope for new manufacturers to enter the competitive market is the driving factor this market.
              • which can ease the production method. Nano-designed thermoplastic materials permit a weight reduction of up to 40% compared with ancient steel chassis elements in automobile-producing sectors. Polymers reinforced with nano-sized fillers are promising candidates for various applications requiring lightweight and high-performance is the driving factor this market.
              • multifunctional materials. Thus is the driving factor this market.
              • the rise in demand for nanofillers in polymers will drive the growth of the polymer fillers market in focus during the forecast period. is the driving factor this market.

              The Polymer Fillers market vendors should focus on grabbing business opportunities from the Building and construction segment as it accounted for the largest market share in the base year.