Post-Consumer Recycled Plastics Market Size 2025-2029
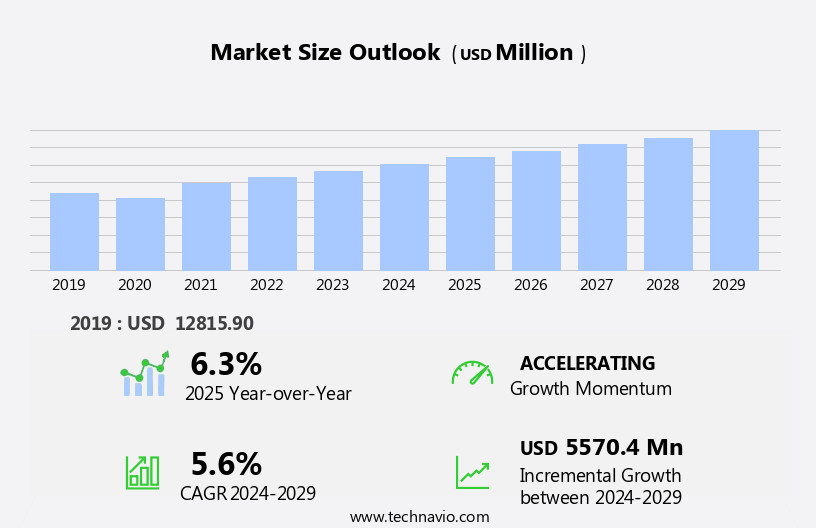
The post-consumer recycled plastics market size is forecast to increase by USD 5.57 billion at a CAGR of 5.6% between 2024 and 2029.
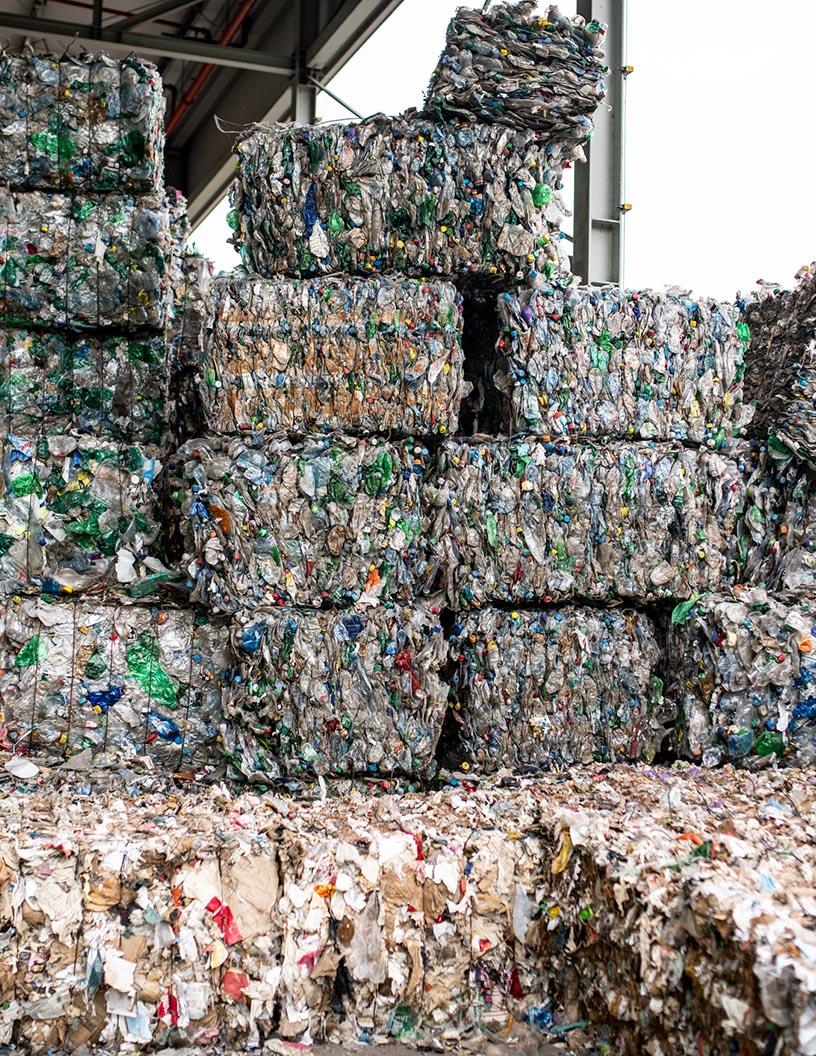
- The Post-Consumer Recycled Plastics (PCR) market is experiencing significant growth, driven primarily by the increasing demand from the packaging industry. This sector's shift towards sustainable and eco-friendly solutions has led to a surge in the adoption of PCR plastics. Additionally, the rise in public awareness about using recycled plastics, fueled by social media campaigns, is further boosting market growth. However, the market faces a substantial challenge due to the low recycling rate of plastics. Despite the growing demand, only a fraction of plastic waste is currently being recycled, presenting a significant barrier to market expansion.
- Companies seeking to capitalize on this market opportunity must focus on improving recycling technologies and collaborating with stakeholders to increase collection and processing efficiency. Navigating this challenge effectively will require innovative solutions and strategic partnerships to bridge the gap between supply and demand for PCR plastics.
What will be the Size of the Post-Consumer Recycled Plastics Market during the forecast period?
- The market continues to evolve, driven by the increasing demand for sustainable solutions and the circular economy principles. Recycled plastics derived from building materials, renewable resources, and waste management systems are gaining traction in various sectors, including consumer goods and building materials. The market dynamics are shaped by ongoing advancements in recycling technologies, such as mechanical and chemical recycling, which enhance the quality and versatility of recycled resins. Policy incentives and regulatory pressure further fuel the growth of this sector, pushing companies to adopt closed-loop recycling systems and increase transparency in their supply chains. Post-consumer recycled plastics offer significant environmental benefits, reducing carbon footprint and minimizing the need for virgin resources.
- Applications span from food containers to recycled polymers and building materials, as the circular economy gains momentum. Bio-based plastics and compostable plastics are complementary solutions that expand the market's scope, providing alternatives to traditional fossil fuel-based plastics. The integration of these innovative materials into the recycling value chain further strengthens the circular economy's principles and contributes to a more sustainable future.
How is this Post-Consumer Recycled Plastics Industry segmented?
The post-consumer recycled plastics industry research report provides comprehensive data (region-wise segment analysis), with forecasts and estimates in "USD million" for the period 2025-2029, as well as historical data from 2019-2023 for the following segments.
- Material
- PET
- HDPE
- PP
- Others
- Source
- Bottles
- Non-bottle rigid plastics
- Others
- End-user
- Packaging
- Construction
- Automotive
- Electronics
- Others
- Sources
- Bottles
- Films
- Foams
- Others
- Geography
- North America
- US
- Mexico
- Europe
- France
- Germany
- Italy
- Spain
- UK
- Middle East and Africa
- UAE
- APAC
- Australia
- China
- India
- Japan
- South Korea
- South America
- Brazil
- Rest of World (ROW)
- North America
By Material Insights
The pet segment is estimated to witness significant growth during the forecast period.
Post-Consumer Recycled Plastics (PCR) have emerged as a significant component of the global plastics market, with PET being the largest segment. PET, a recyclable polymer derived from ethylene glycol and purified terephthalic acid, is widely used in manufacturing low-grade products like carpets and food containers. The polyester resin is often discarded as waste after consumer use, known as post-consumer PET. Waste management agencies and local governments are actively collecting and separating this waste stream from household trash. The recycling process involves material recovery and transforming PCR into recycled resin, which is then used to manufacture new PET products.
Life cycle analysis is crucial in assessing the environmental impact of PCR plastics, considering their carbon footprint and resource depletion. Consumer goods industries increasingly focus on closed-loop recycling and circular economy principles, incorporating recycled content into their products. Building materials, food containers, and packaging are prominent sectors adopting PCR plastics. Policy incentives and regulatory pressure drive the demand for PCR plastics, promoting corporate social responsibility and waste management. Bio-based plastics and compostable plastics are alternative solutions in the market, while mechanical and chemical recycling technologies are essential for PCR production. Renewable resources and circular economy principles are key trends shaping the PCR plastics market.Supply chain transparency is increasingly important for companies to ensure the authenticity and quality of their recycled materials.
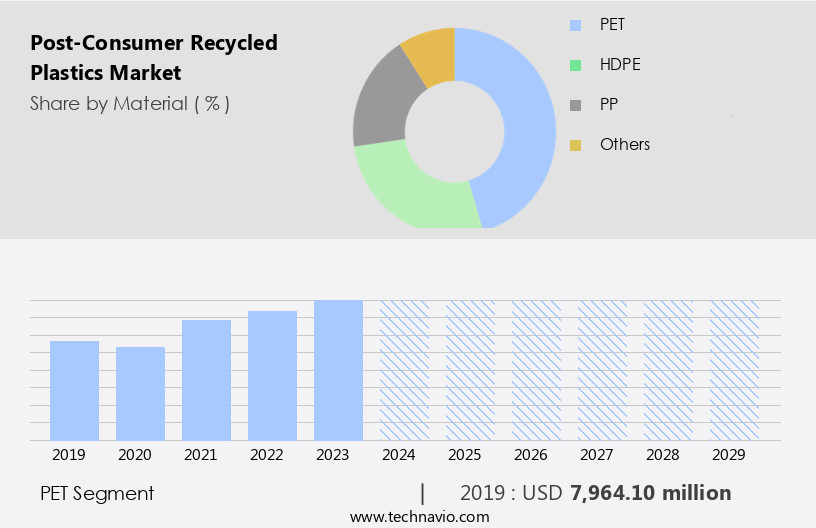
The PET segment was valued at USD 7.96 billion in 2019 and showed a gradual increase during the forecast period.
Regional Analysis
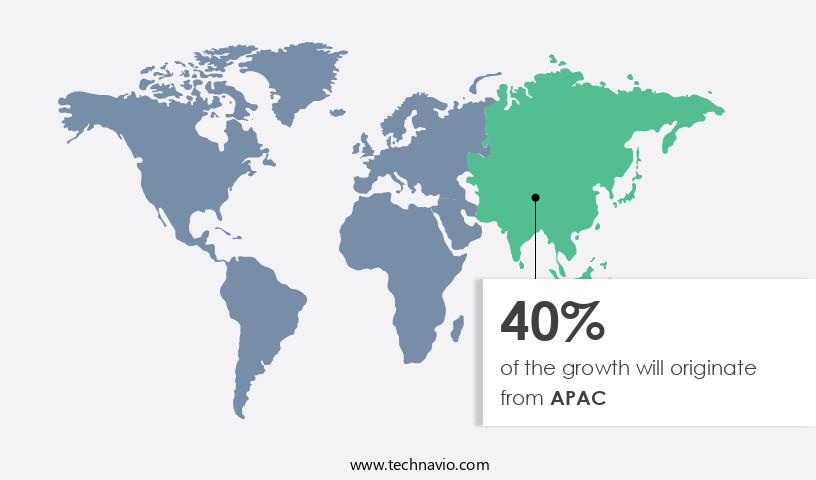
APAC is estimated to contribute 40% to the growth of the global market during the forecast period.Technavio's analysts have elaborately explained the regional trends and drivers that shape the market during the forecast period.
The market in North America is experiencing significant growth, with the Association of Plastic Recyclers leading the charge. This industry organization contributes to over 94% of the region's post-consumer plastic recycling processing capacity. In collaboration with The Recycling Partnership, the Association of Plastic Recyclers is driving demand for recycled plastics by encouraging manufacturers and retailers to incorporate these materials into their products. This initiative, known as Recycle Demand Champions, has gained traction among various industries, particularly packaging. Companies are recognizing the environmental benefits of using recycled plastics and are increasing their usage to enhance their market presence.
The shift towards recycled plastics is not only driven by corporate social responsibility but also by regulatory pressure and the circular economy principles. Recycled polymers, such as recycled resin and post-consumer recycled plastic, are being used to manufacture food containers, building materials, and other consumer goods. Recycling technologies, including mechanical and chemical recycling, are being employed to convert plastic waste into valuable resources. The use of renewable resources and biodegradable plastics is also on the rise, further contributing to the circular economy. Waste management companies and policymakers are investing in recycling infrastructure to support this trend. Overall, the market is evolving, with a focus on closed-loop recycling, supply chain transparency, and sustainable production.
Market Dynamics
Our researchers analyzed the data with 2024 as the base year, along with the key drivers, trends, and challenges. A holistic analysis of drivers will help companies refine their marketing strategies to gain a competitive advantage.
The Global Post-Consumer Recycled Plastics Market grows with recycled plastics for packaging and post-consumer recycled PET. Recycled plastics market trends highlight recycled HDPE for bottles and recycled plastics for automotive parts. Post-consumer recycled plastics for construction and recycled plastics for consumer goods drive sustainability, per recycled plastics market forecast. Recycled PP for textiles leverages advanced recycled plastics processing, while recycled plastics for electronics ensures durability. Post-consumer recycled plastics for retail and recycled plastics for agriculture enhance eco-friendliness. Recycled plastics for food packaging, sustainable recycled plastics production, and recycled plastics for infrastructure optimize resources. Recycled plastics for circular economy, high-quality recycled plastics, recycled plastics supply chain, post-consumer recycled plastics for manufacturing, recycled plastics for renewable energy, and recycled plastics for eco-friendly products fuel growth through 2029.
What are the key market drivers leading to the rise in the adoption of Post-Consumer Recycled Plastics Industry?
- The packaging industry's growing requirement for recycled plastics serves as the primary market catalyst.
- Post-consumer recycled plastics have gained significant attention in various industries due to the increasing awareness of sustainable solutions and healthy living. The packaging sector is particularly focusing on using post-consumer recycled plastics to reduce carbon footprints and contribute to a greener environment. This shift towards recycled plastics is driven by consumers' growing concern for environmental protection. Post-consumer recycled plastics are used extensively in the packaging industry for a wide range of applications. These include the manufacturing of Food and Drug Administration (FDA)-approved food packaging, plastic containers, bottles, closures, jars, engineered pumps, sprayers, and caps. The use of post-consumer recycled plastics in these applications not only reduces the carbon footprint but also contributes to a circular economy.
- The manufacturing process of post-consumer recycled plastics involves material recovery and the conversion of waste plastics into recycled resin. This process reduces the need for virgin plastics, which in turn decreases the overall carbon footprint. Moreover, life cycle analysis shows that the use of post-consumer recycled plastics significantly reduces the carbon footprint compared to virgin plastics. In conclusion, the adoption of post-consumer recycled plastics is a step towards sustainable and eco-friendly solutions. The packaging industry's shift towards using these plastics in various applications is a positive move towards reducing the carbon footprint and contributing to a greener environment.
What are the market trends shaping the Post-Consumer Recycled Plastics Industry?
- The use of recycled plastics is gaining increasing attention and popularity, as demonstrated by the rising awareness campaigns on social media. This trend signifies a significant shift in consumer preferences and market dynamics towards more sustainable and eco-friendly practices.
- The issue of plastic waste and its environmental impact has gained significant attention worldwide. Every year, approximately 300 million tons of plastic are produced globally, with 8-10 million tons ending up in oceans. This trend is detrimental to marine and terrestrial life. To mitigate this issue, various organizations such as The Association of Plastic Recyclers, 5 Gyres, and Recycling of Used Plastics Limited (RECOUP), are advocating for the use of recycled plastics. They are utilizing social media platforms to spread awareness through videos, pictures, and hashtags, emphasizing the importance of closed-loop recycling and recycling technologies.
- Policy incentives from governments also contribute to the growth of the recycled polymers market. The use of recycled materials in consumer goods not only reduces plastic waste but also lessens the carbon footprint, making it a sustainable business practice.
What challenges does the Post-Consumer Recycled Plastics Industry face during its growth?
- The low recycling rate of plastics poses a significant challenge to the growth of the industry, as effective waste management and sustainable production are crucial for its long-term success.
- Plastic, an inexpensive and versatile material, is produced from petroleum and natural gas, making its decomposition rate negligible and contributing to environmental concerns. Annually, over 300 MT of plastics are produced globally, with approximately 8 MT ending up in oceans. To mitigate this issue, governments worldwide promote plastic recycling. However, recycling rates remain low, with over 50% of global plastics waste discarded, around 25% incinerated, and only about 20% recycled. The circular economy principles emphasize the importance of renewable resources and reducing waste. Plastics recycling plays a significant role in this approach. Post-consumer recycled plastics are an essential component of the circular economy, as they reduce the need for virgin materials and minimize waste.
- Supply chain transparency is crucial in the plastic recycling industry. Consumers and businesses demand assurance that recycled content is sourced ethically and sustainably. Renewable resources, such as bio-based plastics, are increasingly being used in place of fossil fuels to create recycled content. Plastic waste management is a complex issue that requires a comprehensive approach. Recycling is just one aspect of the solution. Collaboration between governments, businesses, and consumers is necessary to ensure effective waste management and a more sustainable future for plastics.
Exclusive Customer Landscape
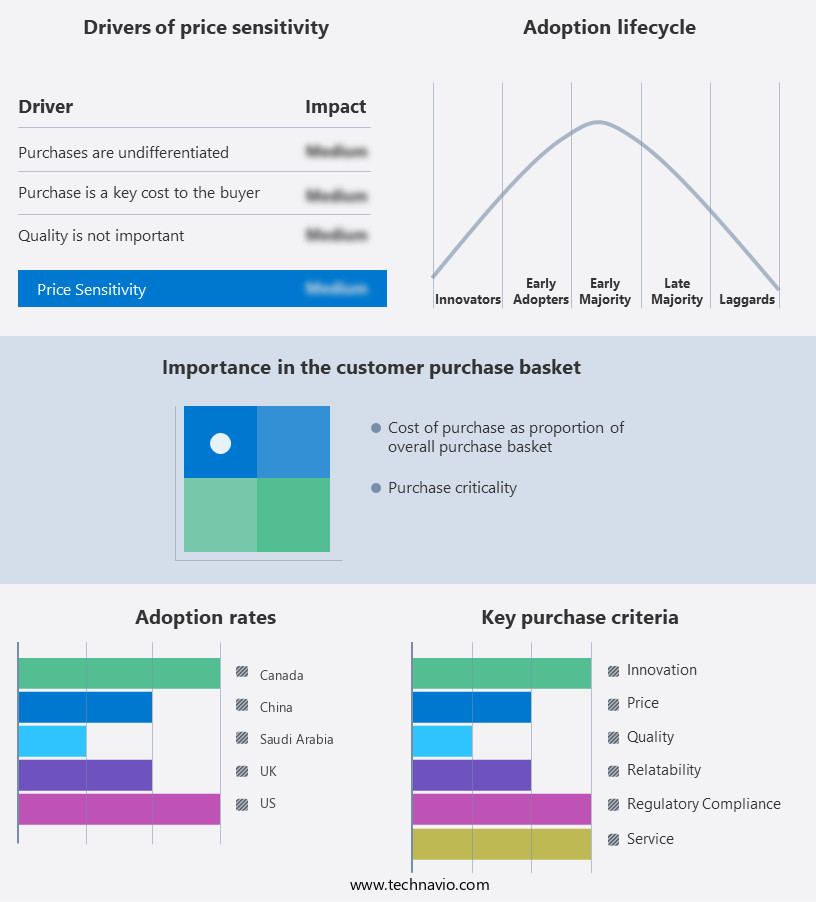
The post-consumer recycled plastics market forecasting report includes the adoption lifecycle of the market, covering from the innovator's stage to the laggard's stage. It focuses on adoption rates in different regions based on penetration. Furthermore, the post-consumer recycled plastics market report also includes key purchase criteria and drivers of price sensitivity to help companies evaluate and develop their market growth analysis strategies.
Customer Landscape
Key Companies & Market Insights
Companies are implementing various strategies, such as strategic alliances, post-consumer recycled plastics market forecast, partnerships, mergers and acquisitions, geographical expansion, and product/service launches, to enhance their presence in the industry.
Veolia - This company specializes in the production and supply of post-consumer recycled resin, a sustainable alternative for food storage applications. By utilizing recycled materials, we contribute to reducing waste and conserving natural resources. Our high-quality resin ensures the safety and freshness of stored food items. The versatility of our product caters to various industries, including food processing and packaging. Through innovative processes and a commitment to environmental stewardship, we provide a reliable and eco-friendly solution for businesses seeking to minimize their carbon footprint.
The industry research and growth report includes detailed analyses of the competitive landscape of the market and information about key companies, including:
- Veolia
- Waste Management
- Suez
- Republic Services
- Plastipak Holdings
- Borealis
- KW Plastics
- CarbonLITE
- Indorama Ventures
- Far Eastern New Century
- Jayplas
- Recycled Plastics UK
- Envision Plastics
- Green Line Polymers
- Clear Path Recycling
- Custom Polymers
- MBA Polymers
- Placon
- ReVital Polymers
- Avangard Innovative
Qualitative and quantitative analysis of companies has been conducted to help clients understand the wider business environment as well as the strengths and weaknesses of key industry players. Data is qualitatively analyzed to categorize companies as pure play, category-focused, industry-focused, and diversified; it is quantitatively analyzed to categorize companies as dominant, leading, strong, tentative, and weak.
Recent Development and News in Post-Consumer Recycled Plastics Market
- In February 2023, global packaging leader Amcor announced the acquisition of a 50% stake in PureCycle Technologies, a pioneering company specializing in the recycling of post-consumer plastics into food-grade PET (polyethylene terephthalate) resin. This strategic move aims to strengthen Amcor's commitment to circular economy solutions and reduce its carbon footprint (Amcor, 2023).
- In October 2024, LyondellBasell, a leading plastics manufacturer, launched its new post-consumer recycled (PCR) polypropylene (PP) resin, named Avantic PP RC. This innovative product, which contains up to 100% recycled content, is designed to meet the growing demand for sustainable packaging solutions in various industries, including automotive, consumer goods, and industrial applications (LyondellBasell, 2024).
- In January 2025, Danone, a global food company, signed a multi-year agreement with Indorama Ventures, a leading global chemical producer, to purchase 100,000 metric tons of post-consumer recycled PET annually. This partnership is a significant step towards Danone's goal of using 100% recycled or renewable plastic packaging by 2025 (Danone, 2025).
- In April 2025, the European Union passed the Single Use Plastics Directive 2, which mandates a 45% collection target for PET bottles by 2027 and a 60% collection target by 2030. This regulatory push is expected to significantly increase the demand for post-consumer recycled plastics in Europe, creating new opportunities for market growth (European Commission, 2025).
Research Analyst Overview
The market is experiencing significant activity and trends, driven by increasing consumer awareness and regulatory policies promoting a circular economy. Recycled plastic labeling is becoming more commonplace, allowing businesses to showcase their commitment to sustainability. Recycling cost analysis reveals that using virgin plastic alternatives can be more expensive, making recycled plastics an attractive alternative. Mechanical and thermal properties of recycled plastics are continually improving due to innovation in plastic recycling technology. Plastic recycling rates are on the rise, yet challenges persist, including ensuring consistent recycled plastic quality and addressing environmental regulations. Recycling partnerships between industries and governments are crucial for advancing plastic recycling research and circular economy policy.
Polymer modification and life cycle assessment are essential tools for optimizing the use of recycled plastics in various applications. Circular economy investment in renewable energy sources and sustainable plastic production is also gaining momentum. Carbon emissions reduction is a key benefit of plastic recycling, making it an essential component of the circular economy. Plastic recycling opportunities extend beyond traditional applications, offering new possibilities for material properties and bioplastics production. Infrastructure development and circular economy education are essential for maximizing the potential of recycled plastics in the US business landscape.
Dive into Technavio's robust research methodology, blending expert interviews, extensive data synthesis, and validated models for unparalleled Post-Consumer Recycled Plastics Market insights. See full methodology.
|
Market Scope |
|
|
Report Coverage |
Details |
|
Page number |
228 |
|
Base year |
2024 |
|
Historic period |
2019-2023 |
|
Forecast period |
2025-2029 |
|
Growth momentum & CAGR |
Accelerate at a CAGR of 5.6% |
|
Market growth 2025-2029 |
USD 5570.4 million |
|
Market structure |
Fragmented |
|
YoY growth 2024-2025(%) |
6.3 |
|
Key countries |
US, China, Germany, Japan, UK, Australia, India, France, Brazil, UAE, Rest of World (ROW), Saudi Arabia, France, South Korea, Mexico, Italy, and Spain |
|
Competitive landscape |
Leading Companies, Market Positioning of Companies, Competitive Strategies, and Industry Risks |
What are the Key Data Covered in this Post-Consumer Recycled Plastics Market Research and Growth Report?
- CAGR of the Post-Consumer Recycled Plastics industry during the forecast period
- Detailed information on factors that will drive the growth and forecasting between 2025 and 2029
- Precise estimation of the size of the market and its contribution of the industry in focus to the parent market
- Accurate predictions about upcoming growth and trends and changes in consumer behaviour
- Growth of the market across North America, APAC, Europe, Middle East and Africa, and South America
- Thorough analysis of the market's competitive landscape and detailed information about companies
- Comprehensive analysis of factors that will challenge the post-consumer recycled plastics market growth of industry companies
We can help! Our analysts can customize this post-consumer recycled plastics market research report to meet your requirements.
 RIA -
RIA - 
