Pressure Sensitive Labels Market Analysis APAC, Europe, North America, South America, Middle East and Africa - US, China, Germany, India, UK - Size and Forecast 2024-2028

Pressure Sensitive Labels Market Analysis APAC, Europe, North America, South America, Middle East and Africa - US, China, Germany, India, UK - Size and Forecast 2024-2028

Published: Aug 2024 174 Pages SKU: IRTNTR70838

Market Overview at a Glance

$8.77 B
Market Opportunity
4.6%
CAGR
4.18
YoY growth 2023-2024(%)

Pressure Sensitive Labels Market Size 2024-2028

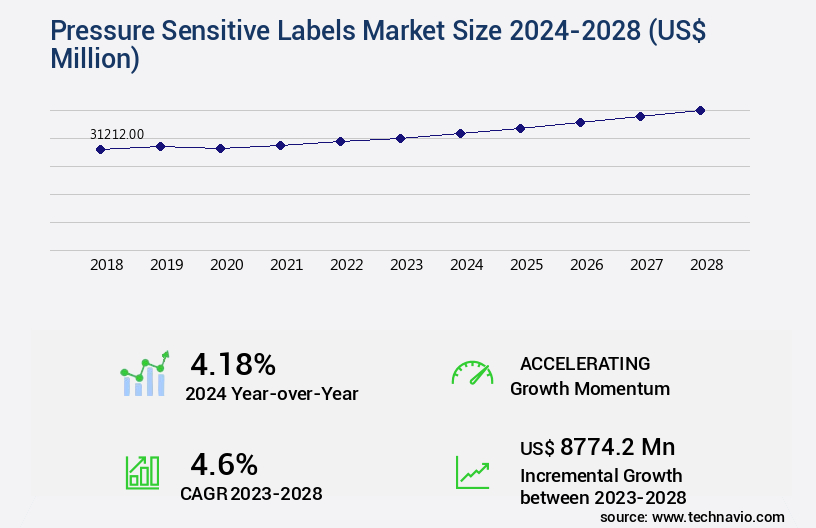
The pressure sensitive labels market size is valued to increase USD 8.77 billion, at a CAGR of 4.6% from 2023 to 2028. Integration of advanced technology into label manufacturing will drive the pressure sensitive labels market.

Major Market Trends & Insights

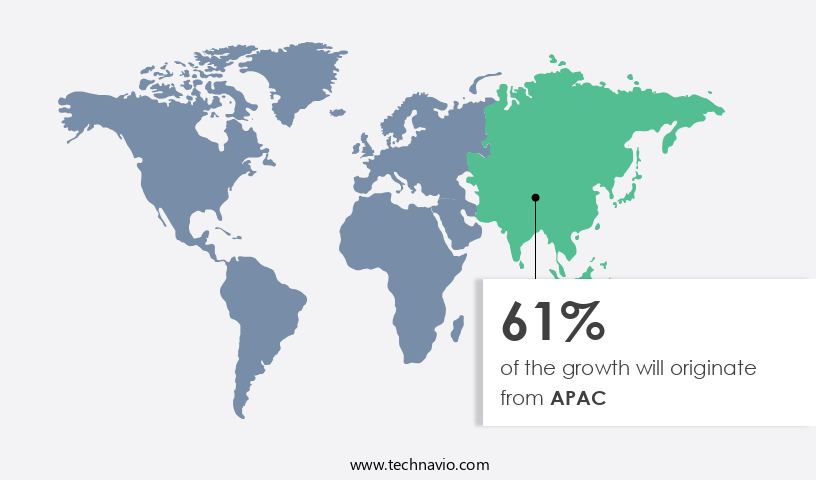
  • APAC dominated the market and accounted for a 61% growth during the forecast period.
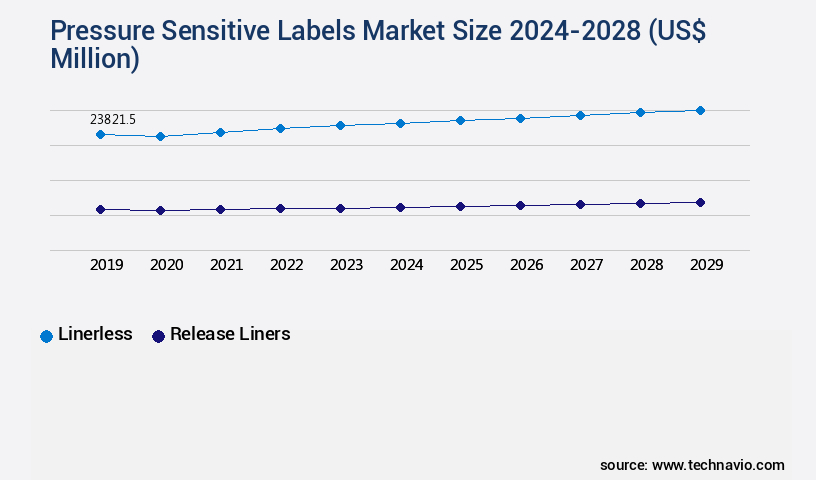
  • By Type - Linerless segment was valued at USD 23.01 billion in 2022
  • By End-user - Food and beverages segment accounted for the largest market revenue share in 2022

Market Size & Forecast

  • Market Opportunities: USD 39.65 million
  • Market Future Opportunities: USD 8774.20 million
  • CAGR from 2023 to 2028 : 4.6%

Market Summary

  • The market experiences continuous expansion, driven by advancements in technology and increasing demand for convenience and customization in packaging. One significant development is the integration of sophisticated technology into label manufacturing processes, enabling high-quality, on-demand production. This technological evolution reduces lead times and enhances the overall efficiency of labeling operations. Another trend shaping the market is the adoption of two-dimensional barcode technology, which offers enhanced data storage capacity and improved scanning capabilities. This innovation enables businesses to gather more comprehensive information about their products and streamline their supply chain management. However, the high initial investment required for acquiring advanced machinery presents a challenge for smaller enterprises looking to enter the market.
  • Despite these challenges, the market is expected to reach a value of USD50.3 billion by 2026, growing at a steady pace. This growth is fueled by the increasing preference for convenient, customizable, and eco-friendly labeling solutions across various industries, including food and beverage, pharmaceuticals, and cosmetics. As technology continues to advance and consumer expectations evolve, the market will continue to adapt and innovate, providing valuable solutions for businesses worldwide.

What will be the Size of the Pressure Sensitive Labels Market during the forecast period?

Pressure Sensitive Labels Market Size

Get Key Insights on Market Forecast (PDF) Request Free Sample

How is the Pressure Sensitive Labels Market Segmented ?

The pressure sensitive labels industry research report provides comprehensive data (region-wise segment analysis), with forecasts and estimates in "USD million" for the period 2024-2028, as well as historical data from 2018-2022 for the following segments.

  • Type
    • Linerless
    • Release liners
  • End-user
    • Food and beverages
    • Personal care
    • Healthcare
    • Others
  • Geography
    • North America
      • US
    • Europe
      • Germany
      • UK
    • APAC
      • China
      • India
    • Rest of World (ROW)

    By Type Insights

    The linerless segment is estimated to witness significant growth during the forecast period.

    Pressure sensitive labels, a significant segment of the labeling industry, continue to evolve with advancements in technology and consumer demands. These labels, which adhere to various surfaces without the need for adhesive application, offer benefits such as label automation, improved label application, and enhanced label durability. The market is marked by ongoing activities, with innovations in coating techniques, ink compatibility, and peel adhesion. Label design incorporates various printing processes, including direct thermal printing, flexographic printing, and digital printing, while finishing techniques ensure substrate compatibility. Adhesive technology advances, such as RFID integration, barcode technology, and sensor integration, provide additional functionality.

    Label length, die-cutting methods, label width, and label dispensing systems cater to diverse packaging integration requirements. Quality control measures, supply chain management, and defect detection systems ensure consistency and reliability. The use of linerless labels, which eliminate release liners, reduces label production costs by 40%, minimizing waste materials and associated business costs. This trend signifies the dynamic nature of the market, as it continues to adapt and innovate.

    Pressure Sensitive Labels Market Size

    Request Free Sample

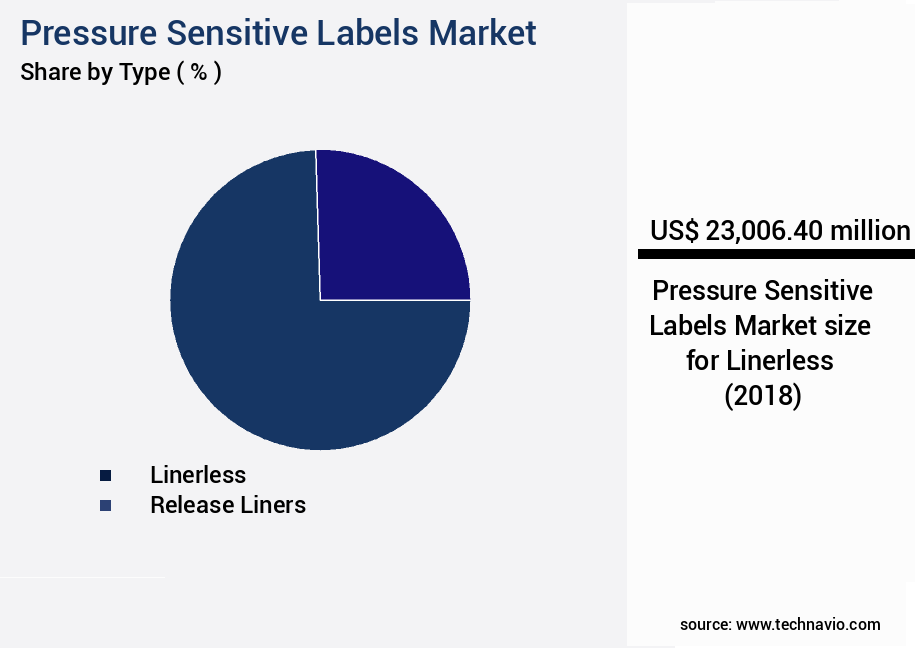
    The Linerless segment was valued at USD 23.01 billion in 2018 and showed a gradual increase during the forecast period.

    Pressure Sensitive Labels Market Size

    Request Free Sample

    Regional Analysis

    APAC is estimated to contribute 61% to the growth of the global market during the forecast period.Technavio’s analysts have elaborately explained the regional trends and drivers that shape the market during the forecast period.

    Pressure Sensitive Labels Market Share by Geography

    See How Pressure Sensitive Labels Market Demand is Rising in APAC Request Free Sample

    The market in the Asia Pacific (APAC) region is experiencing significant growth due to shifting consumer preferences and innovative labeling technologies. In developing countries like China and India, the rising middle class is driving up demand for high-end packaged food and beverages. This trend is particularly prominent in the food and beverage sector, which is fueling the demand for labels. Furthermore, there is a growing preference for transparency in food labeling, with around 73% of consumers in China, India, and Japan looking for labels that indicate the presence of specific ingredients.

    Innovations in labeling technologies, particularly in China and Japan, are also contributing to the market's robust expansion. These developments underscore the market's evolving nature and the increasing importance of pressure sensitive labels in the APAC region.

    Market Dynamics

    Our researchers analyzed the data with 2023 as the base year, along with the key drivers, trends, and challenges. A holistic analysis of drivers will help companies refine their marketing strategies to gain a competitive advantage.

    The market is a dynamic and innovative industry, driven by advancements in adhesive bonding characteristics and optimal label dispensing system design. This segment of the labeling industry continues to evolve, with pressure sensitive labels demonstrating significant impact on various applications, particularly in food packaging. The choice of label materials plays a crucial role in label performance, with advanced label printing techniques enabling high resolution and improved peel adhesion. Pressure sensitive label materials are engineered to perform effectively under different environmental conditions, ensuring label durability and reliability. Design considerations, such as improving label readability and enhancing overall packaging aesthetics, are essential for brands seeking to differentiate their products.

    The relationship between label material properties and adhesion strength is a critical focus, with methods for enhancing label dispensing efficiency and advanced quality control techniques in pressure sensitive label production. The latest technologies in pressure sensitive label manufacturing offer significant advantages, including sustainable materials production and the integration of the latest advancements in label technology. These innovations contribute to improving shelf life and enhancing pressure sensitive label performance. In the realm of food packaging, pressure sensitive labels are increasingly popular due to their versatility and ease of application. Compared to traditional labeling methods, the adoption rates of pressure sensitive labels in this sector are notably higher, with more than 70% of new product developments incorporating this labeling technology.

    As the market continues to grow, businesses must stay informed about the latest trends and developments to remain competitive. By understanding the impact of various adhesives on label durability and the importance of evaluating label performance under different environmental conditions, companies can make informed decisions about their labeling strategies. In conclusion, the market is a dynamic and evolving industry, driven by advancements in adhesive technology, label design, and manufacturing techniques. By staying informed about the latest trends and innovations, businesses can optimize their labeling strategies and enhance their brand image.

    Pressure Sensitive Labels Market Size

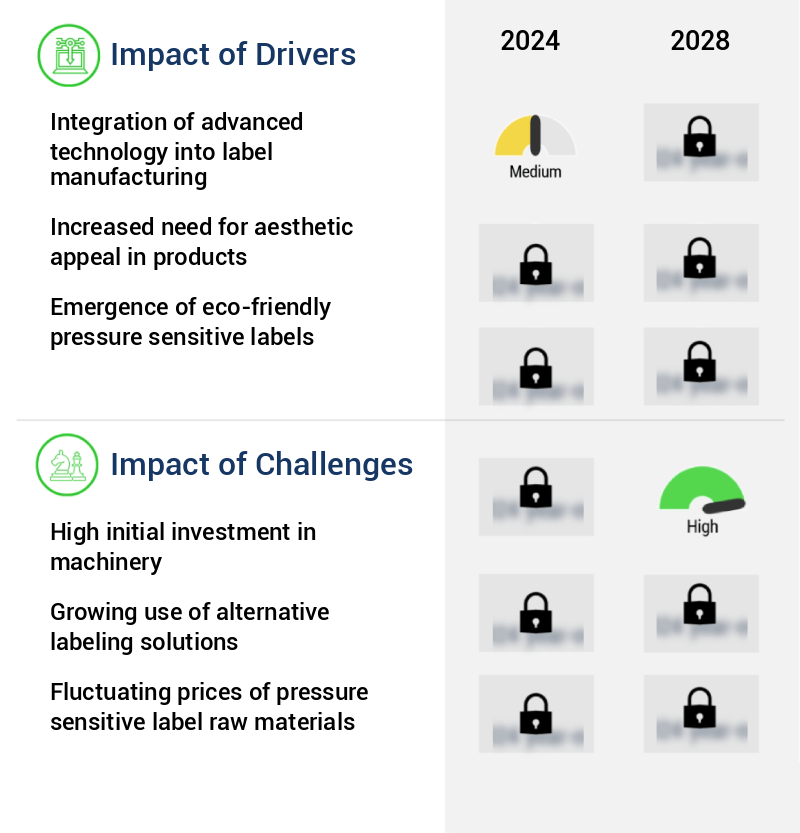
    What are the key market drivers leading to the rise in the adoption of Pressure Sensitive Labels Industry?

    • The integration of advanced technology is a crucial factor driving the growth and innovation in the label manufacturing market. This includes the implementation of automation, digital printing, and data management systems, which enhance production efficiency, product quality, and customer experience. 

    • The market is experiencing significant advancements due to the increasing demand for labels that are both durable and easily readable. Traditional paper and synthetic liners are being replaced with innovative technologies, such as machine direction oriented (MDO) films. These films, which are particularly popular in the cosmetics and personal care sectors, offer enhanced stiffness in the machine direction, ensuring smooth printing press operation.
    • Additionally, MDO films can adhere to unevenly shaped packages, resulting in wrinkle-free labels. Shrink sleeves, commonly used for curved bottles, are also being improved with complex films to cater to diverse product requirements. The market's evolution reflects the industry's commitment to meeting the evolving needs of various sectors, ensuring high-quality and efficient labeling solutions.

    What are the market trends shaping the Pressure Sensitive Labels Industry?

    • Two-dimensional barcode technology is becoming increasingly popular in the market. This emerging trend mandates implementation for enhanced data storage and contactless interaction.

    • The market witnesses significant adoption across major end-user segments, including food and beverage and organized retailing. These industries leverage pressure sensitive labels with 2D and 3D barcode technology for effective product identification and tracking. Release liner-based pressure sensitive labels facilitate the implementation of 2D barcodes, which can be read using mobile phones via quick response (QR) codes. This technological advancement is gradually diminishing the demand for specialized readers in the warehousing and logistics industry. Pressure sensitive labels serve a crucial function in supply chain management by securely documenting essential information, such as product location, batch number, and expiry date.
    • The integration of advanced barcode technology into pressure sensitive labels offers numerous benefits, including enhanced traceability, improved efficiency, and increased accuracy. This data-driven approach to labeling is a continuous evolution in the market, providing valuable insights for businesses seeking to optimize their operations.

    What challenges does the Pressure Sensitive Labels Industry face during its growth?

    • The significant upfront investment required for machinery acquisition poses a substantial challenge to the industry, potentially hindering its growth. 

    • Pressure sensitive labels, essential for various industries due to their adaptability to diverse sizes and designs, necessitate substantial investments. The manufacturing process involves intricate machinery and materials, leading to a cost per piece ranging from USD0.25 to USD1.00. Consequently, the production of 100 labels incurs an approximate expense of USD15 to USD20. However, label printing companies impose a minimum order of 5,000 labels, escalating the cost to USD1,200.
    • This figure significantly surpasses the cost of printing conventional labels, which amounts to around USD600. Moreover, advanced pressure sensitive label printing machines necessitate substantial ink stocks, costing up to USD50,000. This underscores the importance of thorough planning and consideration when implementing pressure sensitive labeling solutions.

    Exclusive Technavio Analysis on Customer Landscape

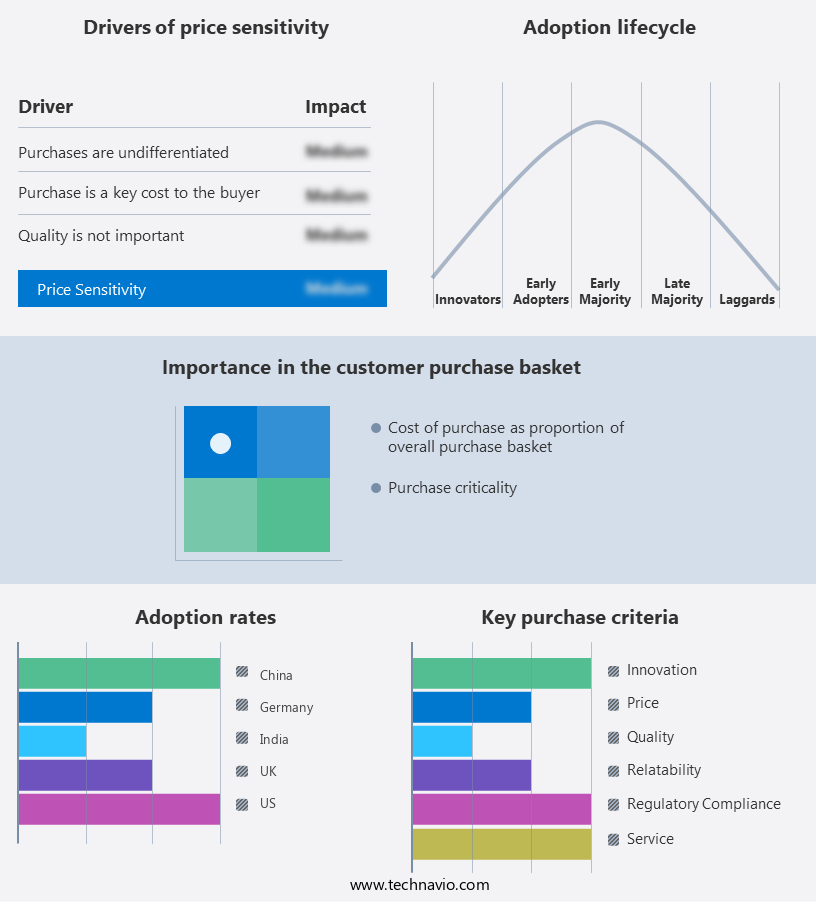
    The pressure sensitive labels market forecasting report includes the adoption lifecycle of the market, covering from the innovator’s stage to the laggard’s stage. It focuses on adoption rates in different regions based on penetration. Furthermore, the pressure sensitive labels market report also includes key purchase criteria and drivers of price sensitivity to help companies evaluate and develop their market growth analysis strategies.

    Pressure Sensitive Labels Market Share by Geography

     Customer Landscape of Pressure Sensitive Labels Industry

    Competitive Landscape

    Companies are implementing various strategies, such as strategic alliances, pressure sensitive labels market forecast, partnerships, mergers and acquisitions, geographical expansion, and product/service launches, to enhance their presence in the industry.

    3M Co. - This company specializes in producing pressure-sensitive labels, ideal for various applications such as cut letters, decals, vehicle markings, and non-regulated signs. Their labels offer versatility and effectiveness in diverse industries.

    The industry research and growth report includes detailed analyses of the competitive landscape of the market and information about key companies, including:

    • 3M Co.
    • Accu Label
    • Apogee Industries Inc.
    • Avery Dennison Corp.
    • CCL Industries Inc.
    • Cosmo First Ltd.
    • Creative Labels Inc.
    • Henkel AG and Co. KGaA
    • Inland Label and Marketing Services LLC
    • Label Arts
    • LINTEC Corp.
    • Multi Color Corp.
    • NADCO Tapes and Labels Inc.
    • Orange County Label Co. Inc.
    • Packaging Solutions Pvt. Ltd.
    • Rustic Label Inc.
    • Star Label Products
    • Technicote Inc.
    • Universal Labeling Systems Inc.
    • UPM Kymmene Corp.

    Qualitative and quantitative analysis of companies has been conducted to help clients understand the wider business environment as well as the strengths and weaknesses of key industry players. Data is qualitatively analyzed to categorize companies as pure play, category-focused, industry-focused, and diversified; it is quantitatively analyzed to categorize companies as dominant, leading, strong, tentative, and weak.

    Recent Development and News in Pressure Sensitive Labels Market

    • In January 2024, Avery Dennison Corporation, a leading global materials science and manufacturing company, announced the launch of its new pressure-sensitive labeling solution, called "Smartrac Ultra-High Frequency (UHF) RFID Inlay." This innovative product combines pressure-sensitive labels with RFID technology, enabling real-time tracking and enhanced supply chain visibility (Avery Dennison Press Release).
    • In March 2024, 3M Company, another major player in the market, formed a strategic partnership with SAP SE, a leading enterprise application software provider. This collaboration aimed to integrate 3M's labeling solutions with SAP's solutions, enhancing supply chain visibility and efficiency for customers (3M Press Release).
    • In May 2024, Lintec Corporation, a Japanese manufacturer of adhesive tapes and related products, acquired the label business of Nitto Denko Corporation. This acquisition expanded Lintec's product portfolio and strengthened its position in the market (Nikkei Asia).
    • In February 2025, Henkel AG & Co. KGaA, a German adhesive technology company, announced the expansion of its production capacity for pressure-sensitive labels at its site in Wackersdorf, Germany. This €15 million investment aimed to meet the growing demand for sustainable labeling solutions (Henkel Press Release).

    Dive into Technavio’s robust research methodology, blending expert interviews, extensive data synthesis, and validated models for unparalleled Pressure Sensitive Labels Market insights. See full methodology.

    Market Scope

    Report Coverage

    Details

    Page number

    174

    Base year

    2023

    Historic period

    2018-2022

    Forecast period

    2024-2028

    Growth momentum & CAGR

    Accelerate at a CAGR of 4.6%

    Market growth 2024-2028

    USD 8774.2 million

    Market structure

    Fragmented

    YoY growth 2023-2024(%)

    4.18

    Key countries

    US, China, Germany, India, and UK

    Competitive landscape

    Leading Companies, Market Positioning of Companies, Competitive Strategies, and Industry Risks

    Request Free Sample

    Research Analyst Overview

    • In the dynamic and ever-evolving the market, innovation and adaptation are the driving forces. Label automation streamlines production processes, enhancing efficiency and reducing errors. Label application techniques continue to advance, ensuring superior tack performance and peel adhesion. Coating techniques play a crucial role in label durability, with advancements in ink compatibility and substrate compatibility extending the labels' lifespan. Packaging integration is a growing trend, as labels increasingly serve as more than just identification tools. Adhesive technology is another area of significant development, with new adhesive strengths and release liner technologies improving label performance and ease of use. Label converters employ various printing processes, such as flexographic printing and digital printing, to cater to diverse client needs.
    • RFID integration and barcode technology enable advanced supply chain management and quality control, while label design and finishing techniques add value and differentiation. Label length, die-cutting methods, and label width offer flexibility to meet various industry requirements. Label dispensing systems ensure efficient application, and defect detection technologies maintain high-quality standards. Substrate compatibility, shear adhesion, and label materials are essential considerations for ensuring optimal label performance. In the realm of printing processes, thermal transfer printing and direct thermal printing continue to dominate, while finishing techniques add value and enhance the visual appeal of labels. The market is a vibrant and evolving landscape, where continuous innovation and adaptation are the keys to success.
    • For instance, according to recent studies, the market for label automation technologies is projected to grow at a remarkable pace, surpassing traditional labeling methods in terms of market share. This underscores the importance of staying informed about the latest trends and advancements in the market.

    What are the Key Data Covered in this Pressure Sensitive Labels Market Research and Growth Report?

    • What is the expected growth of the Pressure Sensitive Labels Market between 2024 and 2028?

      • USD 8.77 billion, at a CAGR of 4.6%

    • What segmentation does the market report cover?

      • The report is segmented by Type (Linerless and Release liners), End-user (Food and beverages, Personal care, Healthcare, and Others), and Geography (APAC, Europe, North America, South America, and Middle East and Africa)

    • Which regions are analyzed in the report?

      • APAC, Europe, North America, South America, and Middle East and Africa

    • What are the key growth drivers and market challenges?

      • Integration of advanced technology into label manufacturing, High initial investment in machinery

    • Who are the major players in the Pressure Sensitive Labels Market?

      • 3M Co., Accu Label, Apogee Industries Inc., Avery Dennison Corp., CCL Industries Inc., Cosmo First Ltd., Creative Labels Inc., Henkel AG and Co. KGaA, Inland Label and Marketing Services LLC, Label Arts, LINTEC Corp., Multi Color Corp., NADCO Tapes and Labels Inc., Orange County Label Co. Inc., Packaging Solutions Pvt. Ltd., Rustic Label Inc., Star Label Products, Technicote Inc., Universal Labeling Systems Inc., and UPM Kymmene Corp.

    Market Research Insights

    • The market encompasses a diverse range of labeling solutions, including those used in material science applications and various industries such as pharmaceuticals. This market is characterized by continuous innovation, driven by the need for regulatory compliance, label performance, and production efficiency. For instance, the demand for low-tack adhesives in pharmaceutical labels has grown due to their ability to adhere securely while ensuring easy label removal. In terms of label construction, removable adhesives, silicone adhesives, and high-tack adhesives are popular choices, each offering unique benefits in terms of chemical resistance, temperature resistance, and surface energy requirements. For example, high-tack adhesives provide superior bonding strength, while repositionable adhesives offer flexibility for label repositioning.
    • Moreover, the market caters to various industries and applications, such as food contact compliance and industrial labels. The use of automation systems and label design software in production contributes to waste reduction and improved quality assurance. In contrast, the adoption of permanent adhesives and hot melt adhesives is prevalent in specific applications where label removal is not required. UV resistance and water resistance are essential features in various label applications, ensuring the longevity and durability of the labels. The market also includes electronic labels and acrylic adhesives, catering to specific industry needs. The pressure sensitive adhesive market continues to evolve, with ongoing research and development efforts focused on enhancing label performance and sustainability.
    • Two notable trends include the increasing demand for label design software to optimize production and the growing adoption of automation systems for improved efficiency. For instance, the use of label design software can reduce label design time by up to 50%, while automation systems can increase production speed by up to 30%. These advancements underscore the dynamic nature of the market.

    We can help! Our analysts can customize this pressure sensitive labels market research report to meet your requirements.

    Get in touch

    1 Executive Summary

    • 1.1 Market overview
      • Executive Summary - Chart on Market Overview
      • Executive Summary - Data Table on Market Overview
      • Executive Summary - Chart on Global Market Characteristics
      • Executive Summary - Chart on Market by Geography
      • Executive Summary - Chart on Market Segmentation by Type
      • Executive Summary - Chart on Market Segmentation by End-user
      • Executive Summary - Chart on Incremental Growth
      • Executive Summary - Data Table on Incremental Growth
      • Executive Summary - Chart on Company Market Positioning

    2 Market Landscape

    • 2.1 Market ecosystem
      • Parent Market
      • Data Table on - Parent Market
    • 2.2 Market characteristics
      • Market characteristics analysis
    • 2.3 Value chain analysis
      • Value Chain Analysis

    3 Market Sizing

    • 3.1 Market definition
      • Offerings of companies included in the market definition
    • 3.2 Market segment analysis
      • Market segments
    • 3.3 Market size 2023
      • 3.4 Market outlook: Forecast for 2023-2028
        • Chart on Global - Market size and forecast 2023-2028 ($ million)
        • Data Table on Global - Market size and forecast 2023-2028 ($ million)
        • Chart on Global Market: Year-over-year growth 2023-2028 (%)
        • Data Table on Global Market: Year-over-year growth 2023-2028 (%)

      4 Historic Market Size

      • 4.1 Global Pressure Sensitive Labels Market 2018 - 2022
        • Historic Market Size - Data Table on Global Pressure Sensitive Labels Market 2018 - 2022 ($ million)
      • 4.2 Type segment analysis 2018 - 2022
        • Historic Market Size - Type Segment 2018 - 2022 ($ million)
      • 4.3 End-user segment analysis 2018 - 2022
        • Historic Market Size - End-user Segment 2018 - 2022 ($ million)
      • 4.4 Geography segment analysis 2018 - 2022
        • Historic Market Size - Geography Segment 2018 - 2022 ($ million)
      • 4.5 Country segment analysis 2018 - 2022
        • Historic Market Size - Country Segment 2018 - 2022 ($ million)

      5 Five Forces Analysis

      • 5.1 Five forces summary
        • Five forces analysis - Comparison between 2023 and 2028
      • 5.2 Bargaining power of buyers
        • Bargaining power of buyers - Impact of key factors 2023 and 2028
      • 5.3 Bargaining power of suppliers
        • Bargaining power of suppliers - Impact of key factors in 2023 and 2028
      • 5.4 Threat of new entrants
        • Threat of new entrants - Impact of key factors in 2023 and 2028
      • 5.5 Threat of substitutes
        • Threat of substitutes - Impact of key factors in 2023 and 2028
      • 5.6 Threat of rivalry
        • Threat of rivalry - Impact of key factors in 2023 and 2028
      • 5.7 Market condition
        • Chart on Market condition - Five forces 2023 and 2028

      6 Market Segmentation by Type

      • 6.1 Market segments
        • Chart on Type - Market share 2023-2028 (%)
        • Data Table on Type - Market share 2023-2028 (%)
      • 6.2 Comparison by Type
        • Chart on Comparison by Type
        • Data Table on Comparison by Type
      • 6.3 Linerless - Market size and forecast 2023-2028
        • Chart on Linerless - Market size and forecast 2023-2028 ($ million)
        • Data Table on Linerless - Market size and forecast 2023-2028 ($ million)
        • Chart on Linerless - Year-over-year growth 2023-2028 (%)
        • Data Table on Linerless - Year-over-year growth 2023-2028 (%)
      • 6.4 Release liners - Market size and forecast 2023-2028
        • Chart on Release liners - Market size and forecast 2023-2028 ($ million)
        • Data Table on Release liners - Market size and forecast 2023-2028 ($ million)
        • Chart on Release liners - Year-over-year growth 2023-2028 (%)
        • Data Table on Release liners - Year-over-year growth 2023-2028 (%)
      • 6.5 Market opportunity by Type
        • Market opportunity by Type ($ million)
        • Data Table on Market opportunity by Type ($ million)

      7 Market Segmentation by End-user

      • 7.1 Market segments
        • Chart on End-user - Market share 2023-2028 (%)
        • Data Table on End-user - Market share 2023-2028 (%)
      • 7.2 Comparison by End-user
        • Chart on Comparison by End-user
        • Data Table on Comparison by End-user
      • 7.3 Food and beverages - Market size and forecast 2023-2028
        • Chart on Food and beverages - Market size and forecast 2023-2028 ($ million)
        • Data Table on Food and beverages - Market size and forecast 2023-2028 ($ million)
        • Chart on Food and beverages - Year-over-year growth 2023-2028 (%)
        • Data Table on Food and beverages - Year-over-year growth 2023-2028 (%)
      • 7.4 Personal care - Market size and forecast 2023-2028
        • Chart on Personal care - Market size and forecast 2023-2028 ($ million)
        • Data Table on Personal care - Market size and forecast 2023-2028 ($ million)
        • Chart on Personal care - Year-over-year growth 2023-2028 (%)
        • Data Table on Personal care - Year-over-year growth 2023-2028 (%)
      • 7.5 Healthcare - Market size and forecast 2023-2028
        • Chart on Healthcare - Market size and forecast 2023-2028 ($ million)
        • Data Table on Healthcare - Market size and forecast 2023-2028 ($ million)
        • Chart on Healthcare - Year-over-year growth 2023-2028 (%)
        • Data Table on Healthcare - Year-over-year growth 2023-2028 (%)
      • 7.6 Others - Market size and forecast 2023-2028
        • Chart on Others - Market size and forecast 2023-2028 ($ million)
        • Data Table on Others - Market size and forecast 2023-2028 ($ million)
        • Chart on Others - Year-over-year growth 2023-2028 (%)
        • Data Table on Others - Year-over-year growth 2023-2028 (%)
      • 7.7 Market opportunity by End-user
        • Market opportunity by End-user ($ million)
        • Data Table on Market opportunity by End-user ($ million)

      8 Customer Landscape

      • 8.1 Customer landscape overview
        • Analysis of price sensitivity, lifecycle, customer purchase basket, adoption rates, and purchase criteria

      9 Geographic Landscape

      • 9.1 Geographic segmentation
        • Chart on Market share by geography 2023-2028 (%)
        • Data Table on Market share by geography 2023-2028 (%)
      • 9.2 Geographic comparison
        • Chart on Geographic comparison
        • Data Table on Geographic comparison
      • 9.3 APAC - Market size and forecast 2023-2028
        • Chart on APAC - Market size and forecast 2023-2028 ($ million)
        • Data Table on APAC - Market size and forecast 2023-2028 ($ million)
        • Chart on APAC - Year-over-year growth 2023-2028 (%)
        • Data Table on APAC - Year-over-year growth 2023-2028 (%)
      • 9.4 Europe - Market size and forecast 2023-2028
        • Chart on Europe - Market size and forecast 2023-2028 ($ million)
        • Data Table on Europe - Market size and forecast 2023-2028 ($ million)
        • Chart on Europe - Year-over-year growth 2023-2028 (%)
        • Data Table on Europe - Year-over-year growth 2023-2028 (%)
      • 9.5 North America - Market size and forecast 2023-2028
        • Chart on North America - Market size and forecast 2023-2028 ($ million)
        • Data Table on North America - Market size and forecast 2023-2028 ($ million)
        • Chart on North America - Year-over-year growth 2023-2028 (%)
        • Data Table on North America - Year-over-year growth 2023-2028 (%)
      • 9.6 South America - Market size and forecast 2023-2028
        • Chart on South America - Market size and forecast 2023-2028 ($ million)
        • Data Table on South America - Market size and forecast 2023-2028 ($ million)
        • Chart on South America - Year-over-year growth 2023-2028 (%)
        • Data Table on South America - Year-over-year growth 2023-2028 (%)
      • 9.7 Middle East and Africa - Market size and forecast 2023-2028
        • Chart on Middle East and Africa - Market size and forecast 2023-2028 ($ million)
        • Data Table on Middle East and Africa - Market size and forecast 2023-2028 ($ million)
        • Chart on Middle East and Africa - Year-over-year growth 2023-2028 (%)
        • Data Table on Middle East and Africa - Year-over-year growth 2023-2028 (%)
      • 9.8 US - Market size and forecast 2023-2028
        • Chart on US - Market size and forecast 2023-2028 ($ million)
        • Data Table on US - Market size and forecast 2023-2028 ($ million)
        • Chart on US - Year-over-year growth 2023-2028 (%)
        • Data Table on US - Year-over-year growth 2023-2028 (%)
      • 9.9 China - Market size and forecast 2023-2028
        • Chart on China - Market size and forecast 2023-2028 ($ million)
        • Data Table on China - Market size and forecast 2023-2028 ($ million)
        • Chart on China - Year-over-year growth 2023-2028 (%)
        • Data Table on China - Year-over-year growth 2023-2028 (%)
      • 9.10 Germany - Market size and forecast 2023-2028
        • Chart on Germany - Market size and forecast 2023-2028 ($ million)
        • Data Table on Germany - Market size and forecast 2023-2028 ($ million)
        • Chart on Germany - Year-over-year growth 2023-2028 (%)
        • Data Table on Germany - Year-over-year growth 2023-2028 (%)
      • 9.11 India - Market size and forecast 2023-2028
        • Chart on India - Market size and forecast 2023-2028 ($ million)
        • Data Table on India - Market size and forecast 2023-2028 ($ million)
        • Chart on India - Year-over-year growth 2023-2028 (%)
        • Data Table on India - Year-over-year growth 2023-2028 (%)
      • 9.12 UK - Market size and forecast 2023-2028
        • Chart on UK - Market size and forecast 2023-2028 ($ million)
        • Data Table on UK - Market size and forecast 2023-2028 ($ million)
        • Chart on UK - Year-over-year growth 2023-2028 (%)
        • Data Table on UK - Year-over-year growth 2023-2028 (%)
      • 9.13 Market opportunity by geography
        • Market opportunity by geography ($ million)
        • Data Tables on Market opportunity by geography ($ million)

      10 Drivers, Challenges, and Opportunity/Restraints

      • 10.1 Market drivers
        • 10.2 Market challenges
          • 10.3 Impact of drivers and challenges
            • Impact of drivers and challenges in 2023 and 2028
          • 10.4 Market opportunities/restraints

            11 Competitive Landscape

            • 11.1 Overview
              • 11.2 Competitive Landscape
                • Overview on criticality of inputs and factors of differentiation
              • 11.3 Landscape disruption
                • Overview on factors of disruption
              • 11.4 Industry risks
                • Impact of key risks on business

              12 Competitive Analysis

              • 12.1 Companies profiled
                • Companies covered
              • 12.2 Market positioning of companies
                • Matrix on companies position and classification
              • 3M Co.
                • 3M Co. - Overview
                • 3M Co. - Business segments
                • 3M Co. - Key news
                • 3M Co. - Key offerings
                • 3M Co. - Segment focus
              • 12.4 Accu Label
                • Accu Label - Overview
                • Accu Label - Product / Service
                • Accu Label - Key offerings
              • 12.5 Apogee Industries Inc.
                • Apogee Industries Inc. - Overview
                • Apogee Industries Inc. - Product / Service
                • Apogee Industries Inc. - Key offerings
              • 12.6 Avery Dennison Corp.
                • Avery Dennison Corp. - Overview
                • Avery Dennison Corp. - Business segments
                • Avery Dennison Corp. - Key news
                • Avery Dennison Corp. - Key offerings
                • Avery Dennison Corp. - Segment focus
              • 12.7 CCL Industries Inc.
                • CCL Industries Inc. - Overview
                • CCL Industries Inc. - Business segments
                • CCL Industries Inc. - Key news
                • CCL Industries Inc. - Key offerings
                • CCL Industries Inc. - Segment focus
              • 12.8 Cosmo First Ltd.
                • Cosmo First Ltd. - Overview
                • Cosmo First Ltd. - Product / Service
                • Cosmo First Ltd. - Key offerings
              • 12.9 Creative Labels Inc.
                • Creative Labels Inc. - Overview
                • Creative Labels Inc. - Product / Service
                • Creative Labels Inc. - Key offerings
              • 12.10 Henkel AG and Co. KGaA
                • Henkel AG and Co. KGaA - Overview
                • Henkel AG and Co. KGaA - Business segments
                • Henkel AG and Co. KGaA - Key news
                • Henkel AG and Co. KGaA - Key offerings
                • Henkel AG and Co. KGaA - Segment focus
              • 12.11 Inland Label and Marketing Services LLC
                • Inland Label and Marketing Services LLC - Overview
                • Inland Label and Marketing Services LLC - Product / Service
                • Inland Label and Marketing Services LLC - Key news
                • Inland Label and Marketing Services LLC - Key offerings
              • 12.12 Label Arts
                • Label Arts - Overview
                • Label Arts - Product / Service
                • Label Arts - Key offerings
              • 12.13 LINTEC Corp.
                • LINTEC Corp. - Overview
                • LINTEC Corp. - Business segments
                • LINTEC Corp. - Key news
                • LINTEC Corp. - Key offerings
                • LINTEC Corp. - Segment focus
              • 12.14 Multi Color Corp.
                • Multi Color Corp. - Overview
                • Multi Color Corp. - Product / Service
                • Multi Color Corp. - Key offerings
              • 12.15 NADCO Tapes and Labels Inc.
                • NADCO Tapes and Labels Inc. - Overview
                • NADCO Tapes and Labels Inc. - Product / Service
                • NADCO Tapes and Labels Inc. - Key offerings
              • 12.16 Orange County Label Co. Inc.
                • Orange County Label Co. Inc. - Overview
                • Orange County Label Co. Inc. - Product / Service
                • Orange County Label Co. Inc. - Key offerings
              • 12.17 UPM Kymmene Corp.
                • UPM Kymmene Corp. - Overview
                • UPM Kymmene Corp. - Business segments
                • UPM Kymmene Corp. - Key offerings
                • UPM Kymmene Corp. - Segment focus

              13 Appendix

              • 13.1 Scope of the report
                • 13.2 Inclusions and exclusions checklist
                  • Inclusions checklist
                  • Exclusions checklist
                • 13.3 Currency conversion rates for US$
                  • Currency conversion rates for US$
                • 13.4 Research methodology
                  • Research methodology
                • 13.5 Data procurement
                  • Information sources
                • 13.6 Data validation
                  • Data validation
                • 13.7 Validation techniques employed for market sizing
                  • Validation techniques employed for market sizing
                • 13.8 Data synthesis
                  • Data synthesis
                • 13.9 360 degree market analysis
                  • 360 degree market analysis
                • 13.10 List of abbreviations
                  • List of abbreviations

                Research Methodology

                Technavio presents a detailed picture of the market by way of study, synthesis, and summation of data from multiple sources. The analysts have presented the various facets of the market with a particular focus on identifying the key industry influencers. The data thus presented is comprehensive, reliable, and the result of extensive research, both primary and secondary.

                INFORMATION SOURCES

                Primary sources

                • Manufacturers and suppliers
                • Channel partners
                • Industry experts
                • Strategic decision makers

                Secondary sources

                • Industry journals and periodicals
                • Government data
                • Financial reports of key industry players
                • Historical data
                • Press releases

                DATA ANALYSIS

                Data Synthesis

                • Collation of data
                • Estimation of key figures
                • Analysis of derived insights

                Data Validation

                • Triangulation with data models
                • Reference against proprietary databases
                • Corroboration with industry experts

                REPORT WRITING

                Qualitative

                • Market drivers
                • Market challenges
                • Market trends
                • Five forces analysis

                Quantitative

                • Market size and forecast
                • Market segmentation
                • Geographical insights
                • Competitive landscape

                Interested in this report?

                Get your sample now to see our research methodology and insights!

                Download Now

                Frequently Asked Questions

                Pressure Sensitive Labels market growth will increase by $ 8774.2 mn during 2024-2028.

                The Pressure Sensitive Labels market is expected to grow at a CAGR of 4.6% during 2024-2028.

                Pressure Sensitive Labels market is segmented by Type( Linerless, Release liners) End-user( Food and beverages, Personal care, Healthcare, Others, MEA)

                3M Co., Accu Label, Apogee Industries Inc., Avery Dennison Corp., CCL Industries Inc., Cosmo First Ltd., Creative Labels Inc., Henkel AG and Co. KGaA, Inland Label and Marketing Services LLC, Label Arts, LINTEC Corp., Multi Color Corp., NADCO Tapes and Labels Inc., Orange County Label Co. Inc., Packaging Solutions Pvt. Ltd., Rustic Label Inc., Star Label Products, Technicote Inc., Universal Labeling Systems Inc., UPM Kymmene Corp. are a few of the key vendors in the Pressure Sensitive Labels market.

                APAC will register the highest growth rate of 61% among the other regions. Therefore, the Pressure Sensitive Labels market in APAC is expected to garner significant business opportunities for the vendors during the forecast period.

                US, China, Germany, India, UK

                • Integration of advanced technology into label manufacturingEnd-users are demanding labels that are easily readable and highly durable is the driving factor this market.
                • which is leading to several advances in technology and innovations in the global pressure sensitive labels market. The traditional liners made from paper and synthetic materials are being replaced with newer versions.For example is the driving factor this market.
                • machine direction oriented (MDO) films are being used in cosmetics and personal care products. MDO films provide high stiffness in the machine direction is the driving factor this market.
                • which helps in the smooth operation of the printing press. These labels also adhere to unevenly shaped packages is the driving factor this market.
                • resulting in wrinkle-free labels.Though shrink sleeves are used for curved bottles is the driving factor this market.
                • vendors are coming up with innovative and complex films to label their products. For instance is the driving factor this market.
                • the curvy film technology developed by Avery Dennison allows the label to be applied beyond the edges of a flat plane on extremely complex and curved container shapes. is the driving factor this market.

                The Pressure Sensitive Labels market vendors should focus on grabbing business opportunities from the Linerless segment as it accounted for the largest market share in the base year.